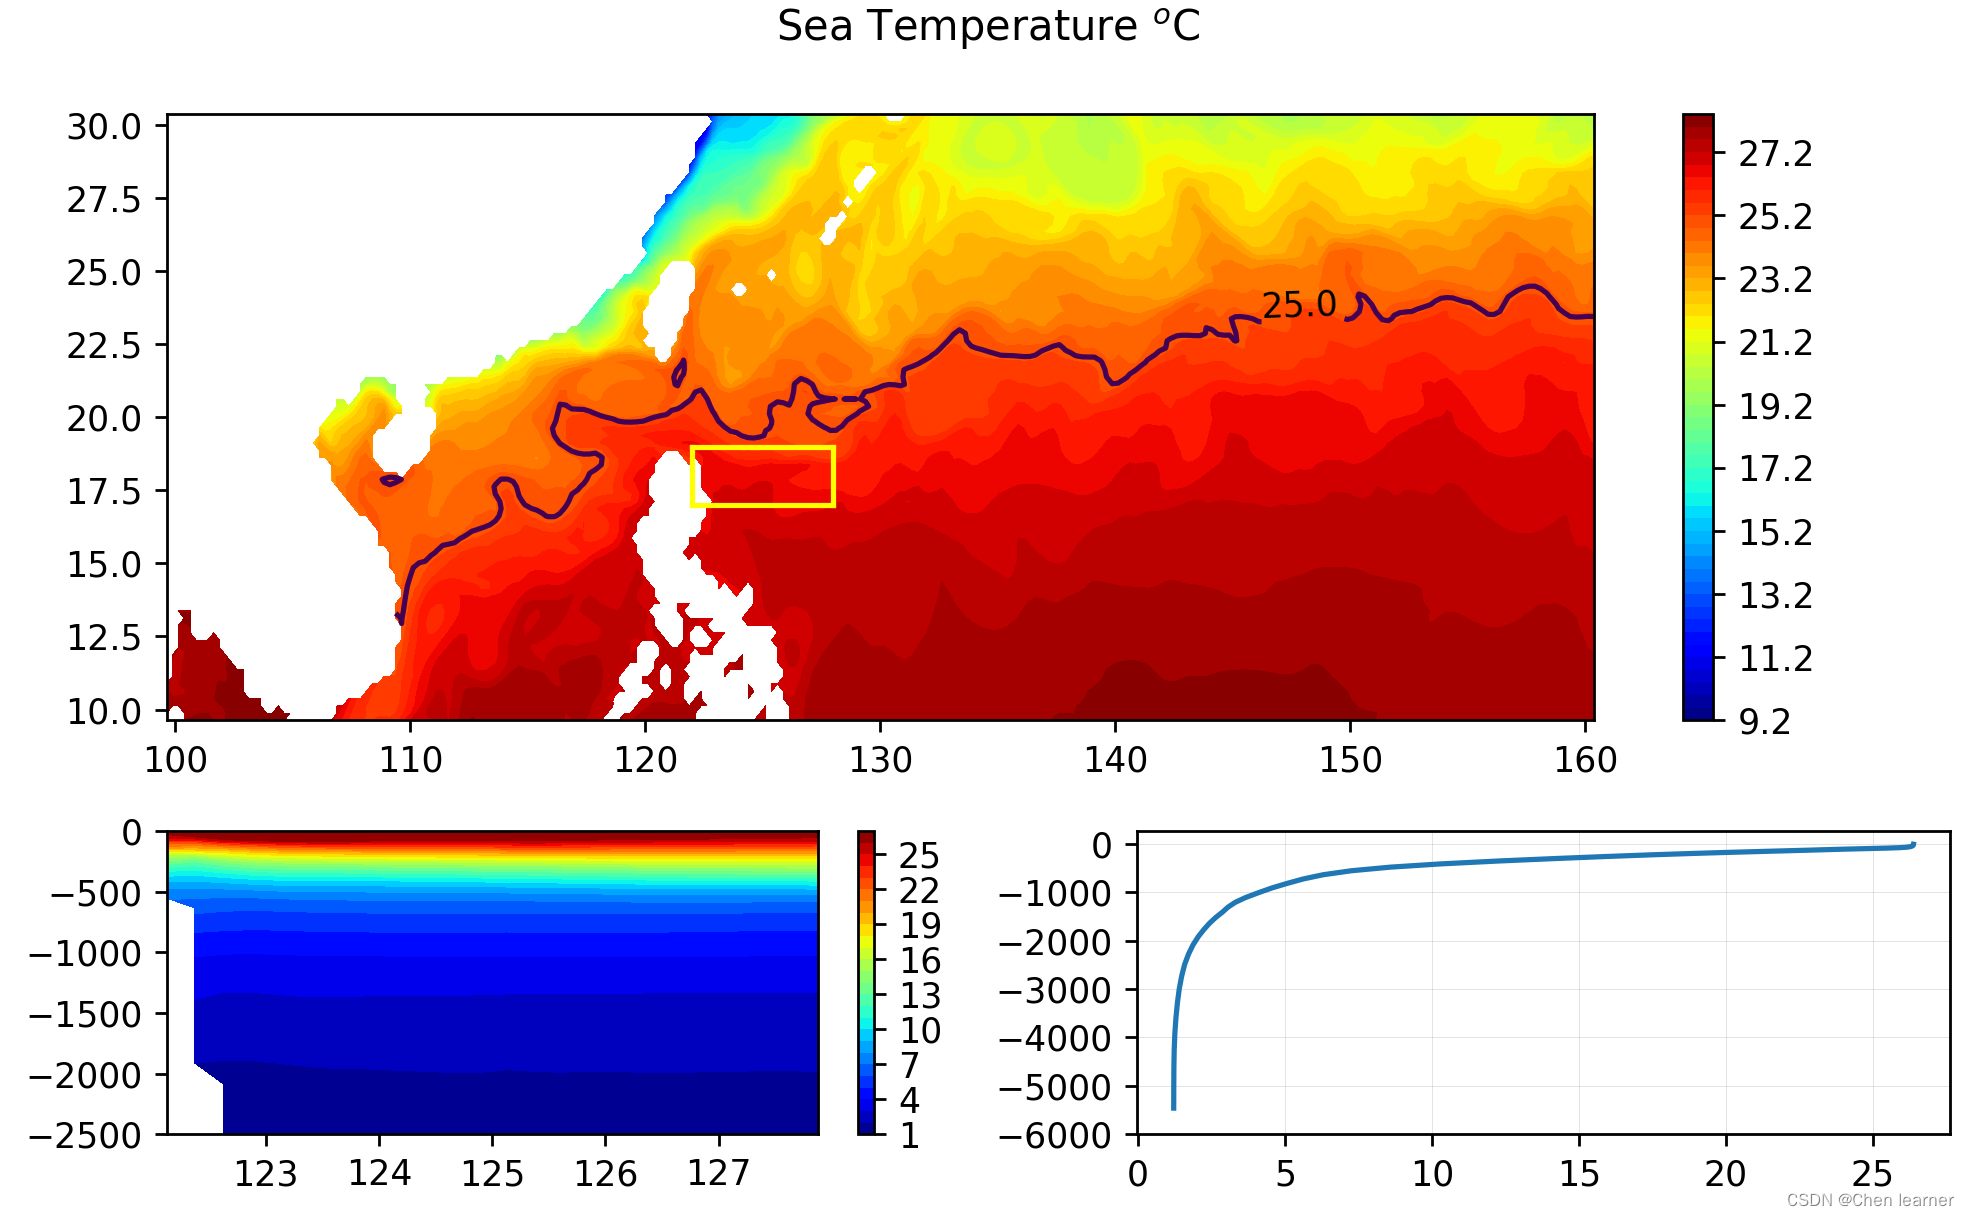
运用python导入mat格式海温数据并可视化
##%
#导入库
import scipy.io
import numpy as np
import xarray as xr
import matplotlib.pyplot as plt
from matplotlib.gridspec import GridSpec
import warnings
warnings.filterwarnings("ignore")
##%
#------------数据查看
df=scipy.io.loadmat("E:\python visualize\T.mat")#更改路径
# print(df.keys())#查看内在变量
tem,depth,lat,lon=np.array(df['T']),np.array(df['depth']).squeeze(),\
                  np.array(df['lat']).squeeze(),np.array(df['lon']).squeeze()
# print(len(depth),len(lat),len(lon))#查看数组大小
# print(tem.shape)
##%
#----------数据处理
tem_array = xr.DataArray(tem,coords={'depth': depth,'lat': lat,'lon': lon},
dims=['depth', 'lat', 'lon'])
#tem_array(depth,lat,lon)
# print(tem_array)
#----------检查异常值
if tem_array.any()>=100 or tem_array.any()<=-100:
    print('有异常值')
elif np.isnan(tem_array).any():
    print('有nan值')
##%
#-----绘图数据准备
#----1.100°E-160°E,10°N-30°N海表面温度
sst=tem_array.sel(lat=slice(9.5,30.5),lon=slice(99.5,160.5),depth=5)
# print(sst.shape)
#----2.上层2500米内温度分布的纬向平均
lat_mean_t=np.mean(tem_array.sel(lat=slice(17,19),lon=slice(122,128),depth=slice(5,2500)),axis=1)
# print(lat_mean_t.shape)
#----3.平均垂向分布
dp=tem_array.sel(lat=slice(17,19),lon=slice(122,128))
dp_mean=np.mean(dp,axis=(1,2))
# print(dp_mean)
##%
#----绘图
fig = plt.figure(figsize=(8, 5))
gs = GridSpec(2, 2, height_ratios=[2, 1])
fig.suptitle('Sea Temperature $^o$C')
# 第一个子图
ax1 = fig.add_subplot(gs[0, :])
# 可导入cartopy库添加地理信息要素
# ax1.add_feature(cfeature.COASTLINE.with_scale("110m"), linewidth=1.2, facecolor='lightgray')
contour1 = ax1.contourf(sst.lon, sst.lat, sst, 50,cmap='jet')
ax1.set_xticks(np.arange(100,161,10))
ax1.set_yticks(np.arange(10,30.1,2.5))
cont=ax1.contour(sst.lon, sst.lat, sst,levels=[25.0],c='brown')
ax1.clabel(cont, fmt="%2.1f", colors="k")
plt.colorbar(contour1, ax=ax1, orientation='vertical')
# 黄色方框
ax1.plot([122, 128], [19, 19], color='yellow')
ax1.plot([122, 128], [17, 17], color='yellow')
ax1.plot([122, 122], [17, 19], color='yellow')
ax1.plot([128, 128], [17, 19], color='yellow')
# 第二个子图
ax2 = fig.add_subplot(gs[1, 0])
contour2 = ax2.contourf(lat_mean_t.lon, -lat_mean_t.depth, lat_mean_t, 25,cmap='jet')
ax2.set_yticks(np.arange(0,-2501,-500))
plt.colorbar(contour2, ax=ax2, orientation='vertical')
# 第三个子图
ax3 = fig.add_subplot(gs[1, 1])
ax3.plot(np.array(dp_mean),-dp_mean.depth)
ax3.set_yticks(np.arange(0,-6001,-1000))#设置y轴
ax3.grid(alpha=0.5,lw=0.2)
plt.tight_layout()#调整布局
plt.show()
结果如下:
