摘要
本文主要根据对Airbnb 新用户的民宿预定结果进行预测,完整的陈述了从数据探索到特征工程到构建模型的整个过程。
其中:
1 数据探索部分主要基于pandas库,利用常见的:head(),value_counts(),describe(),isnull(),unique()等函数以及通过matplotlib作图对数据进行理解和探索;
2. 特征工程部分主要是通过从日期中提取年月日,季节,weekday,对年龄进行分段,计算相关特征之间的差值,根据用户id进行分组,从而统计一些特征变量的次数,平均值,标准差等等,以及通过one hot encoding和labels encoding对数据进行编码来提取特征;
3. 构建模型部分主要基于sklearn包,xgboost包,通过调用不同的模型进行预测,其中涉及到的模型有,逻辑回归模型Logistic Regression,树模型:DecisionTree,RandomForest,AdaBoost,Bagging,ExtraTree,GraBoost,SVM模型:SVM-rbf,SVM-poly,SVM-linear,xgboost,以及通过改变模型的参数和数据量大小,来观察NDCG的评分结果,从而了解不同模型,不同参数和不同数据量大小对预测结果的影响.
1. 背景
About this Dataset,In this challenge, you are given a list of users along with their demographics, web session records, and some summary statistics. You are asked to predict which country a new user’s first booking destination will be. All the users in this dataset are from the USA.
There are 12 possible outcomes of the destination country: ‘US’, ‘FR’, ‘CA’, ‘GB’, ‘ES’, ‘IT’, ‘PT’, ‘NL’,‘DE’, ‘AU’, ‘NDF’ (no destination found), and ‘other’. Please note that ‘NDF’ is different from ‘other’ because ‘other’ means there was a booking, but is to a country not included in the list, while ‘NDF’ means there wasn’t a booking.
2. 数据描述
总共包含6个csv文件
- train_users_2.csv - the training set of users (训练数据)
- test_users.csv - the test set of users (测试数据)
- id: user id (用户id)
- date_account_created(帐号注册时间): the date of account creation
- timestamp_first_active(首次活跃时间): timestamp of the first activity, note that it can be earlier than date_account_created or date_first_booking because a user can search before signing up
- date_first_booking(首次订房时间): date of first booking
- gender(性别)
- age(年龄)
- signup_method(注册方式)
- signup_flow(注册页面): the page a user came to signup up from
- language(语言): international language preference
- affiliate_channel(付费市场渠道): what kind of paid marketing
- affiliate_provider(付费市场渠道名称): where the marketing is e.g. google, craigslist, other
- first_affiliate_tracked(注册前第一个接触的市场渠道): whats the first marketing the user interacted with before the signing up
- signup_app(注册app)
- first_device_type(设备类型)
- first_browser(浏览器类型)
- country_destination(订房国家-需要预测的量): this is the target variable you are to predict
- sessions.csv - web sessions log for users(网页浏览数据)
- user_id(用户id): to be joined with the column ‘id’ in users table
- action(用户行为)
- action_type(用户行为类型)
- action_detail(用户行为具体)
- device_type(设备类型)
- secs_elapsed(停留时长)
- sample_submission.csv - correct format for submitting your predictions
- 数据下载地址
Airbnb 新用户的民宿预定预测-数据集
3. 数据探索
- 基于jupyter notebook 和 python3
3.1 train_users_2和test_users文件
读取文件
train = pd.read_csv("train_users_2.csv")
test = pd.read_csv("test_users.csv")
导包
import numpy as np
import pandas as pd
import matplotlib.pyplot as plt
import sklearn as sk
%matplotlib inline
import datetime
import os
import seaborn as sns#数据可视化
from datetime import date
from sklearn.preprocessing import LabelEncoder
from sklearn.preprocessing import StandardScaler
from sklearn.preprocessing import LabelBinarizer
import pickle #用于存储模型
import seaborn as sns
from sklearn.metrics import *
from sklearn.model_selection import *
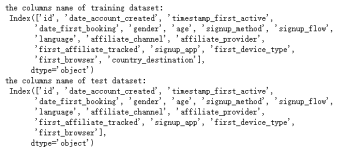
查看数据包含的特征
print('the columns name of training dataset:\n',train.columns)
print('the columns name of test dataset:\n',test.columns)
分析:
- train文件比test文件多了特征-country_destination
- country_destination是需要预测的目标变量
- 数据探索时着重分析train文件,test文件类似
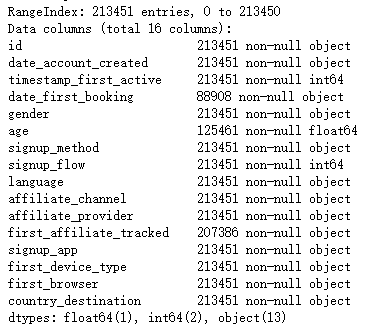
查看数据信息
print(train.info())
分析:
- trian文件包含213451行数据,16个特征
- 每个特征的数据类型和非空数值
- date_first_booking空值较多,在特征提取时可以考虑删除
特征分析:
1. date_account_created
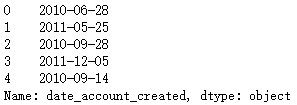
1.1 查看date_account_created前几行数据
print(train.date_account_created.head())
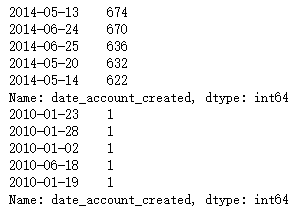
1.2 对date_account_created数据进行统计
print(train.date_account_created.value_counts().head())
print(train.date_account_created.value_counts().tail())
1.3获取date_account_created信息
print(train.date_account_created.describe())
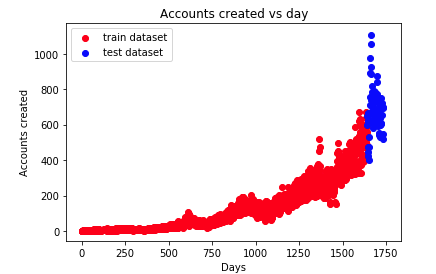
1.4观察用户增长情况
dac_train = train.date_account_created.value_counts()
dac_test = test.date_account_created.value_counts()
#将数据类型转换为datatime类型
dac_train_date = pd.to_datetime(train.date_account_created.value_counts().index)
dac_test_date = pd.to_datetime(test.date_account_created.value_counts().index)
#计算离首次注册时间相差的天数
dac_train_day = dac_train_date - dac_train_date.min()
dac_test_day = dac_test_date - dac_train_date.min()
#motplotlib作图
plt.scatter(dac_train_day.days, dac_train.values, color = 'r', label = 'train dataset')
plt.scatter(dac_test_day.days, dac_test.values, color = 'b', label = 'test dataset')

plt.title("Accounts created vs day")
plt.xlabel("Days")
plt.ylabel("Accounts created")
plt.legend(loc = 'upper left')
分析:
- x轴:离首次注册时间相差的天数
- y轴:当天注册的用户数量
- 随着时间的增长,用户注册的数量在急剧上升
2. timestamp_first_active
2.1查看头几行数据
print(train.timestamp_first_active.head())
2.2对数据进行统计看非重复值的数量
print(train.timestamp_first_active.value_counts().unique())
[1]
分析: 结果[1]表明timestamp_first_active没有重复数据
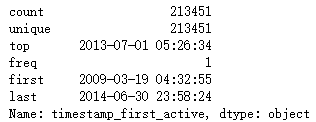
2.3将时间戳转成日期形式并获取数据信息
tfa_train_dt = train.timestamp_first_active.astype(str).apply(lambda x:
                                                                    datetime.datetime(int(x[:4]),
                                                                                      int(x[4:6]),
                                                                                      int(x[6:8]),
                                                                                      int(x[8:10]),
                                                                                      int(x[10:12]),
                                                                                      int(x[12:])))
print(tfa_train_dt.describe())
3. date_first_booking
获取数据信息
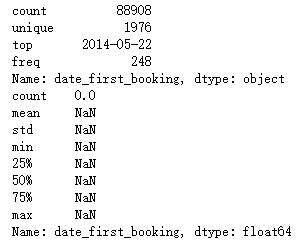
print(train.date_first_booking.describe())
print(test.date_first_booking.describe())
分析:
- train文件中date_first_booking有大量缺失值
- test文件中date_first_booking全是缺失值
- 可以删除特征date_first_booking
4.age
4.1对数据进行统计
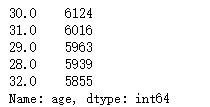
print(train.age.value_counts().head())
分析:用户年龄主要集中在30左右
4.2柱状图统计
#首先将年龄进行分成4组missing values, too small age, reasonable age, too large age
age_train =[train[train.age.isnull()].age.shape[0],
            train.query('age < 15').age.shape[0],
            train.query("age >= 15 & age <= 90").age.shape[0],
            train.query('age > 90').age.shape[0]]

age_test = [test[test.age.isnull()].age.shape[0],
            test.query('age < 15').age.shape[0],
            test.query("age >= 15 & age &l
