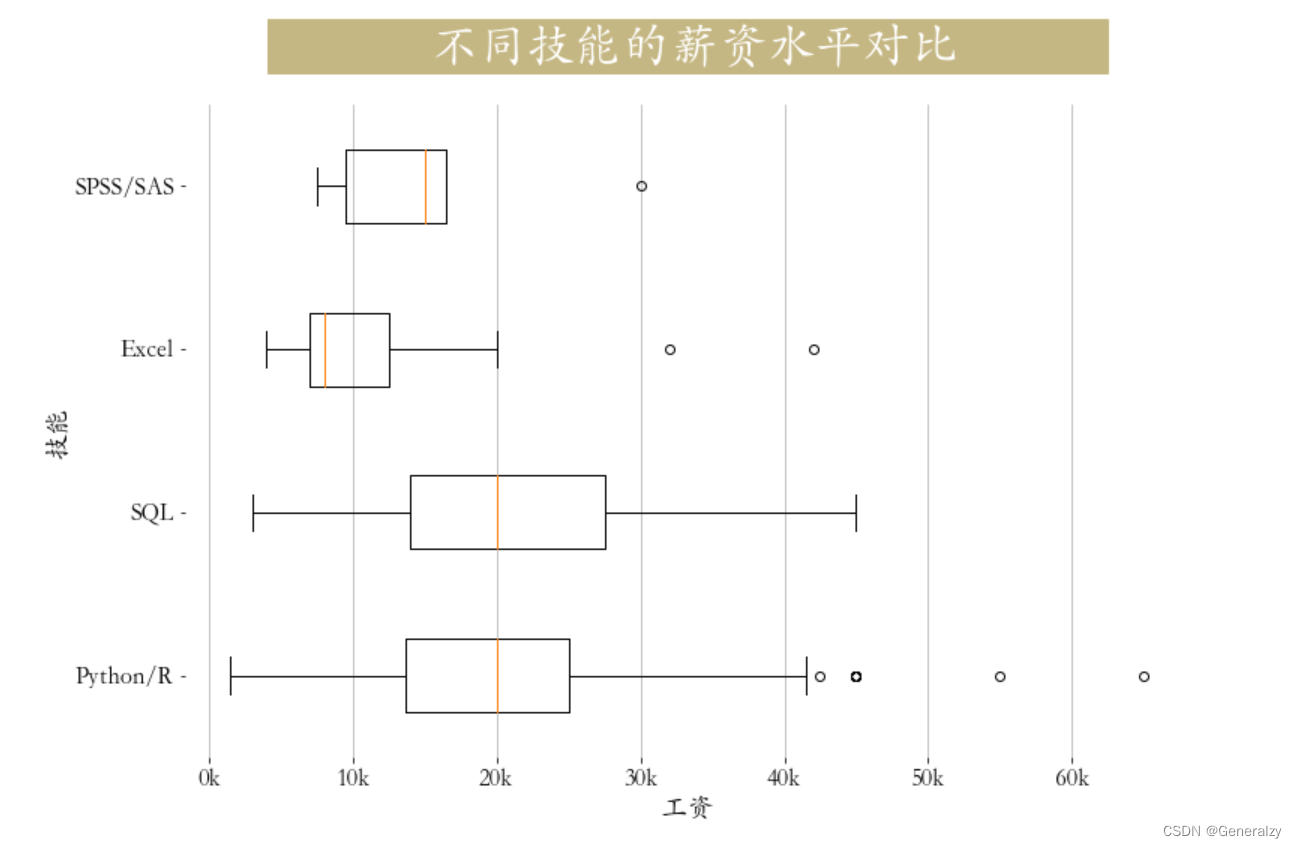
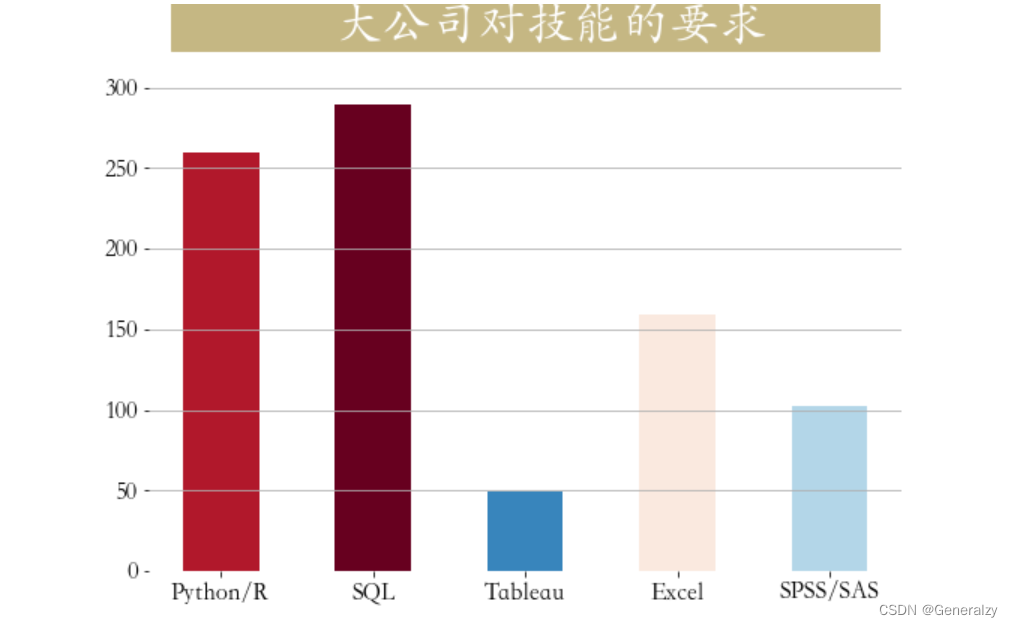
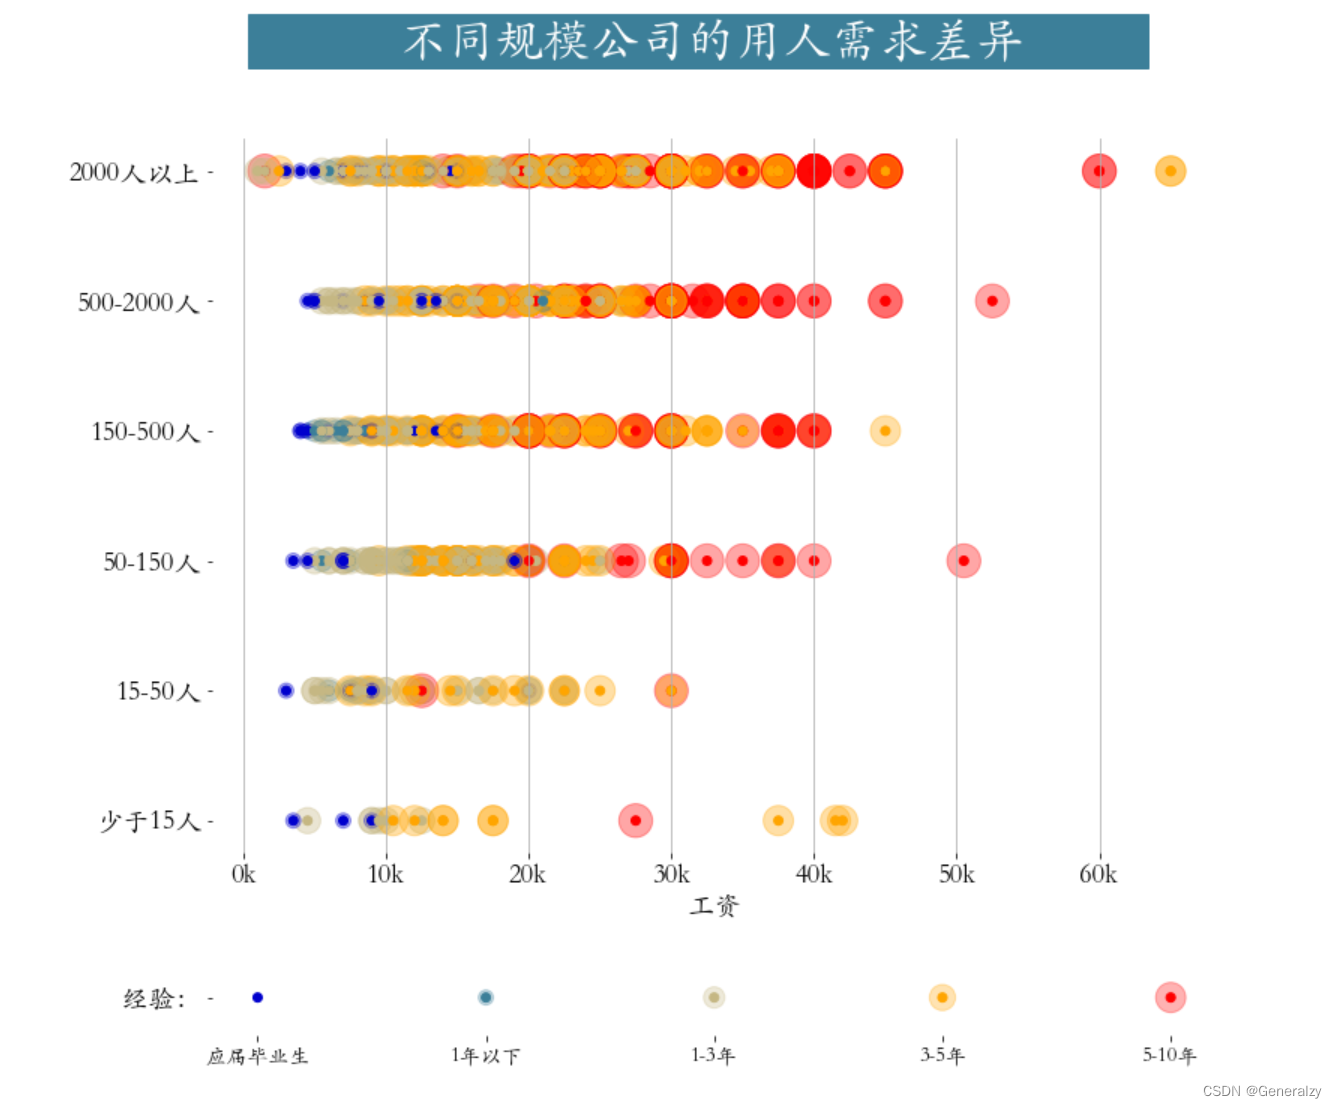
我们首先要对人工智能领域有个宽泛的了解,有自己的全局性的认识,产生一些判断,才不会人云亦云地因为“薪资高、压力大”等去做出选择或者放弃。再者你做的准备调研越多,确认方向后越不容易放弃(等门槛效应)。当然,最重要还是慢慢培养兴趣,这个事情如果没有兴趣不走心,能做得很好吗?
目录
概览
人工智能(Artificial Intelligence,AI)之研究目的是通过探索智慧的实质,扩展人类智能——促使智能主体会听(语音识别、机器翻译等)、会看(图像识别、文字识别等)、会说(语音合成、人机对话等)、会思考(人机对弈、专家系统等)、会学习(知识表示,机器学习等)、会行动(机器人、自动驾驶汽车等)。
一个经典的AI定义是:“ 智能主体可以理解数据及从中学习,并利用知识实现特定目标和任务的能力。”
从技术层面来看,现在所说的人工智能技术基本上就是机器学习方面的(也就是,机器学习技术是入门AI的核心技术)。
机器学习是指非显式的计算机程序可以从数据中学习,以此提高处理任务的水平。
机器学习常见的任务有分类任务(如通过逻辑回归模型判断邮件是否为垃圾邮件类)、回归预测任务(线性回归模型预测房价)等等。
深度学习是机器学习的一个子方向,是当下的热门,它通过搭建深层的神经网络模型以处理任务。
从应用领域上看,人工智能在众多的应用领域上面都有一定的发展,有语言识别、自然语言处理、图像识别、数据挖掘、推荐系统、智能风控、机器人等方面。值得注意的的是,不同应用领域上,从技术层面是比较一致,但结合到实际应用场景,所需要的业务知识、算法、工程上面的要求,差别还是相当大的。
基础知识、工具准备
学习人工智能需要先掌握编程、数学方面的基本知识:AI算法工程师首先是一名程序员,掌握编程实现方法才不将容易论知识束之高阁。而数学是人工智能理论的奠基,是必不可少的。
在人工智能领域,Python使用是比较广泛的,理由如下:
1、因为其简单的语法及灵活的使用方法,Python很适合零基础入门;
2、Python有丰富的机器学习库,极大方便机器学习的开发;
3、Python在机器学习领域有较高的使用率,意味着社区庞大,应用范围广,市场上有较多的工作机会;
数学方面:数学无疑是重要的,有良好的数学基础对于算法原理的理解及进阶至关重要。但这一点对于入门的初学者反而影响没那么大,对于初学者如果数学基础比较差,有个思路是先补点“数学的最小必要知识”:如线性代数的矩阵运算;高等数学的梯度求导;概率的条件、后验概率及贝叶斯定理等等。这样可以应付大部分算法的理解。
人工智能的核心——机器学习
外部学习链接(学习路线图)
-
泳鱼的github仓库:https://github.com/aialgorithm
-
唐宇迪的github仓库:https://github.com/tangyudi/Ai-Learn/tree/master
以上是我在网上找到一些“免费”的学习资料与路线,无论这些大佬们是热诚开源也好还是夹带私货也罢,都给小白或初学者洒下了入门AI的一丝希冀。
于我而言,任何可以武装思想,提高能力,开拓视野的东西,都可尝试一番。
NumPy科学计算库
NumPy(Numerical Python)是Python的一种开源的数值计算扩展。提供多维数组对象,各种派生对象(如掩码数组和矩阵),这种工具可用来存储和处理大型矩阵,比Python自身的嵌套列表(nested list structure)结构要高效的多(该结构也可以用来表示矩阵(matrix)),支持大量的维度数组与矩阵运算,此外也针对数组运算提供大量的数学函数库,包括数学、逻辑、形状操作、排序、选择、输入输出、离散傅立叶变换、基本线性代数,基本统计运算和随机模拟等等。
-
几乎所有从事Python工作的数据分析师都利用NumPy的强大功能。
- 强大的N维数组
- 成熟的广播功能
- 用于整合C/C++和Fortran代码的工具包
- NumPy提供了全面的数学功能、随机数生成器和线性代数功能
-
安装Python库
- pip install jupyter -i https://pypi.tuna.tsinghua.edu.cn/simple
- pip install numpy -i https://pypi.tuna.tsinghua.edu.cn/simple
基本操作
数组创建
创建数组的最简单的方法就是使用array函数,将Python下的list转换为ndarray。
import numpy as np
l = [1,3,5,7,9] # 列表
arr = np.array(l) # 将列表转换为NumPy数组
arr # 数据一样,NumPy数组的方法,功能更加强大
# 输出为
# array([1, 3, 5, 7, 9])
可以利用np中的一些内置函数来创建数组,比如创建全0的数组,也可以创建全1数组,全是其他数字的数组,或者等差数列数组,正态分布数组,随机数。
import numpy as np

arr1 = np.ones(10)  # 输出为:array([1., 1., 1., 1., 1., 1., 1., 1., 1., 1.])
arr2 = np.zeros(10)  # 输出为: array([0., 0., 0., 0., 0., 0., 0., 0., 0., 0.])
arr3 = np.full(shape=[2, 3], fill_value=2.718)
# 输出为:
# array([[2.718, 2.718, 2.718],
#       [2.718, 2.718, 2.718]])

arr4 = np.arange(start=0, stop=20, step=2)
# 等差数列 输出为:array([ 0,  2,  4,  6,  8, 10, 12, 14, 16, 18])

arr5 = np.linspace(start=0, stop=9, num=10)
# 等差数列 输出为:array([0., 1., 2., 3., 4., 5., 6., 7., 8., 9.])

arr6 = np.random.randint(0, 100, size=10)
# int随机数 输出为:array([ 4,  8, 79, 62, 34, 35,  2, 65, 47, 18])

arr7 = np.random.randn(5)
# 正态分布 输出为:array([ 0.57807872,  0.37922855,  2.37936837, -0.28688769,  0.2882854 ])

arr8 = np.random.random(size=5)
# float 随机数 输出为:array([0.59646412, 0.37960586, 0.38077327, 0.76983539, 0.22689201])
查看数组属性
数组的轴数、维度
import numpy as np
# 四行五列高度为3的三维数组
# def randint(low, high=None, size=None, dtype=None)
arr = np.random.randint(0,100,size = (3,4,5))
arr.ndim # 输出 3

[[[32 36 91 55 67]
  [91 18 75 60 56]
  [37 16 71 27 31]
  [85 77 53 28  0]]

 [[26 60 62  3  3]
  [89 25 11 81 40]
  [21 11 10 61 32]
  [79 36 62 48 46]]

 [[58 31 98 56 34]
  [84 12  8 12 47]
  [94 11 85 62 50]
  [66 67 44 47 81]]]
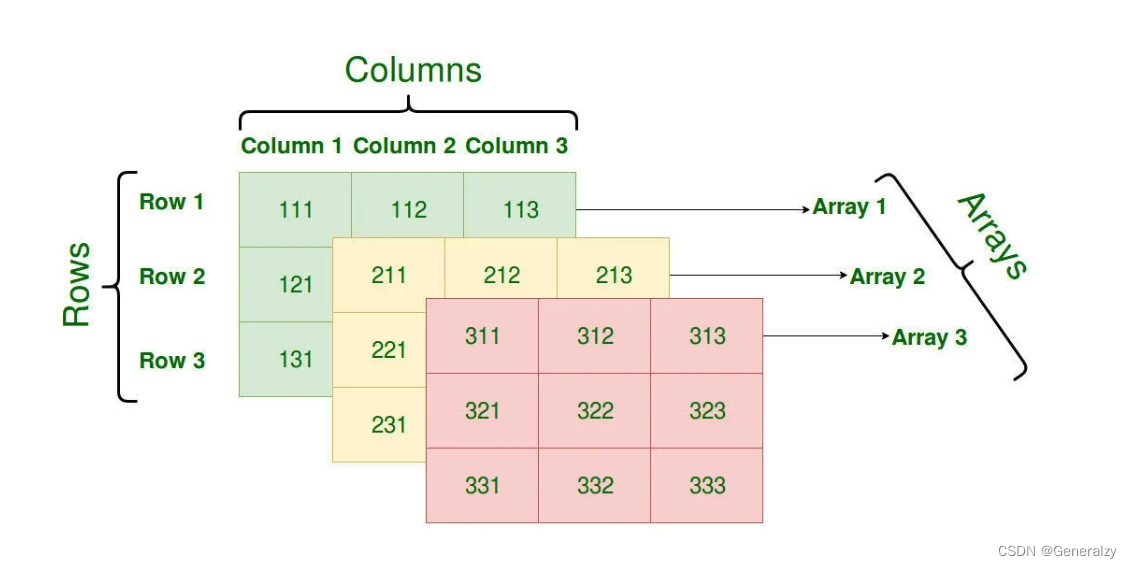
一个二维数组可以被认为是一个带有 x 行和 y 列的表格,同理一个三维数组可以看作是一个带有z个x行和y列的三维表格。 为了方便取值,z为三维数组的高,x为行,y为列,所以size为(高,行,列),对于(d)维数组n的也就是带有d个d-1维的数组。 比如size = ( 2,2,2,2)就是2个长宽高都为2的三维数组的四维数组。
数组元素的总数
import numpy as np
arr = np.random.randint(0,100,size = (3,4,5))
arr.size # 输出 3*4*5 = 60
数据类型
import numpy as np
arr = np.random.randint(0,100,size = (3,4,5))
arr.dtype # 输出 dtype('int64')
数组中每个元素的大小(以字节为单位)
import numpy as np
arr = np.random.randint(0,100,size = (3,4,5))
arr.itemsize #输出是 8 ,因为数据类型是int64,64位,一个字节是8位,所以64/8 = 8
文件IO操作
保存数组
save方法保存ndarray到一个npy文件,也可以使用savez将多个array保存到一个.npz文件中
x = np.random.randn(5)
y = np.arange(0,10,1)
#save方法可以存一个ndarray
np.save("x_arr",x)
#如果要存多个数组,要是用savez方法,保存时以key-value形式保存,key任意(xarr、yarr)
np.savez("some_array.npz",xarr = x,yarr=y)
读取
load方法来读取存储的数组,如果是.npz文件的话,读取之后相当于形成了一个key-value类型的变量,通过保存时定义的key来获取相应的array
np.load('x_arr.npy') # 直接加载

# 通过key获取保存的数组数据
np.load('some_array.npz')['yarr']
读写csv、txt文件
arr = np.random.randint(0,10,size = (3,4))
#储存数组到txt文件
np.savetxt("arr.csv",arr,delimiter=',') # 文件后缀是txt也是一样的
#读取txt文件,delimiter为分隔符,dtype为数据类型
np.loadtxt("arr.csv",delimiter=',',dtype=np.int32)
数据类型
ndarray的数据类型:
- int: int8、uint8、int16、int32、int64
- float: float16、float32、float64
- str
array创建时,指定
import numpy as np
np.array([1,2,5,8,2],dtype = 'float32')
# 输出 :array([1., 2., 5., 8., 2.], dtype=float32)
asarray转换时指定
import numpy as np
arr = [1,3,5,7,2,9,0]
# asarray 将列表进行变换
np.asarray(arr,dtype = 'float32')
# 输出:array([1., 3., 5., 7., 2., 9., 0.], dtype=float32)
数据类型转换astype
import numpy as np
arr = np.random.randint(0,10,size = 5,dtype = 'int16')
# 输出:array([6, 6, 6, 6, 3], dtype=int16)
# 使用astype进行转换
arr.astype('float32') # 输出:array([1., 4., 0., 6., 6.], dtype=float32)
数组运算
加减乘除幂运算
import numpy as np
arr1 = np.array([1,2,3,4,5])
arr2 = np.array([2,3,1,5,9])
arr1 - arr2 # 减法
arr1 * arr2 # 乘法
arr1 / arr2 # 除法
arr1**arr2 # 两个星号表示幂运算
[-1 -1  2 -1 -4]
[ 2  6  3 20 45]
[0.5        0.66666667 3.         0.8        0.55555556]
[      1       8       3    1024 1953125]
如果array时二维的就会变成m*n矩阵的计算。
逻辑运算
import numpy as np
arr1 = np.array([1,2,3,4,5])
arr2 = np.array([1,0,2,3,5])
arr1 < 5
arr1 >= 5
arr1 == 5
arr1 == arr2
arr1 > arr2
数组与标量计算
数组与标量的算术运算也会将标量值传播到各个元素。
import numpy as np
arr = np.arange(1,10)
1/arr
arr+5
arr*5
*=、+=、-=操作
import numpy as np
arr1 = np.arange(5)
arr1 +=5
arr1 -=5
arr1 *=5
# arr1 /=5 不支持运算
扩展矩阵操作
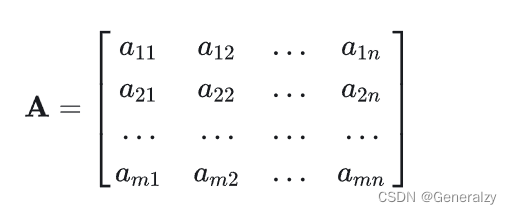
由 mn 个数排成的m行n列的数表称为m行n列的矩阵,简称 mn 矩阵。记作:
这 m*n 个数称为矩阵的元素,简称为元,数aij位于矩阵 A的第i行第j列,称为矩阵 A的 (i, j) 元。
元素是实数的矩阵称为实矩阵,元素是复数的矩阵称为复矩阵。
若多个矩阵的行数和列数相同,我们称它们为同型矩阵。
行数与列数都等于n的矩阵称为n阶矩阵或n阶方阵。若多个方阵的行数(行数=列数)相同,我们称它们为同阶矩阵。
矩阵的加减法和矩阵的数乘合称矩阵的线性运算。
加法
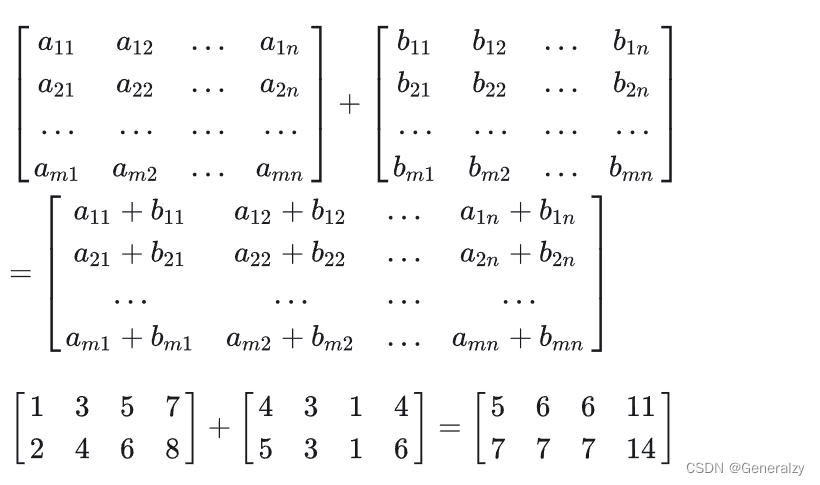
只有同型矩阵之间才可以进行加法运算,将两个矩阵相同位置的元相加即可,m行n列的两个矩阵相加后得到一个新的m行n列矩阵,例如:
交换律:
结合律:
减法
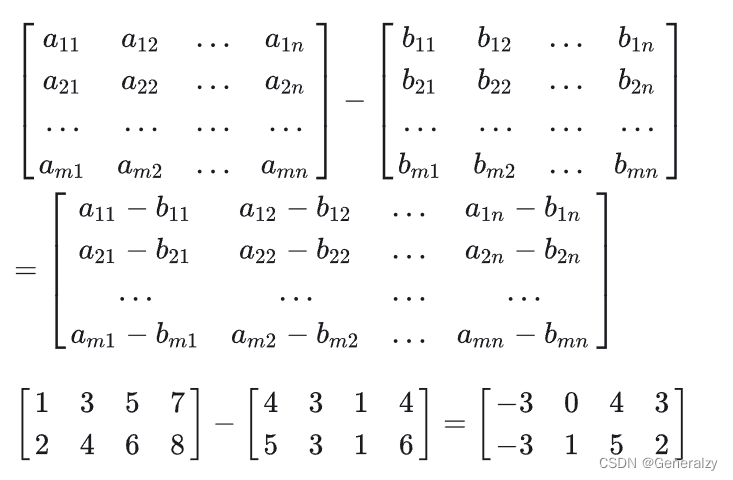
与加法类似,如下:
数乘
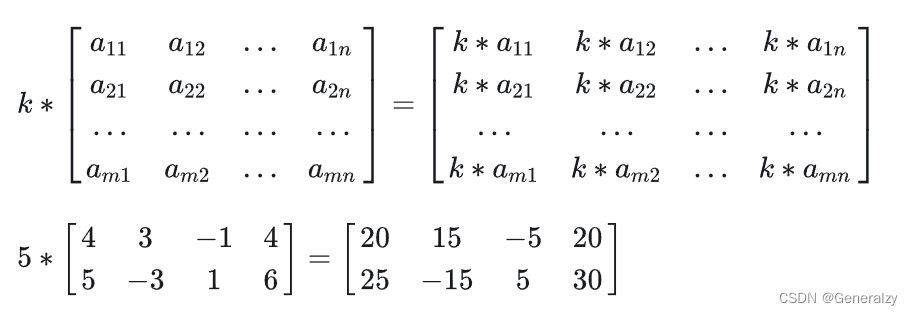
数乘即将矩阵乘以一个常量,矩阵中的每个元都与这个常量相乘,例如:
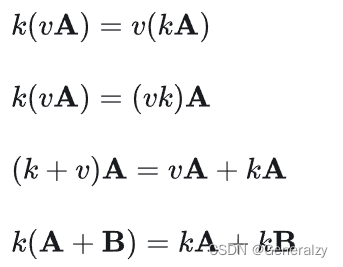
运算律:
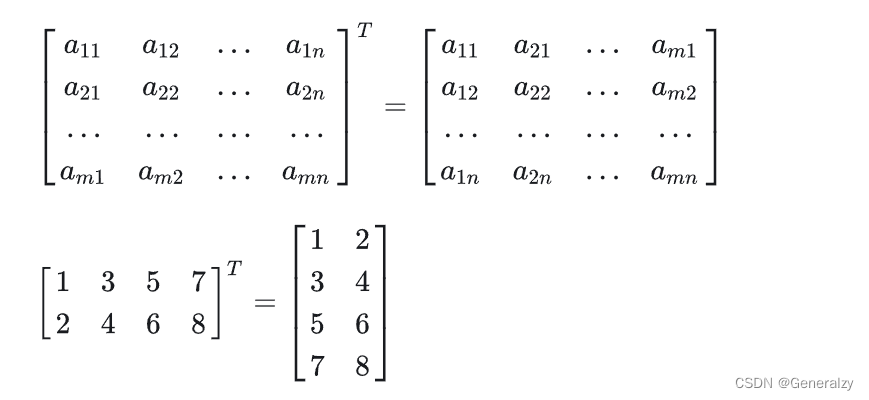
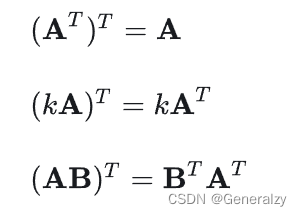
转置
把矩阵的行和列互相交换所产生的矩阵称为A的转置矩阵(标记为
),这一过程称为矩阵的转置。
运算律:
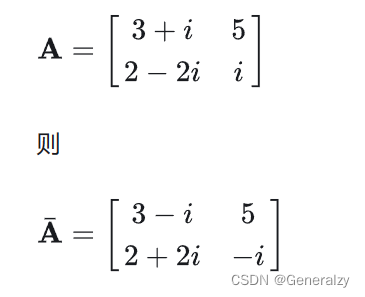
共轭
对于一个复数矩阵对其做实部不变,虚部取负的操作即为共轭操作,记作
。例如:
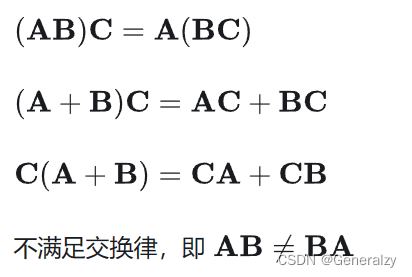
乘法
两个矩阵的乘法仅当第一个矩阵的列数和另一个矩阵的行数相等时才能定义,m×n 矩阵
和 n×p 矩阵相乘,会得到一个 m×p 矩阵 。
运算律:
… 其他内容需要涉猎高数,线性代数复习,(考试稳定85+的高数线代学渣感到了死去的知识的呼唤QAQ )
array的赋值,浅拷贝,深拷贝
赋值操作只是赋值了array对象的地址值(起了个别名):
import numpy as np
a = np.random.randint(0,100,size = (4,5))
b = a
a is b # 返回True a和b是两个不同名字对应同一个内存对象
b[0,0] = 1024 # 命运共同体
浅拷贝(新建了一个内存地址,但是引用了同一个array):
import numpy as np
a = np.random.randint(0,100,size = (4,5))
b = a.view() # 使用a中的数据创建一个新数组对象

a is b # 返回False a和b是两个不同名字对应同一个内存对象
b.base is a # 返回True,b视图的根数据和a一样
b.flags.owndata # 返回False b中的数据不是其自己的
a.flags.owndata # 返回True a中的数据是其自己的
b[0,0] = 1024 # a和b的数据都发生改变
深拷贝(完全在内存中复制一份):
import numpy as np
a = np.random.randint(0,100,size = (4,5))
b = a.copy()
b is a # 返回False
b.base is a # 返回False
b.flags.owndata # 返回True
a.flags.owndata # 返回True
b[0,0] = 1024 # b改变,a不变,分道扬镳
copy应该在不再需要原来的数组情况下,切片后调用。例如,假设a是一个巨大的中间结果,而最终结果b仅包含的一小部分a,则在b使用切片进行构造时应制作一个深拷贝:
import numpy as np
a = np.arange(1e8)
b = a[::1000000].copy() # 每100万个数据中取一个数据
del a # 不在需要a,删除占大内存的a
b.shape # shape(100,)
索引、切片和迭代
基本索引和切片
numpy中数组切片是原始数组的视图,这意味着数据不会被复制,视图上任何数据的修改都会反映到原数组上:
arr = np.array([0,1,2,3,4,5,6,7,8,9])
arr[5] #索引 输出 5
arr[5:8] #切片输出:array([5, 6, 7])
arr[2::2] # 从索引2开始每两个中取一个 输出 array([2, 4, 6, 8])
arr[::3] # 不写索引默认从0开始,每3个中取一个 输出为 array([0, 3, 6, 9])
arr[1:7:2] # 从索引1开始到索引7结束,左闭右开,每2个数中取一个 输出 array([1, 3, 5])
arr[::-1] # 倒序 输出 array([9, 8, 7, 6, 5, 4, 3, 2, 1, 0])
arr[::-2] # 倒序 每两个取一个 输出  array([9, 7, 5, 3, 1])
arr[5:8]=12 # 切片赋值会赋值到每个元素上,与列表操作不同
temp = arr[5:8]
temp[1] = 1024
arr # 输出:array([   0,    1,    2,    3,    4,   12, 1024,   12,    8,    9])
对于二维数组或者高维数组,可以按照之前的知识来索引,当然也可以传入一个以逗号隔开的索引列表来选区单个或多个元素:
arr2d = np.array([[1,3,5],[2,4,6],[-2,-7,-9],[6,6,6]]) # 二维数组 shape(3,4)
arr2d[0,-1] #索引 等于arr2d[0][-1] 输出 5
arr2d[0,2]  #索引 等于arr2d[0][2] ==  arr2d[0][-1] 输出 5

arr2d[:2,-2:] #切片 第一维和第二维都进行切片 等于arr2d[:2][:,1:]
arr2d[:2,1:] #切片 1 == -2 一个是正序,另个一是倒序,对应相同的位置
# 输出:
#array([[3, 5],
#       [4, 6]])
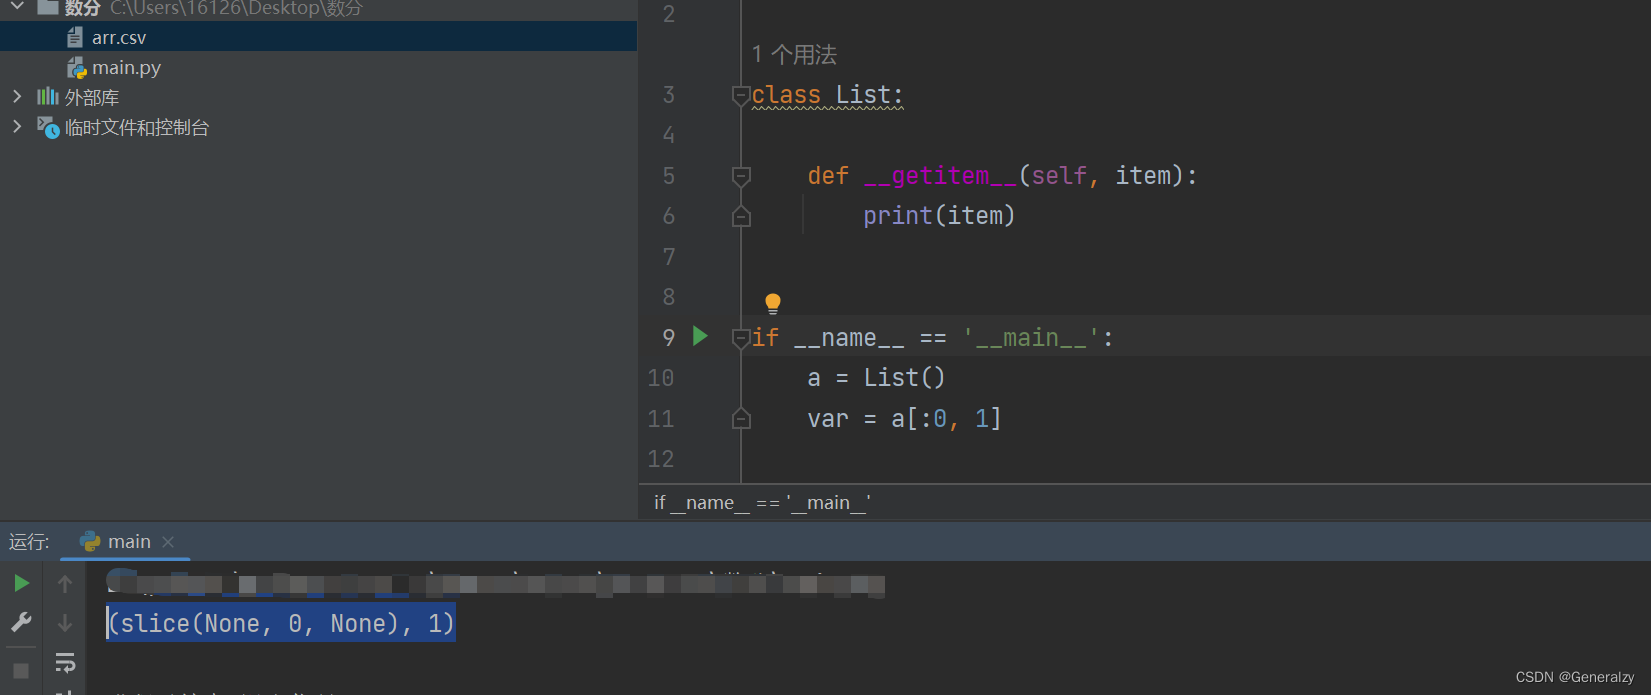
这些千奇百怪的index都是实现了getitem的行为:
花式索引
除了传统的index索引外,numpy还支持一些花式索引:
import numpy as np
#一维
arr1 = np.array([1,2,3,4,5,6,7,8,9,10])
arr2 = arr1[[1,3,3,5,7,7,7]] # 输出 array([2, 4, 4, 6, 8, 8, 8])
arr2[-1] = 1024 # 修改值,不影响arr1
#二维
arr2d = np.array([[1,3,5,7,9],[2,4,6,8,10],[12,18,22,23,37],[123,55,17,88,103]]) #shape(4,5)
arr2d[[1,3]] # 获取第二行和第四行,索引从0开始的所以1对应第二行
# 输出 array([[  2,   4,   6,   8,  10],
#            [123,  55,  17,  88, 103]])
arr2d[([1,3],[2,4])] # 相当于arr2d[1,2]获取一个元素,arr2d[3,4]获取另一个元素
# 输出为 array([  6, 103])
# 选择一个区域
arr2d[np.ix_([1,3,3,3],[2,4,4])] # 相当于 arr2d[[1,3,3,3]][:,[2,4,4]]
arr2d[[1,3,3,3]][:,[2,4,4]]
# ix_()函数可用于组合不同的向量
# 第一个列表存的是待提取元素的行标,第二个列表存的是待提取元素的列标
# 输出为
# array([[  6,  10,  10],
#        [ 17, 103, 103],
#        [ 17, 103, 103],
#        [ 17, 103, 103]])
boolean值索引:
names = np.array(['softpo','Brandon','Will','Michael','Will','Ella','Daniel','softpo','Will','Brandon'])
cond1 = names == 'Will'
cond1
# 输出array([False, False,  True, False,  True, False, False, False,  True, False])
names[cond1] # array(['Will', 'Will', 'Will'], dtype='<U7')
arr = np.random.randint(0,100,size = (10,8)) # 0~100随机数
cond2 = arr > 90
# 找到所有大于90的索引,返回boolean类型的数组 shape(10,8),大于返回True,否则False
arr[cond2] # 返回数据全部是大于90的
形状操作
数组变形
import numpy as np
arr1 = np.random.randint(0,10,size = (3,4,5))
arr2 = arr1.reshape(12,5) # 形状改变,返回新数组
arr3 = arr1.reshape(-1,5) # 自动“整形”,自动计算
数组转置
import numpy as np
arr1 = np.random.randint(0,10,size = (3,5)) # shape(3,5)
arr1.T # shape(5,3) 转置
arr2 = np.random.randint(0,10,size = (3,6,4)) # shape(3,6,4)
np.transpose(arr2,axes=(2,0,1)) # transpose改变数组维度 shape(4,3,6)
数组堆叠
import numpy as np
arr1 = np.array([[1,2,3]])
arr2 = np.array([[4,5,6]])
np.concatenate([arr1,arr2],axis = 0)
# 串联合并shape(2,3) axis = 0表示第一维串联 输出为
# array([[1, 2, 3],
#        [4, 5, 6]])
np.concatenate([arr1,arr2],axis = 1)
# shape(1,6) axis = 1表示第二维串联 输出为:array([[1, 2, 3, 4, 5, 6]])

np.hstack((arr1,arr2)) # 水平方向堆叠 输出为:array([[1, 2, 3, 4, 5, 6]])
np.vstack((arr1,arr2))
# 竖直方向堆叠,输出为:
# array([[1, 2, 3],
#        [4, 5, 6]])
split数组拆分
import numpy as np
arr = np.random.randint(0,10,size = (6,5)) # shape(6,5)
np.split(arr,indices_or_sections=2,axis = 0) # 在第一维(6)平均分成两份
np.split(arr,indices_or_sections=[2,3],axis = 1) # 在第二维(5)以索引2,3为断点分割成3份

np.vsplit(arr,indices_or_sections=3) # 在竖直方向平均分割成3份
np.hsplit(arr,indices_or_sections=[1,4]) # 在水平方向,以索引1,4为断点分割成3份
广播机制
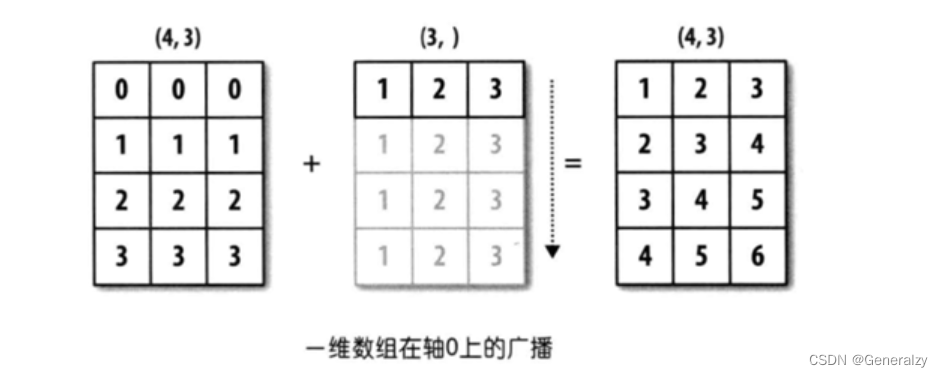
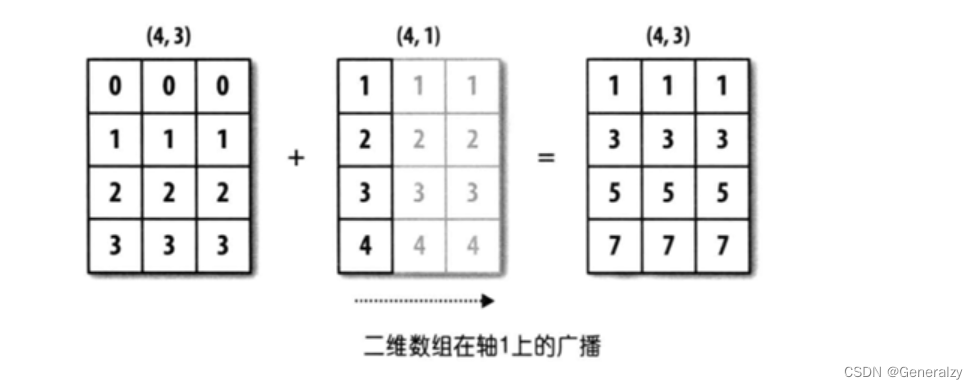
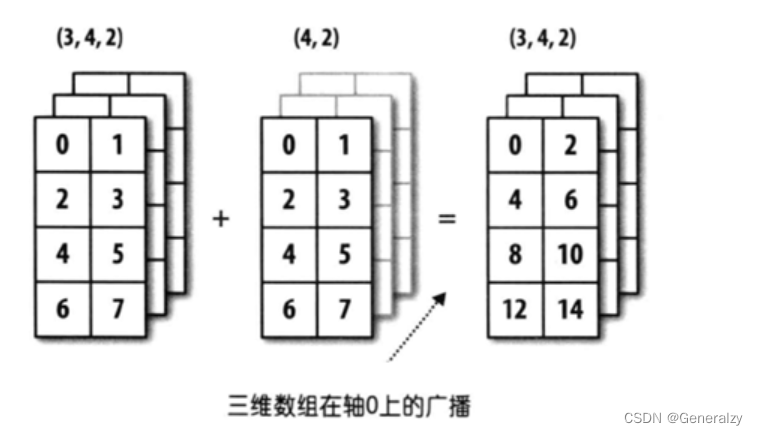
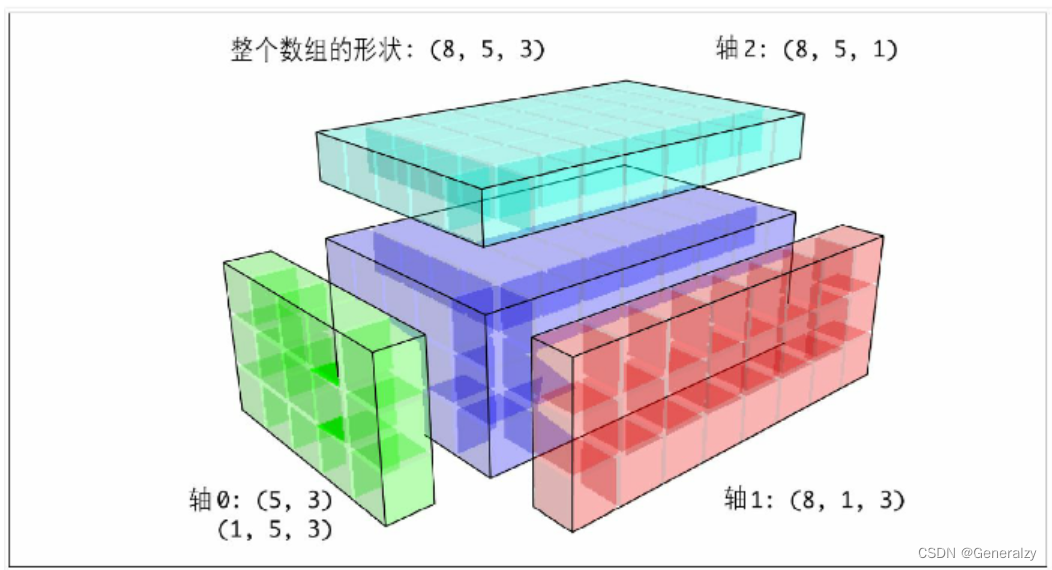
当两个数组的形状并不相同的时候,可以通过扩展数组的方法来实现相加、相减、相乘等操作,这种机制叫做广播(broadcasting)
一维数组广播
import numpy as np
arr1 = np.sort(np.array([0,1,2,3]*3)).reshape(4,3) #shape(4,3)
arr2 = np.array([1,2,3]) # shape(3,)
arr3 = arr1 + arr2 # arr2进行广播复制4份 shape(4,3)
arr3
二维数组的广播
import numpy as np
arr1 = np.sort(np.array([0,1,2,3]*3)).reshape(4,3) # shape(4,3)
arr2 = np.array([[1],[2],[3],[4]]) # shape(4,1)
arr3 = arr1 + arr2 # arr2 进行广播复制3份 shape(4,3)
arr3
三维数组广播
import numpy as np
arr1 = np.array([0,1,2,3,4,5,6,7]*3).reshape(3,4,2) #shape(3,4,2)
arr2 = np.array([0,1,2,3,4,5,6,7]).reshape(4,2) #shape(4,2)
arr3 = arr1 + arr2 # arr2数组在0维上复制3份 shape(3,4,2)
arr3
通用函数
数学函数
abs、sqrt、square、exp、log、sin、cos、tan,maxinmum、minimum、all、any、inner、clip、round、trace、ceil、floor
import numpy as np
arr1 = np.array([1,4,8,9,16,25])
np.sqrt(arr1) # 开平方
np.square(arr1) # 平方
np.clip(arr1,2,16) # 输出 array([ 2,  4,  8,  9, 16, 16])

x = np.array([1,5,2,9,3,6,8])
y = np.array([2,4,3,7,1,9,0])
np.maximum(x,y) # 返回两个数组中的比较大的值
arr2 = np.random.randint(0,10,size = (5,5))
np.inner(arr2[0],arr2) #返回一维数组向量内积
where函数
where 函数,三个参数,条件为真时选择值的数组,条件为假时选择值的数组
import numpy as np
arr1 = np.array([1,3,5,7,9])
arr2 = np.array([2,4,6,8,10])
cond = np.array([True,False,True,True,False])
np.where(cond,arr1,arr2) # True选择arr1,False选择arr2的值
# 输出 array([ 1,  4,  5,  7, 10])

arr3 = np.random.randint(0,30,size = 20)
np.where(arr3 < 15,arr3,-15) # 小于15还是自身的值,大于15设置成-15
排序方法
np中还提供了排序方法,排序方法是就地排序,即直接改变原数组
arr.sort()、np.sort()、arr.argsort()
import numpy as np
arr = np.array([9,3,11,6,17,5,4,15,1])
arr.sort() # 直接改变原数组
np.sort(arr) # 返回深拷贝排序结果
arr = np.array([9,3,11,6,17,5,4,15,1])
arr.argsort() # 返回从小到大排序索引 array([8, 1, 6, 5, 3, 0, 2, 7, 4])
集合运算函数
A = np.array([2,4,6,8])
B = np.array([3,4,5,6])
np.intersect1d(A,B) # 交集 array([4, 6])
np.union1d(A,B) # 并集 array([2, 3, 4, 5, 6, 8])
np.setdiff1d(A,B) #差集,A中有,B中没有 array([2, 8])
统计函数
min、max、mean、median、sum、std、var、cumsum、cumprod、argmin、argmax、argwhere、cov、corrcoef
import numpy as np
arr1 = np.array([1,7,2,19,23,0,88,11,6,11])
arr1.min() # 计算最小值 0
arr1.argmax() # 计算最大值的索引 返回 6
np.argwhere(arr1 > 20) # 返回大于20的元素的索引
np.cumsum(arr1) # 计算累加和
arr2 = np.random.randint(0,10,size = (4,5))
arr2.mean(axis = 0) # 计算列的平均值
arr2.mean(axis = 1) # 计算行的平均值
np.cov(arr2,rowvar=True) # 协方差矩阵
np.corrcoef(arr2,rowvar=True) # 相关性系数
线性代数
矩阵乘积
#矩阵的乘积
A = np.array([[4,2,3],
              [1,3,1]]) # shape(2,3)
B = np.array([[2,7],
              [-5,-7],
              [9,3]]) # shape(3,2)
np.dot(A,B) # 矩阵运算 A的最后一维和B的第一维必须一致
A @ B # 符号 @ 表示矩阵乘积运算
矩阵其他计算
下面可以计算矩阵的逆、行列式、特征值和特征向量、qr分解值,svd分解值
#计算矩阵的逆
from numpy.linalg import inv,det,eig,qr,svd
A = np.array([[1,2,3],
              [2,3,4],
              [4,5,8]]) # shape(3,3)
inv(t) # 逆矩阵
det(t)#计算矩阵行列式
pandas数据分析库
pandas是 Python 的核心数据分析支持库,提供了快速、灵活、明确的数据结构,旨在简单、直观地处理关系型、标记型数据。pandas是Python进行数据分析的必备高级工具。
pandas的主要数据结构是 **Series(**一维数据)与 **DataFrame **(二维数据),这两种数据结构足以处理金融、统计、社会科学、工程等领域里的大多数案例。
处理数据一般分为几个阶段:数据整理与清洗、数据分析与建模、数据可视化与制表,Pandas 是处理数据的理想工具。
pip安装即可:pip install pandas -i https://pypi.tuna.tsinghua.edu.cn/simple
数据结构
Series
pandas 的 Series 是一种一维数组,与 numpy 的数组类似,但它附加了轴标签(即索引)。Series 是 pandas 数据结构的基本构建块之一,主要用于存储和操作一维数据。每个 Series 对象包含以下两个主要部分:
- 数据(data):实际的数据,可以是各种类型(整数、浮点数、字符串等)。
- 索引(index):一组标签,标识数据中的每个元素。
可以通过多种方式创建 Series,如使用列表、字典、标量值等。
示例 1:使用列表创建 Series
import pandas as pd

data = [1, 2, 3, 4]
series = pd.Series(data)
print(series)
输出:
0    1
1    2
2    3
3    4
dtype: int64
在这个例子中,Series 的索引是自动生成的(默认从 0 开始)。
示例 2:使用字典创建 Series
data = {'a': 1, 'b': 2, 'c': 3}
series = pd.Series(data)
print(series)
输出:
a    1
b    2
c    3
dtype: int64
在这个例子中,字典的键成为 Series 的索引。
示例 3:使用标量值创建 Series
series = pd.Series(5, index=['a', 'b', 'c'])
print(series)
输出:
a    5
b    5
c    5
dtype: int64
在这个例子中,每个索引对应的值都是 5。
Series 的属性和方法
Series 提供了许多有用的属性和方法来处理和操作数据。
1. index 和 values
series = pd.Series([1, 2, 3, 4], index=['a', 'b', 'c', 'd'])
print(series.index)
print(series.values)
输出:
Index(['a', 'b', 'c', 'd'], dtype='object')
[1 2 3 4]
2. 数据选择和过滤
可以像操作列表或字典一样操作 Series。
# 按标签选择
print(series['a'])

# 按位置选择
print(series[0])

# 布尔索引
print(series[series > 2])
输出:
1
1
c    3
d    4
dtype: int64
3. 常见操作
# 数学运算
print(series + 2)

# 使用函数
print(series.apply(lambda x: x ** 2))
输出:
a    3
b    4
c    5
d    6
dtype: int64
a     1
b     4
c     9
d    16
dtype: int64
pandas 的 Series 是一种强大的数据结构,提供了灵活性和便利性来处理一维数据。它的索引功能使得数据操作更加直观和高效,特别是在数据分析和处理任务中。
用列表生成 Series时,Pandas 默认自动生成整数索引,也可以指定索引。
l = [0,1,7,9,np.NAN,None,1024,512]
# 无论是numpy中的NAN还是Python中的None在pandas中都以缺失数据NaN对待
s1 = pd.Series(data = l)  # pandas自动添加索引
s2 = pd.Series(data = l,index = list('abcdefhi'),dtype='float32') # 指定行索引
# 传入字典创建,key行索引
s3 = pd.Series(data = {'a':99,'b':137,'c':149},name = 'Python_score')
display(s1,s2,s3)
DataFrame
pandas 的 DataFrame 是一种用于存储和操作二维数据的表格数据结构。它类似于电子表格或数据库中的表,由行和列组成。每列可以包含不同类型的数据(数值、字符串、布尔值等),每行和每列都有相应的标签(索引)。
DataFrame 的基本特性
- 二维结构:DataFrame 是一个二维的标记数据结构,类似于表格。
- 异构数据:每列可以包含不同类型的数据。
- 标记轴:行和列都有标签,可以使用这些标签进行数据访问和操作。
- 尺寸可变:可以随时添加或删除行和列。
可以通过多种方式创建 DataFrame,包括从字典、列表、numpy 数组、另一个 DataFrame 等。
示例 1:从字典创建 DataFrame
import pandas as pd

data = {
    'Name': ['Alice', 'Bob', 'Charlie'],
    'Age': [25, 30, 35],
    'City': ['New York', 'Los Angeles', 'Chicago']
}

df = pd.DataFrame(data)
print(df)
输出:
      Name  Age         City
0    Alice   25     New York
1      Bob   30  Los Angeles
2  Charlie   35      Chicago
示例 2:从 numpy 数组创建 DataFrame
import numpy as np

data = np.array([[1, 2, 3], [4, 5, 6], [7, 8, 9]])
df = pd.DataFrame(data, columns=['A', 'B', 'C'])
print(df)
输出:
   A  B  C
0  1  2  3
1  4  5  6
2  7  8  9
DataFrame 的属性和方法
DataFrame 提供了许多属性和方法来操作和分析数据。
1. 访问数据
- 按列访问:可以通过列名访问列数据。
print(df['Name'])
- 按行访问:可以使用
iloc或loc访问行数据。
print(df.iloc[0])  # 按位置访问
print(df.loc[0])   # 按标签访问
2. 添加和删除行、列
- 添加列:
df['Country'] = ['USA', 'USA', 'USA']
print(df)
- 删除列:
df = df.drop(columns=['Country'])
print(df)
- 添加行:
new_row = {'Name': 'David', 'Age': 40, 'City': 'San Francisco'}
df = df.append(new_row, ignore_index=True)
print(df)
- 删除行:
df = df.drop(index=3)
print(df)
3. 数据筛选和过滤
- 条件筛选:
print(df[df['Age'] > 30])
- 多条件筛选:
print(df[(df['Age'] > 30) & (df['City'] == 'Chicago')])
4. 数据统计和聚合
- 基本统计:
print(df.describe())
- 分组聚合:
grouped = df.groupby('City')
print(grouped['Age'].mean())
数据处理示例
# 示例数据
data = {
    'Name': ['Alice', 'Bob', 'Charlie', 'David'],
    'Age': [25, 30, 35, 40],
    'City': ['New York', 'Los Angeles', 'Chicago', 'San Francisco']
}

df = pd.DataFrame(data)

# 数据访问
print(df['Name'])           # 访问 Name 列
print(df.iloc[1])           # 访问第 1 行
print(df.loc[2, 'City'])    # 访问第 2 行的 City 列

# 数据添加和删除
df['Country'] = ['USA', 'USA', 'USA', 'USA']  # 添加 Country 列
print(df)
df = df.drop(columns=['Country'])             # 删除 Country 列
print(df)

# 数据筛选
print(df[df['Age'] > 30])  # 筛选 Age 大于 30 的行

# 数据分组和聚合
grouped = df.groupby('City')
print(grouped['Age'].mean())  # 计算每个 City 的平均 Age
pandas 的 DataFrame 是一种功能强大的数据结构,广泛用于数据处理和分析。它的灵活性和多功能性使得它成为数据科学和机器学习领域的重要工具。
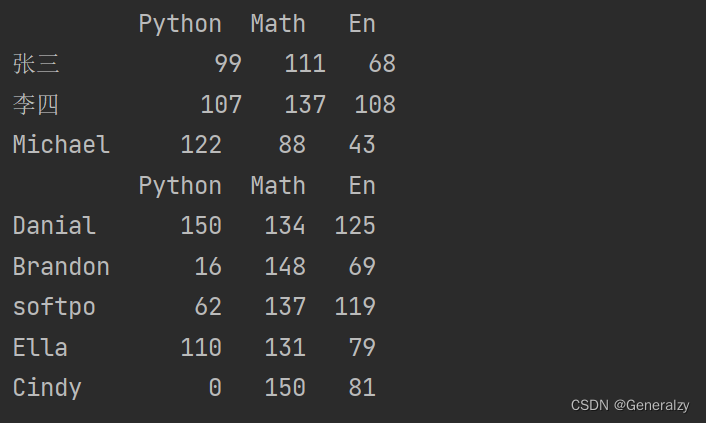
import numpy as np
import pandas as pd
# index 作为行索引,字典中的key作为列索引,创建了3*3的DataFrame表格二维数组
df1 = pd.DataFrame(data = {'Python':[99,107,122],'Math':[111,137,88],'En':[68,108,43]},# key作为列索引
                   index = ['张三','李四','Michael']) # 行索引
df2 = pd.DataFrame(data = np.random.randint(0,151,size = (5,3)),
                   index = ['Danial','Brandon','softpo','Ella','Cindy'],# 行索引
                   columns=['Python','Math','En'])# 列索引

print(df1)
print(df2)
数据查看
查看DataFrame的常用属性和DataFrame的概览和统计信息
import numpy as np
import pandas as pd
# 创建 shape(150,3)的二维标签数组结构DataFrame
df = pd.DataFrame(data = np.random.randint(0,151,size = (150,3)),
                   index = None,# 行索引默认
                   columns=['Python','Math','En'])# 列索引
# 查看其属性、概览和统计信息
df.head(10) # 显示头部10行,默认5个
df.tail(10) # 显示末尾10行,默认5个
df.shape # 查看形状,行数和列数
df.dtypes # 查看数据类型
df.index # 行索引
df.columns # 列索引
df.values # 对象值,二维ndarray数组
df.describe() # 查看数值型列的汇总统计,计数、平均值、标准差、最小值、四分位数、最大值
df.info() # 查看列索引、数据类型、非空计数和内存信息
数据输入与输出
CSV
import numpy as np
import pandas as pd
df = DataFrame(data = np.random.randint(0,50,size = [50,5]), # 薪资情况
               columns=['IT','化工','生物','教师','士兵'])
# 保存到当前路径下,文件命名是:salary.csv。csv逗号分割值文件格式
df.to_csv('./salary.csv',
          sep = ';', # 文本分隔符,默认是逗号
          header = True,# 是否保存列索引
          index = True) # 是否保存行索引,保存行索引,文件被加载时,默认行索引会作为一列
# 加载
pd.read_csv('./salary.csv',
            sep = ';',# 默认是逗号
            header = [0],#指定列索引
            index_col=0) # 指定行索引
pd.read_table('./salary.csv', # 和read_csv类似,读取限定分隔符的文本文件
            sep = ';',
            header = [0],#指定列索引
            index_col=1) # 指定行索引,IT作为行索引
Excel
import numpy as np
import pandas as pd
df1 = pd.DataFrame(data = np.random.randint(0,50,size = [50,5]), # 薪资情况
               columns=['IT','化工','生物','教师','士兵'])
df2 = pd.DataFrame(data = np.random.randint(0,50,size = [150,3]),# 计算机科目的考试成绩
                   columns=['Python','Tensorflow','Keras'])
# 保存到当前路径下,文件命名是:salary.xls
df1.to_excel('./salary.xls',
            sheet_name = 'salary',# Excel中工作表的名字
            header = True,# 是否保存列索引
            index = False) # 是否保存行索引,保存行索引
pd.read_excel('./salary.xls',
              sheet_name=0,# 读取哪一个Excel中工作表,默认第一个
              header = 0,# 使用第一行数据作为列索引
              names = list('ABCDE'),# 替换行索引
              index_col=1)# 指定行索引,B作为行索引
# 一个Excel文件中保存多个工作表
with pd.ExcelWriter('./data.xlsx') as writer:
    df1.to_excel(writer,sheet_name='salary',index = False)
    df2.to_excel(writer,sheet_name='score',index = False)
pd.read_excel('./data.xlsx',
              sheet_name='salary') # 读取Excel中指定名字的工作表
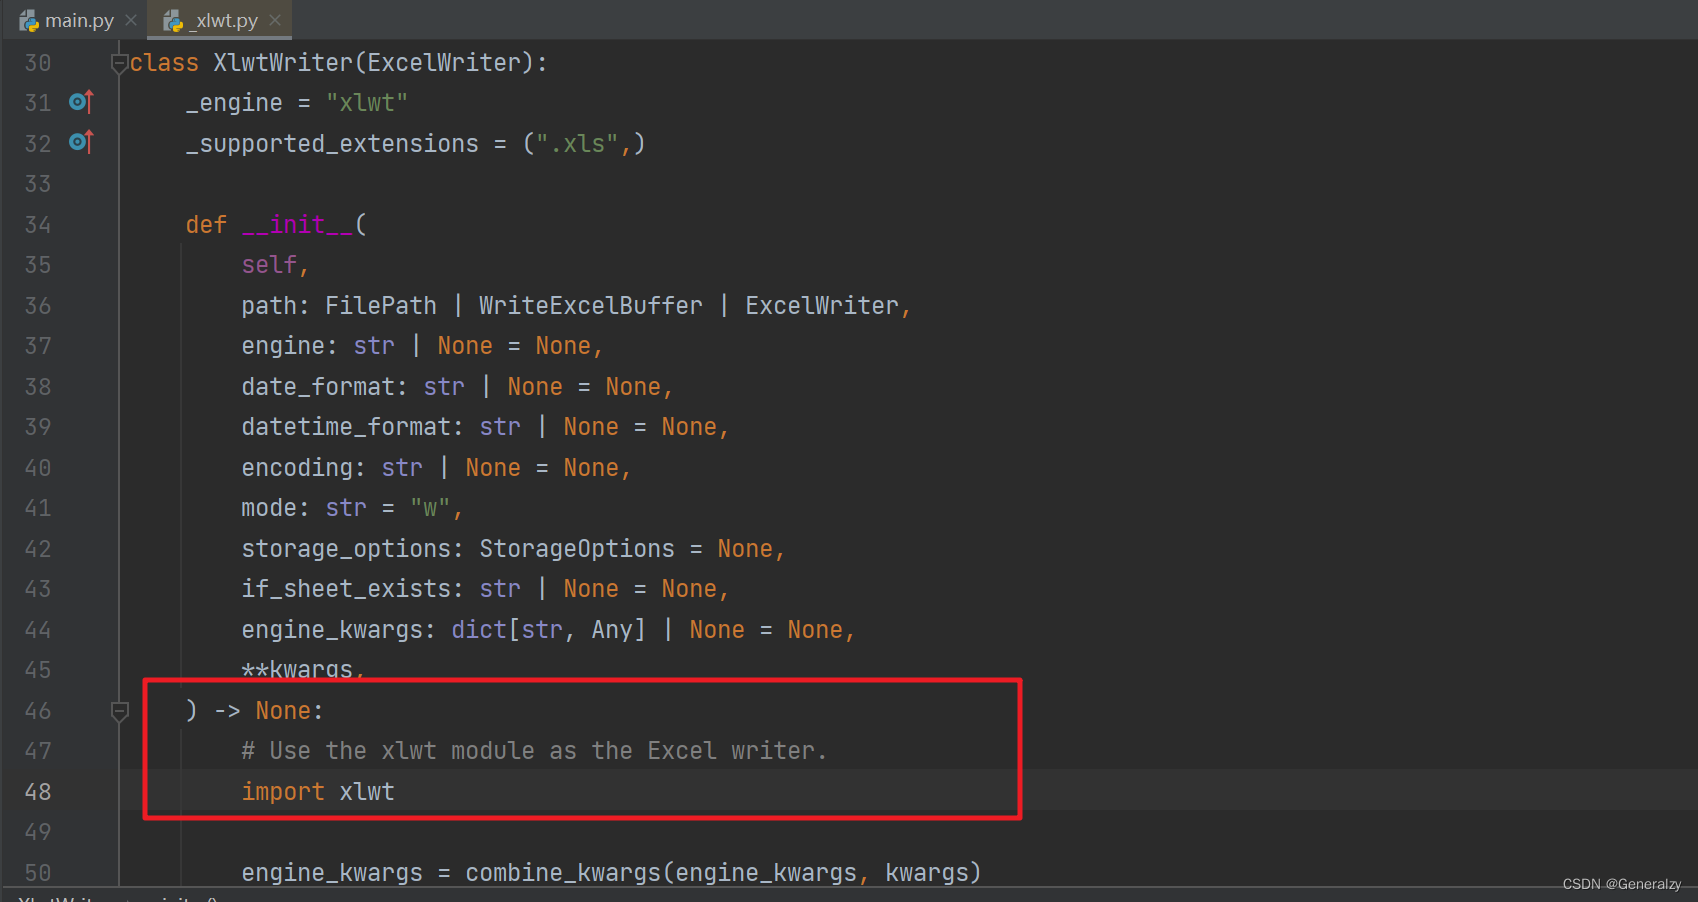
pandas对excel的读写依赖两个三方库:xlwt,xlrd,使用pip命令安装:
pip install xlrd -i https://pypi.tuna.tsinghua.edu.cn/simple

pip install xlwt -i https://pypi.tuna.tsinghua.edu.cn/simple
SQL
以mysql为例,提前安装pymysql和sqlalchemy:
pip install sqlalchemy -i https://pypi.tuna.tsinghua.edu.cn/simple

pip install pymysql -i https://pypi.tuna.tsinghua.edu.cn/simple
import pandas as pd
# SQLAlchemy是Python编程语言下的一款开源软件。提供了SQL工具包及对象关系映射(ORM)工具
from sqlalchemy import create_engine
df = pd.DataFrame(data = np.random.randint(0,50,size = [150,3]),# 计算机科目的考试成绩
                   columns=['Python','Tensorflow','Keras'])
# 数据库连接
conn = create_engine('mysql+pymysql://root:12345678@localhost/pandas?charset=UTF8MB4')
# 保存到数据库
df.to_sql('score',#数据库中表名
          conn,# 数据库连接
          if_exists='append')#如果表名存在,追加数据
# 从数据库中加载
pd.read_sql('select * from score limit 10', # sql查询语句
            conn, # 数据库连接
            index_col='Python') # 指定行索引名
HDF5
pip install tables -i https://pypi.tuna.tsinghua.edu.cn/simple
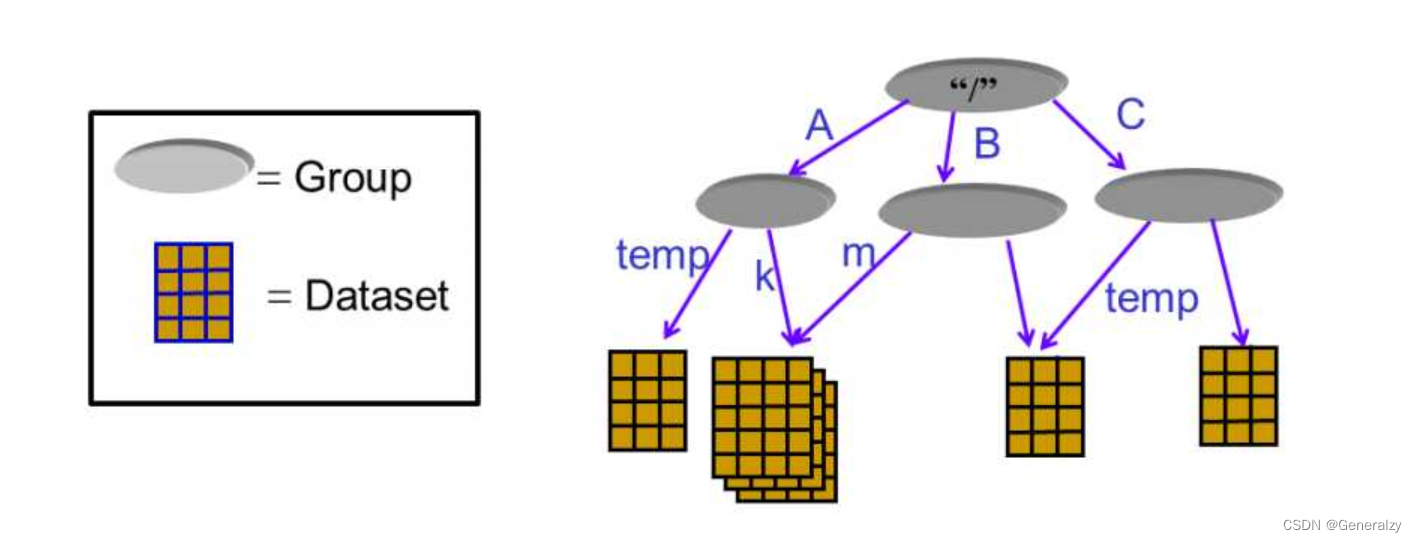
HDF5是一个独特的技术套件,可以管理非常大和复杂的数据收集。
HDF5,可以存储不同类型数据的文件格式,后缀通常是.h5,它的结构是层次性的。
一个HDF5文件可以被看作是一个组包含了各类不同的数据集。
对于HDF5文件中的数据存储,有两个核心概念:group 和 dataset:
-
dataset 代表数据集,一个文件当中可以存放不同种类的数据集,这些数据集如何管理,就用到了group
-
可以参考文件管理系统,不同的文件位于不同的目录下。目录就是HDF5中的group, 描述了数据集dataset的分类信息,通过group 有效的将多种dataset 进行管理和区分;文件就是HDF5中的dataset, 表示的是具体的数据。
import numpy as np
import pandas as pd
df1 = pd.DataFrame(data = np.random.randint(0,50,size = [50,5]), # 薪资情况
               columns=['IT','化工','生物','教师','士兵'])
df2 = pd.DataFrame(data = np.random.randint(0,50,size = [150,3]),# 计算机科目的考试成绩
                   columns=['Python','Tensorflow','Keras'])
# 保存到当前路径下,文件命名是:data.h5
df1.to_hdf('./data.h5',key='salary') # 保存数据的key,标记
df2.to_hdf('./data.h5',key = 'score')

pd.read_hdf('./data.h5',
            key = 'salary')#获取指定的标记、key的数据
数据选取
字段数据
import pandas as pd
import numpy as np
df = pd.DataFrame(data = np.random.randint(0,150,size = [150,3]),# 计算机科目的考试成绩
                   columns=['Python','Tensorflow','Keras'])
df['Python'] # 获取单列,Series
df.Python # 获取单列,Series
df[['Python','Keras']] # 获取多列,DataFrame
df[3:15] # 行切片
标签选择
import pandas as pd
import numpy as np
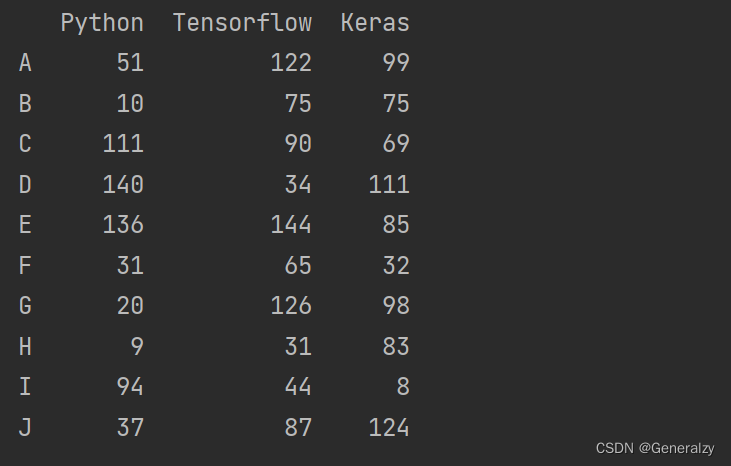
df = pd.DataFrame(data = np.random.randint(0,150,size = [10,3]),# 计算机科目的考试成绩
                  index = list('ABCDEFGHIJ'),# 行标签
                  columns=['Python','Tensorflow','Keras'])
df.loc[['A','C','D','F']] # 选取指定行标签数据。
df.loc['A':'E',['Python','Keras']] # 根据行标签切片,选取指定列标签的数据
df.loc[:,['Keras','Tensorflow']] # :默认保留所有行
df.loc['E'::2,'Python':'Tensorflow'] # 行切片从标签E开始每2个中取一个,列标签进行切片
df.loc['A','Python'] # 选取标量值
位置选择
import pandas as pd
import numpy as np
df = pd.DataFrame(data = np.random.randint(0,150,size = [10,3]),# 计算机科目的考试成绩
                  index = list('ABCDEFGHIJ'),# 行标签
                  columns=['Python','Tensorflow','Keras'])
df.iloc[4] # 用整数位置选择。
df.iloc[2:8,0:2] # 用整数切片,类似NumPy
df.iloc[[1,3,5],[0,2,1]] # 整数列表按位置切片
df.iloc[1:3,:] # 行切片
df.iloc[:,:2] # 列切片
df.iloc[0,2] # 选取标量值
boolean索引
import pandas as pd
import numpy as np
df = pd.DataFrame(data = np.random.randint(0,150,size = [10,3]),# 计算机科目的考试成绩
                  index = list('ABCDEFGHIJ'),# 行标签,用户
                  columns=['Python','Tensorflow','Keras']) # 考试科目
cond1 = df.Python > 100 #  判断Python分数是否大于100,返回值是boolean类型的Series
df[cond1] # 返回Python分数大于100分的用户所有考试科目数据
cond2 = (df.Python > 50) & (df['Keras'] > 50) # &与运算
df[cond2] # 返回Python和Keras同时大于50分的用户的所有考试科目数据
df[df > 50]# 选择DataFrame中满足条件的值,如果满足返回值,不然返回空数据NaN
df[df.index.isin(['A','C','F'])] # isin判断是否在数组中,返回也是boolean类型值
赋值操作
import pandas as pd
import numpy as np
df = pd.DataFrame(data = np.random.randint(0,150,size = [10,3]),# 计算机科目的考试成绩
                  index = list('ABCDEFGHIJ'),# 行标签,用户
                  columns=['Python','Tensorflow','Keras']) # 考试科目
s = pd.Series(data = np.random.randint(0,150,size = 9),index=list('BCDEFGHIJ'),name = 'PyTorch')
df['PyTorch'] = s # 增加一列,DataFrame行索引自动对齐
df.loc['A','Python'] = 256 # 按标签赋值
df.iloc[3,2] = 512 # 按位置赋值
df.loc[:,'Python'] = np.array([128]*10) # 按NumPy数组进行赋值
df[df >= 128] = -df # 按照where条件进行赋值,大于等于128变成原来的负数,否则不变
df
数据集成
pandas 提供了多种将 Series、DataFrame 对象组合在一起的功能
concat数据串联
import pandas as pd
import numpy as np
df1 = pd.DataFrame(data = np.random.randint(0,150,size = [10,3]),# 计算机科目的考试成绩
                  index = list('ABCDEFGHIJ'),# 行标签,用户
                  columns=['Python','Tensorflow','Keras']) # 考试科目
df2 = pd.DataFrame(data = np.random.randint(0,150,size = [10,3]),# 计算机科目的考试成绩
                  index = list('KLMNOPQRST'),# 行标签,用户
                  columns=['Python','Tensorflow','Keras']) # 考试科目
df3 = pd.DataFrame(data = np.random.randint(0,150,size = (10,2)),
                  index = list('ABCDEFGHIJ'),
                  columns=['PyTorch','Paddle'])
pd.concat([df1,df2],axis = 0) # df1和df2行串联,df2的行追加df2行后面
df1.append(df2) # 在df1后面追加df2
   Python  Tensorflow  Keras
A      13          93    118
B      57          53     37
C     132          42    125
D     128         104    126
E     109          55    134
F      27         144      4
G      50          20    127
H       6          25     24
I      71         146     99
J     149         125     59
K      85         131     25
L      27         112    133
M      14          59      7
N      40          51     10
O     143          65    126
P      21          77     97
Q      84          13    123
R     133         122     98
S     148          50     11
T     148          88     65

pd.concat([df1,df3],axis = 1) # df1和df2列串联,df2的列追加到df1列后面
   Python  Tensorflow  Keras  PyTorch  Paddle
A      13          93    118       52      49
B      57          53     37       46      85
C     132          42    125      110      79
D     128         104    126       48     117
E     109          55    134      140      68
F      27         144      4      122      63
G      50          20    127       76      48
H       6          25     24       56      96
I      71         146     99      129      54
J     149         125     59       21      56
插入
import numpy as np
import pandas as pd
df = pd.DataFrame(data = np.random.randint(0,151,size = (10,3)),
                  index = list('ABCDEFGHIJ'),
                  columns = ['Python','Keras','Tensorflow'])
df.insert(loc = 1,column='Pytorch',value=1024) # 插入列
   Python  Pytorch  Keras  Tensorflow
A      57     1024    102          76
B     120     1024     16          26
C       7     1024    131           5
D      37     1024     38          37
E     122     1024     98          23
F      20     1024    112           5
G      88     1024     69         139
H     143     1024     62         141
I      33     1024     88          50
J     140     1024    117         144
df
# 对行的操作,使用追加append,默认在最后面,无法指定位置
# 如果想要在指定位置插入行:切割-添加-合并
Join SQL风格合并
数据集的合并(merge)或连接(join)运算是通过一个或者多个键将数据链接起来的。这些运算是关系型数据库的核心操作。
pandas的merge函数是数据集进行join运算的主要切入点。
import pandas as pd
import numpy as np
# 表一中记录的是name和体重信息
df1 = pd.DataFrame(data = {'name':['softpo','Daniel','Brandon','Ella'],'weight':[70,55,75,65]})
# 表二中记录的是name和身高信息
df2 = pd.DataFrame(data = {'name':['softpo','Daniel','Brandon','Cindy'],'height':[172,170,170,166]})
df3 = pd.DataFrame(data = {'名字':['softpo','Daniel','Brandon','Cindy'],'height':[172,170,170,166]})
# 根据共同的name将俩表的数据,进行合并
pd.merge(df1,df2,
         how = 'inner',# 内合并代表两对象交集
         on = 'name')
pd.merge(df1,df3,
         how = 'outer',# 全外连接,两对象并集
         left_on = 'name',# 左边DataFrame使用列标签 name进行合并
         right_on = '名字')# 右边DataFrame使用列标签 名字进行合并
# 创建10名学生的考试成绩
df4 = pd.DataFrame(data = np.random.randint(0,151,size = (10,3)),
                   index = list('ABCDEFHIJK'),
                   columns=['Python','Keras','Tensorflow'])
# 计算每位学生各科平均分,转换成DataFrame
score_mean = pd.DataFrame(df4.mean(axis = 1).round(1),columns=['平均分'])
# 将平均分和df3使用merge进行合并,它俩有共同的行索引
pd.merge(left = df4,right = score_mean,
         left_index=True,# 左边DataFrame使用行索引进行合并
         right_index=True)# 右边的DataFrame使用行索引进行合并
数据清洗
import numpy as np
import pandas as pd
df = pd.DataFrame(data = {'color':['red','blue','red','green','blue',None,'red'],
                          'price':[10,20,10,15,20,0,np.NaN]})
# 1、重复数据过滤
df.duplicated() # 判断是否存在重复数据
df.drop_duplicates() # 删除重复数据

# 2、空数据过滤
df.isnull() # 判断是否存在空数据,存在返回True,否则返回False
df.dropna(how = 'any') # 删除空数据
df.fillna(value=1111) # 填充空数据

# 3、指定行或者列过滤
del df['color'] # 直接删除某列
df.drop(labels = ['price'],axis = 1)# 删除指定列
df.drop(labels = [0,1,5],axis = 0) # 删除指定行

# 4、函数filter使用
df = pd.DataFrame(np.array(([3,7,1], [2, 8, 256])),
                  index=['dog', 'cat'],
                  columns=['China', 'America', 'France'])
df.filter(items=['China', 'France'])
# 根据正则表达式删选列标签
df.filter(regex='a$', axis=1)
# 选择行中包含og
df.filter(like='og', axis=0)

# 5、异常值过滤
df2 = pd.DataFrame(data = np.random.randn(10000,3)) # 正态分布数据
# 3σ过滤异常值,σ即是标准差
cond = (df2 > 3*df2.std()).any(axis = 1)
index = df2[cond].index # 不满足条件的行索引
df2.drop(labels=index,axis = 0) # 根据行索引,进行数据删除
数据转换
轴和元素替换
import numpy as np
import pandas as pd
df = pd.DataFrame(data = np.random.randint(0,10,size = (10,3)),
                  index = list('ABCDEFHIJK'),
                  columns=['Python','Tensorflow','Keras'])
df.iloc[4,2] = None # 空数据
#1、重命名轴索引
df.rename(index = {'A':'AA','B':'BB'},columns = {'Python':'人工智能'})

# 2、替换值
df.replace(3,1024) #将3替换为1024
df.replace([0,7],2048) # 将0和7替换为2048
df.replace({0:512,np.nan:998}) # 根据字典键值对进行替换
df.replace({'Python':2},-1024) # 将Python这一列中等于2的,替换为-1024
map Series元素改变
import numpy as np
import pandas as pd
df = pd.DataFrame(data = np.random.randint(0,10,size = (10,3)),
                  index = list('ABCDEFHIJK'),
                  columns=['Python','Tensorflow','Keras'])
df.iloc[4,2] = None # 空数据

# 1、map批量元素改变,Series专有
df['Keras'].map({1:'Hello',5:'World',7:'AI'}) # 字典映射
df['Python'].map(lambda x:True if x >=5 else False) # 隐式函数映射
def convert(x): # 显示函数映射
    if x%3 == 0:
        return True
    elif x%3 == 1:
        return False
df['Tensorflow'].map(convert)

   Python  Tensorflow  Keras
A       3           1    6.0
B       6           0    7.0
C       5           8    6.0
D       8           0    3.0
E       0           5    NaN
F       4           0    4.0
H       0           2    0.0
I       9           3    8.0
J       9           9    6.0
K       3           6    9.0
apply元素改变(既支持 Series,也支持 DataFrame)
import numpy as np
import pandas as pd
df = pd.DataFrame(data = np.random.randint(0,10,size = (10,3)),
                  index = list('ABCDEFHIJK'),
                  columns=['Python','Tensorflow','Keras'])
df.iloc[4,2] = None # 空数据
# 1、apply 应用方法数据转换,通用
# Series,其中x是Series中元素
df['Keras'].apply(lambda x:True if x >5 else False)
# DataFrame,其中的x是DataFrame中列或者行,是Series
df.apply(lambda x : x.median(),axis = 0) # 列的中位数
def convert(x): # 自定义方法
    return (x.mean().round(1),x.count())
df.apply(convert,axis = 1) # 行平均值,计数

# 2、applymap DataFrame专有
df.applymap(lambda x : x + 100) # 计算DataFrame中每个元素
transform
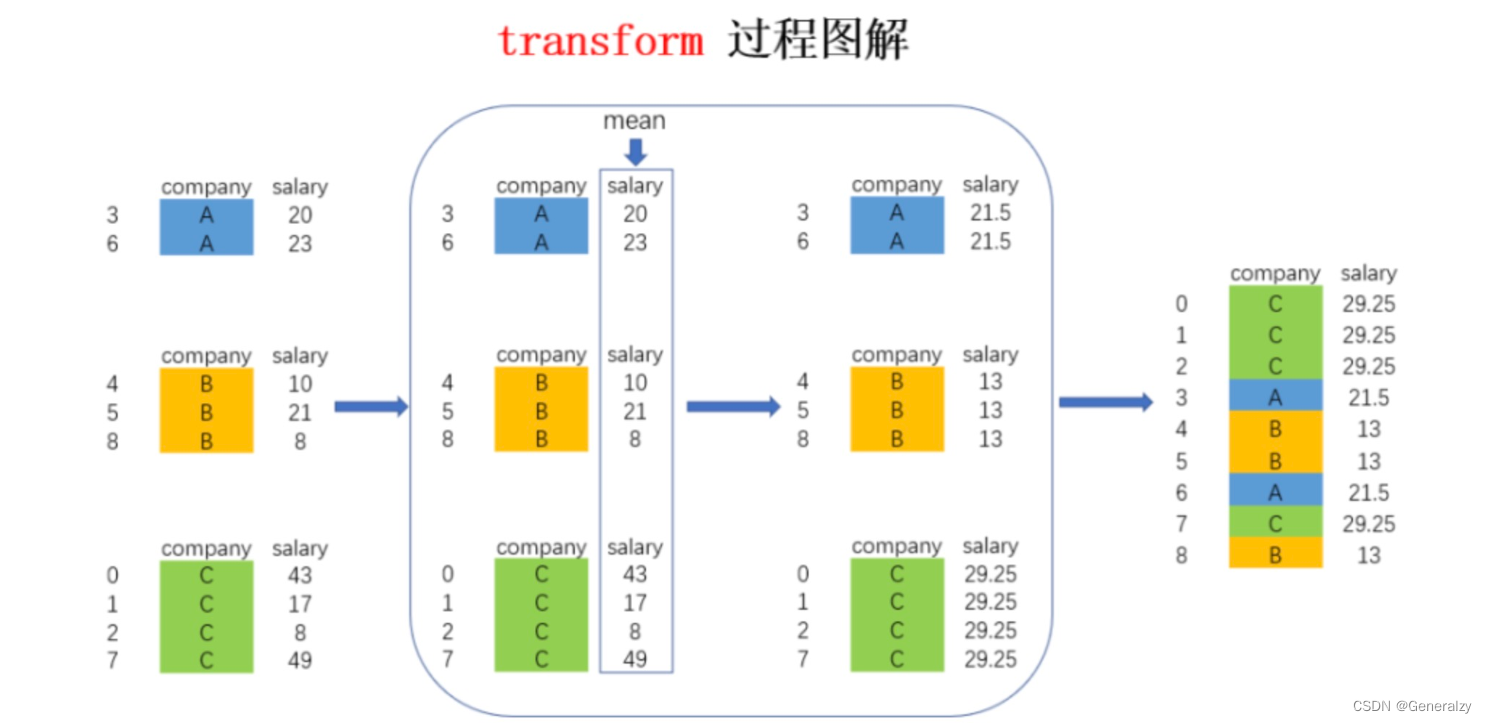
pandas 中的 transform 方法主要用于在 DataFrame 上按列(或按行)应用函数,并返回与输入索引相同大小的结果。它通常与分组操作(groupby)结合使用,以便对分组数据进行逐个元素的转换。
基本理解:
transform 方法主要用于以下情况:
- 需要对数据进行逐个元素的转换,而不是整体聚合。
- 保持与输入数据相同的索引结构。
常见用法:
示例 1:对列进行转换
假设我们有一个 DataFrame,其中包含一些数值列。我们可以使用 transform 对这些列应用函数:
import pandas as pd

# 创建一个示例 DataFrame
df = pd.DataFrame({
    'A': [1, 2, 3, 4],
    'B': [10, 20, 30, 40]
})

# 对列 A 进行平方转换
df['A_transformed'] = df['A'].transform(lambda x: x ** 2)

print(df)
输出:
   A   B  A_transformed
0  1  10              1
1  2  20              4
2  3  30              9
3  4  40             16
示例 2:与 groupby 结合使用
transform 与 groupby 结合使用时,可以对分组后的数据进行逐个元素的转换。
# 创建一个示例 DataFrame
df = pd.DataFrame({
    'A': ['foo', 'bar', 'foo', 'bar'],
    'B': [1, 2, 3, 4],
    'C': [10, 20, 30, 40]
})

# 对每个分组计算 B 列的 z-score
df['B_zscore'] = df.groupby('A')['B'].transform(lambda x: (x - x.mean()) / x.std())

print(df)
输出:
     A  B   C   B_zscore
0  foo  1  10 -1.0
1  bar  2  20 -1.0
2  foo  3  30  1.0
3  bar  4  40  1.0
在这个例子中,transform 方法对每个分组计算 z-score,并返回一个与原始 DataFrame 相同大小的 Series。
注意事项:
transform返回的结果必须与原始数据的索引大小一致。transform适用于逐个元素的转换,如果需要整体聚合(如求和、平均值等),可以使用aggregate或apply方法。
总结来说,pandas 的 transform 方法在需要对数据逐个元素进行转换并保持原始数据结构时非常有用,尤其是在分组操作后对每个分组数据进行逐个元素处理时。
import numpy as np
import pandas as pd
df = pd.DataFrame(data = np.random.randint(0,10,size = (10,3)),
                  index = list('ABCDEFHIJK'),
                  columns=['Python','Tensorflow','Keras'])
df.iloc[4,2] = None # 空数据

# 1、一列执行多项计算
df['Python'].transform([np.sqrt,np.exp]) # Series处理
def convert(x):
	// 求平均值
    if x.mean() > 5:
        x *= 10
    else:
        x *= -10
    return x
# 2、多列执行不同计算
df.transform({'Python':convert,'Tensorflow':np.max,'Keras':np.min}) # DataFrame处理
重排随机抽样哑变量(独热编码)
独热编码(One-Hot Encoding)是一种将分类变量转换为一组二进制(0 和 1)变量的编码方法。这种编码方法创建了一个新的二进制列,对于每个可能的分类值都分配一个列,且每一行中只有一个列会被赋值为 1,其余列为 0。它广泛应用于机器学习和数据处理,以便算法能够处理非数值型数据。
许多机器学习算法和统计模型不能直接处理分类数据,因此需要将这些数据转换为数值形式。直接将分类数据映射为整数可能会导致模型误解数据中的隐含顺序关系,而独热编码可以避免这种问题。
假设有一个包含颜色的分类变量:
import pandas as pd

df = pd.DataFrame({'Color': ['Red', 'Blue', 'Green', 'Blue', 'Red']})
使用 pd.get_dummies 进行独热编码:
one_hot_encoded_df = pd.get_dummies(df, prefix='', prefix_sep='')
print(one_hot_encoded_df)
输出结果:
   Blue  Green  Red
0     0      0    1
1     1      0    0
2     0      1    0
3     1      0    0
4     0      0    1
独热编码通过将每个分类值转换为二进制变量来避免数值顺序误解,是处理分类数据的常用方法。这样,机器学习算法能够有效地使用这些数据进行建模。
import numpy as np
import pandas as pd
df = pd.DataFrame(data = np.random.randint(0,10,size = (10,3)),
                  index = list('ABCDEFHIJK'),
                  columns=['Python','Tensorflow','Keras'])

ran = np.random.permutation(10) # 随机重排
df.take(ran) # 重排DataFrame
df.take(np.random.randint(0,10,size = 15)) # 随机抽样

# 哑变量,独热编码,1表示有,0表示没有
df = pd.DataFrame({'key':['b','b','a','c','a','b']})
pd.get_dummies(df,prefix='',prefix_sep='')
数据重塑
import numpy as np
import pandas as pd
df = pd.DataFrame(data = np.random.randint(0,100,size = (10,3)),
                  index = list('ABCDEFHIJK'),
                  columns=['Python','Tensorflow','Keras'])
df.T # 转置
df2 = pd.DataFrame(data = np.random.randint(0,100,size = (20,3)),
                   index = pd.MultiIndex.from_product([list('ABCDEFHIJK'),['期中','期末']]),#多层索引
                   columns=['Python','Tensorflow','Keras'])
df2.unstack(level = -1) # 行旋转成列,level指定哪一层,进行变换
df2.stack() # 列旋转成行
df2.stack().unstack(level = 1) # 行列互换

# 多层索引DataFrame数学计算
df2.mean() # 各学科平均分
df2.mean(level=0) # 各学科,每个人期中期末平均分
df2.mean(level = 1) # 各学科,期中期末所有人平均分
数学和统计方法
简单统计指标
import numpy as np
import pandas as pd
df = pd.DataFrame(data = np.random.randint(0,100,size = (20,3)),
                  index = list('ABCDEFHIJKLMNOPQRSTU'),
                  columns=['Python','Tensorflow','Keras'])
# 1、简单统计指标
df.count() # 非NA值的数量
df.max(axis = 0) #轴0最大值,即每一列最大值
df.min() #默认计算轴0最小值
df.median() # 中位数
df.sum() # 求和
df.mean(axis = 1) #轴1平均值,即每一行的平均值
df.quantile(q = [0.2,0.4,0.8]) # 分位数
df.describe() # 查看数值型列的汇总统计,计数、平均值、标准差、最小值、四分位数、最大值
索引标签、位置获取
# 2、索引位置
df['Python'].argmin() # 计算最小值位置
df['Keras'].argmax() # 最大值位置
df.idxmax() # 最大值索引标签
df.idxmin() # 最小值索引标签
更多统计指标
# 3、更多统计指标
df['Python'].value_counts() # 统计元素出现次数
df['Keras'].unique() # 去重
df.cumsum() # 累加
df.cumprod() # 累乘
df.std() # 标准差
df.var() # 方差
df.cummin() # 累计最小值
df.cummax() # 累计最大值
df.diff() # 计算差分
df.pct_change() # 计算百分比变化
高级统计指标
# 4、高级统计指标
df.cov() # 属性的协方差
df['Python'].cov(df['Keras']) # Python和Keras的协方差
df.corr() # 所有属性相关性系数
df.corrwith(df['Tensorflow']) # 单一属性相关性系数
数据排序
import numpy as np
import pandas as pd
df = pd.DataFrame(data = np.random.randint(0,30,size = (30,3)),
                  index = list('qwertyuioijhgfcasdcvbnerfghjcf'),
                  columns = ['Python','Keras','Pytorch'])
# 1、索引列名排序
df.sort_index(axis = 0,ascending=True) # 按索引排序,降序
df.sort_index(axis = 1,ascending=False) #按列名排序,升序
# 2、属性值排序
df.sort_values(by = ['Python']) #按Python属性值排序
df.sort_values(by = ['Python','Keras'])#先按Python,再按Keras排序

# 3、返回属性n大或者n小的值
df.nlargest(10,columns='Keras') # 根据属性Keras排序,返回最大10个数据
df.nsmallest(5,columns='Python') # 根据属性Python排序,返回最小5个数据
分箱操作
分箱操作就是将连续数据转换为分类对应物的过程。比如将连续的身高数据划分为:矮,中,高。
分箱操作分为等距分箱和等频分箱。
分箱操作也叫面元划分或者离散化。
import numpy as np
import pandas as pd
df = pd.DataFrame(data = np.random.randint(0,150,size = (100,3)),
                  columns=['Python','Tensorflow','Keras'])
# 1、等宽分箱
pd.cut(df.Python,bins = 3)
# 指定宽度分箱
pd.cut(df.Keras,#分箱数据
       bins = [0,60,90,120,150],#分箱断点
       right = False,# 左闭右开
       labels=['不及格','中等','良好','优秀'])# 分箱后分类

# 2、等频分箱
pd.qcut(df.Python,q = 4,# 4等分
        labels=['差','中','良','优']) # 分箱后分类
分组聚合
分组
import numpy as np
import pandas as pd
# 准备数据
df = pd.DataFrame(data = {'sex':np.random.randint(0,2,size = 300), # 0男,1女
                          'class':np.random.randint(1,9,size = 300),#1~8八个班
                          'Python':np.random.randint(0,151,size = 300),#Python成绩
                          'Keras':np.random.randint(0,151,size =300),#Keras成绩
                          'Tensorflow':np.random.randint(0,151,size=300),
                          'Java':np.random.randint(0,151,size = 300),
                          'C++':np.random.randint(0,151,size = 300)})
df['sex'] = df['sex'].map({0:'男',1:'女'}) # 将0,1映射成男女
# 1、分组->可迭代对象
# 1.1 先分组再获取数据
g = df.groupby(by = 'sex')[['Python','Java']] # 单分组
for name,data in g:
    print('组名:',name)
    print('数据:',data)
df.groupby(by = ['class','sex'])[['Python']] # 多分组
# 1.2 对一列值进行分组
df['Python'].groupby(df['class']) # 单分组
df['Keras'].groupby([df['class'],df['sex']]) # 多分组
# 1.3 按数据类型分组
df.groupby(df.dtypes,axis = 1)
# 1.4 通过字典进行分组
m = {'sex':'category','class':'category','Python':'IT','Keras':'IT','Tensorflow':'IT','Java':'IT','C++':'IT'}
for name,data in df.groupby(m,axis = 1):
    print('组名',name)
    print('数据',data)
分组聚合
# 2、分组直接调用函数进行聚合
# 按照性别分组,其他列均值聚合
df.groupby(by = 'sex').mean().round(1) # 保留1位小数
# 按照班级和性别进行分组,Python、Keras的最大值聚合
df.groupby(by = ['class','sex'])[['Python','Keras']].max()
# 按照班级和性别进行分组,计数聚合。统计每个班,男女人数
df.groupby(by = ['class','sex']).size()
# 基本描述性统计聚合
df.groupby(by = ['class','sex']).describe()
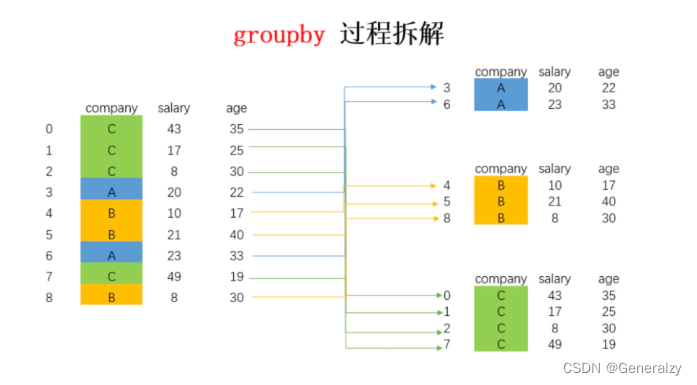
分组聚合apply、transform
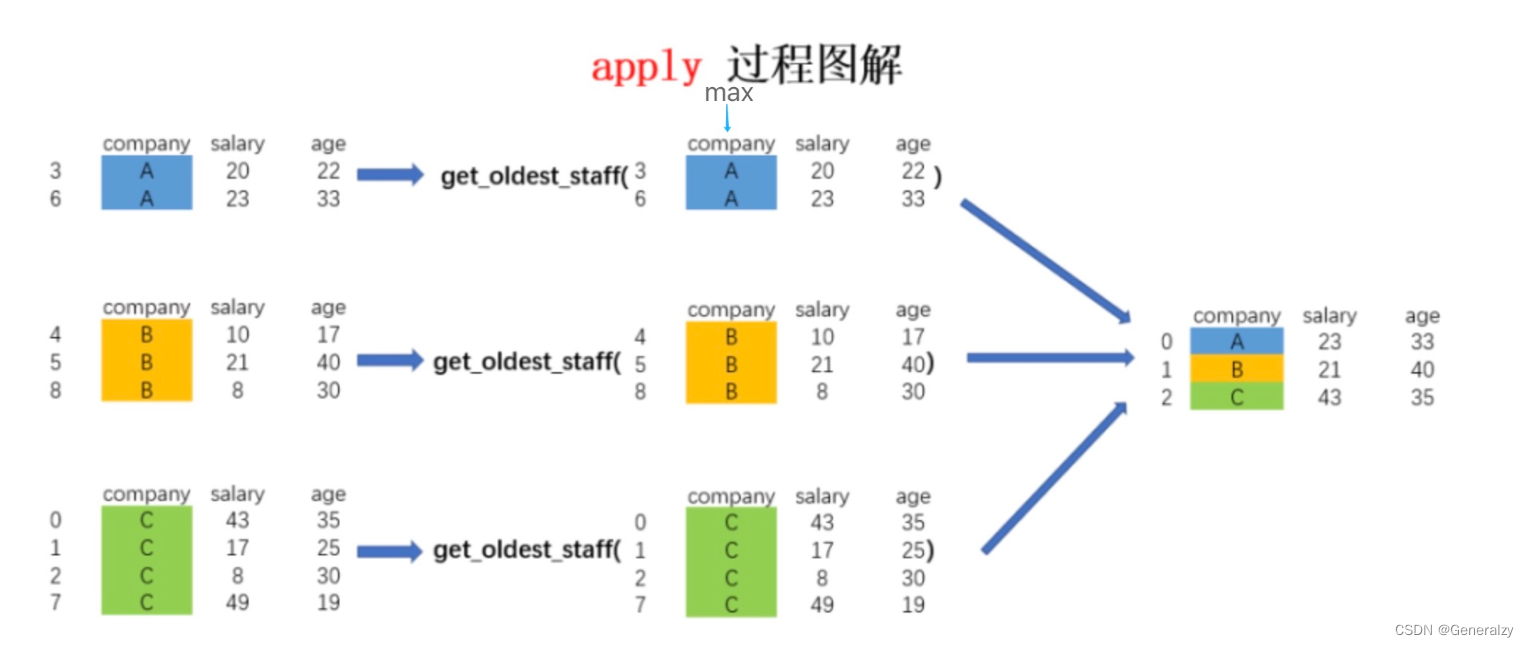
# 3、分组后调用apply,transform封装单一函数计算
# 返回分组结果
df.groupby(by = ['class','sex'])[['Python','Keras']].apply(np.mean).round(1)
def normalization(x):
    return (x - x.min())/(x.max() - x.min()) # 最大值最小值归一化
# 返回全数据,返回DataFrame.shape和原DataFrame.shape一样。
df.groupby(by = ['class','sex'])[['Python','Tensorflow']].transform(normalization).round(3)
分组聚合agg
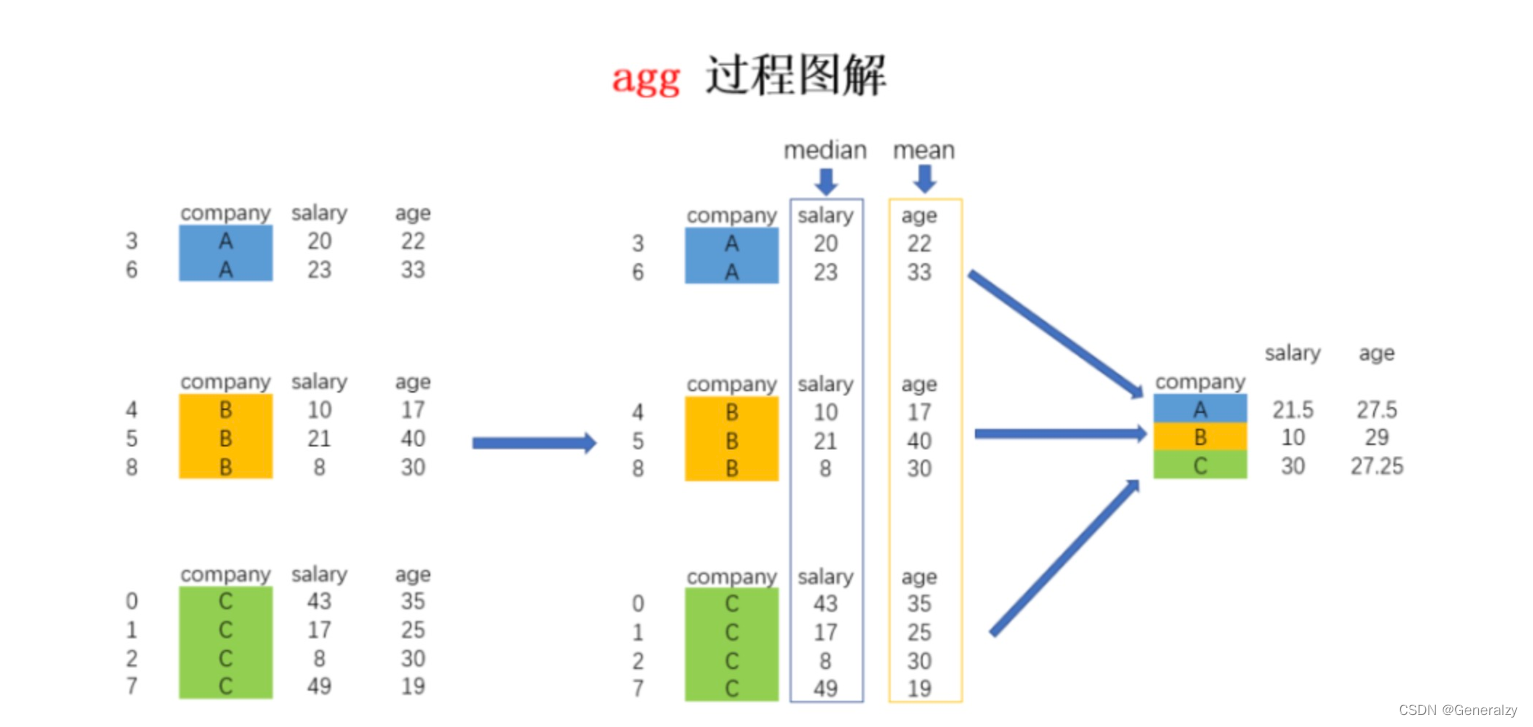
# 4、agg 多中统计汇总操作
# 分组后调用agg应用多种统计汇总
df.groupby(by = ['class','sex'])[['Tensorflow','Keras']].agg([np.max,np.min,pd.Series.count])
# 分组后不同属性应用多种不同统计汇总
df.groupby(by = ['class','sex'])[['Python','Keras']].agg({'Python':[('最大值',np.max),('最小值',np.min)],
                                                          'Keras':[('计数',pd.Series.count),('中位数',np.median)]})
透视表pivot_table
# 5、透视表
# 透视表也是一种分组聚合运算
def count(x):
    return len(x)
df.pivot_table(values=['Python','Keras','Tensorflow'],# 要透视分组的值
               index=['class','sex'], # 分组透视指标
               aggfunc={'Python':[('最大值',np.max)], # 聚合运算
                        'Keras':[('最小值',np.min),('中位数',np.median)],
                        'Tensorflow':[('最小值',np.min),('平均值',np.mean),('计数',count)]})
时间序列
时间戳操作
# 1、创建方法
pd.Timestamp('2020-8-24 12')# 时刻数据
pd.Period('2020-8-24',freq = 'M') # 时期数据
index = pd.date_range('2020.08.24',periods=5,freq = 'M') # 批量时刻数据
pd.period_range('2020.08.24',periods=5,freq='M') # 批量时期数据
ts = pd.Series(np.random.randint(0,10,size = 5),index = index) # 时间戳索引Series

# 2、转换方法
pd.to_datetime(['2020.08.24','2020-08-24','24/08/2020','2020/8/24'])
pd.to_datetime([1598582232],unit='s')
dt = pd.to_datetime([1598582420401],unit = 'ms') # 世界标准时间
dt + pd.DateOffset(hours = 8) # 东八区时间
dt + pd.DateOffset(days = 100) # 100天后日期
时间戳索引
index = pd.date_range("2020-8-24", periods=200, freq="D")
ts = pd.Series(range(len(index)), index=index)
# str类型索引
ts['2020-08-30'] # 日期访问数据
ts['2020-08-24':'2020-09-3'] # 日期切片
ts['2020-08'] # 传入年月
ts['2020'] # 传入年
# 时间戳索引
ts[pd.Timestamp('2020-08-30')]
ts[pd.Timestamp('2020-08-24'):pd.Timestamp('2020-08-30')] # 切片
ts[pd.date_range('2020-08-24',periods=10,freq='D')]

# 时间戳索引属性
ts.index.year # 获取年
ts.index.dayofweek # 获取星期几
ts.index.weekofyear # 一年中第几个星期几
时间序列常用方法
在做时间序列相关的工作时,经常要对时间做一些移动/滞后、频率转换、采样等相关操作
index = pd.date_range('8/1/2020', periods=365, freq='D')
ts = pd.Series(np.random.randint(0, 500, len(index)), index=index)

# 1、移动
ts.shift(periods = 2) #  数据后移
ts.shift(periods = -2) # 数据前移

# 日期移动
ts.shift(periods = 2,freq = pd.tseries.offsets.Day()) # 天移动
ts.tshift(periods = 1,freq = pd.tseries.offsets.MonthOffset()) #月移动

# 2、频率转换
ts.asfreq(pd.tseries.offsets.Week()) # 天变周
ts.asfreq(pd.tseries.offsets.MonthEnd()) # 天变月
ts.asfreq(pd.tseries.offsets.Hour(),fill_value = 0) #天变小时,又少变多,fill_value为填充值

# 3、重采样
# resample 表示根据日期维度进行数据聚合,可以按照分钟、小时、工作日、周、月、年等来作为日期维度
ts.resample('2W').sum() # 以2周为单位进行汇总
ts.resample('3M').sum().cumsum() # 以季度为单位进行汇总

# 4、DataFrame重采样
d = dict({'price': [10, 11, 9, 13, 14, 18, 17, 19],
          'volume': [50, 60, 40, 100, 50, 100, 40, 50],
          'week_starting':pd.date_range('24/08/2020',periods=8,freq='W')})
df1 = pd.DataFrame(d)
df1.resample('M',on = 'week_starting').apply(np.sum)
df1.resample('M',on = 'week_starting').agg({'price':np.mean,'volume':np.sum})

days = pd.date_range('1/8/2020', periods=4, freq='D')
data2 = dict({'price': [10, 11, 9, 13, 14, 18, 17, 19],
           'volume': [50, 60, 40, 100, 50, 100, 40, 50]})
df2 = pd.DataFrame(data2,
                   index=pd.MultiIndex.from_product([days,['morning','afternoon']]))
df2.resample('D', level=0).sum()
时区表示
index = pd.date_range('8/1/2012 00:00', periods=5, freq='D')
ts = pd.Series(np.random.randn(len(index)), index)
import pytz
pytz.common_timezones # 常用时区
# 时区表示
ts = ts.tz_localize(tz='UTC')
# 转换成其它时区
ts.tz_convert(tz = 'Asia/Shanghai')
数据可视化
数据可视化需要依赖pip install matplotlib -i https://pypi.tuna.tsinghua.edu.cn/simple
import numpy as np
import pandas as pd

# 1、线形图
df1 = pd.DataFrame(data = np.random.randn(1000,4),
                  index = pd.date_range(start = '27/6/2012',periods=1000),
                  columns=list('ABCD'))
df1.cumsum().plot()

# 2、条形图
df2 = pd.DataFrame(data = np.random.rand(10,4),
                   columns = list('ABCD'))
df2.plot.bar(stacked = True) # stacked 是否堆叠

# 3、饼图
df3 = pd.DataFrame(data = np.random.rand(4,2),
                   index = list('ABCD'),
                   columns=['One','Two'])
df3.plot.pie(subplots = True,figsize = (8,8))

# 4、散点图
df4 = pd.DataFrame(np.random.rand(50, 4), columns=list('ABCD'))
df4.plot.scatter(x='A', y='B') # A和B关系绘制
# 在一张图中绘制AC散点图,同时绘制BD散点图
ax = df4.plot.scatter(x='A', y='C', color='DarkBlue', label='Group 1');
df4.plot.scatter(x='B', y='D', color='DarkGreen', label='Group 2', ax=ax)
# 气泡图,散点有大小之分
df4.plot.scatter(x='A',y='B',s = df4['C']*200)


# 5、面积图
df5 = pd.DataFrame(data = np.random.rand(10, 4),
                   columns=list('ABCD'))
df5.plot.area(stacked = True);# stacked 是否堆叠

# 6、箱式图
df6 = pd.DataFrame(data = np.random.rand(10, 5),
                   columns=list('ABCDE'))
df6.plot.box()

# 7、直方图
df7 = pd.DataFrame({'A': np.random.randn(1000) + 1, 'B': np.random.randn(1000),
                    'C': np.random.randn(1000) - 1})
df7.plot.hist(alpha=0.5) #带透明度直方图
df7.plot.hist(stacked = True)# 堆叠图
df7.hist(figsize = (8,8)) # 子视图绘制
pandas库的亮点
- 一个快速、高效的DataFrame对象,用于数据操作和综合索引;
- 用于在内存数据结构和不同格式之间读写数据的工具:CSV和文本文件、Microsoft Excel、SQL数据库和快速HDF 5格式;
- 智能数据对齐和丢失数据的综合处理:在计算中获得基于标签的自动对齐,并轻松地将凌乱的数据操作为有序的形式;
- 数据集的灵活调整和旋转;
- 基于智能标签的切片、花式索引和大型数据集的子集;
- 可以从数据结构中插入和删除列,以实现大小可变;
- 通过在强大的引擎中聚合或转换数据,允许对数据集进行拆分应用组合操作;
- 数据集的高性能合并和连接;
- 层次轴索引提供了在低维数据结构中处理高维数据的直观方法;
- 时间序列-功能:日期范围生成和频率转换、移动窗口统计、移动窗口线性回归、日期转换和滞后。甚至在不丢失数据的情况下创建特定领域的时间偏移和加入时间序列;
- 对性能进行了高度优化,用Cython或C编写了关键代码路径。
- Python与pandas在广泛的学术和商业领域中使用,包括金融,神经科学,经济学,统计学,广告,网络分析,等等
- 学到这里,体会一会pandas库的亮点,如果对哪些还不熟悉,请对之前知识点再次进行复习。
Matplotlib数据可视化
在数据分析与机器学习中,经常要用到大量的可视化操作。一张制作精美的数据图片,可以展示大量的信息,一图顶千言。
在可视化中,Matplotlib算得上是最常用的工具。Matplotlib 是 python 最著名的绘图库,它提供了一整套 API,十分适合绘制图表,或修改图表的一些属性,如字体、标签、范围等。
Matplotlib 是一个 Python 的 2D 绘图库,它交互式环境生成出版质量级别的图形。通过 Matplotlib这个标准类库,开发者只需要几行代码就可以实现生成绘图,折线图、散点图、柱状图、饼图、直方图、组合图等数据分析可视化图表。
pip install matplotlib -i https://pypi.tuna.tsinghua.edu.cn/simple
基础知识
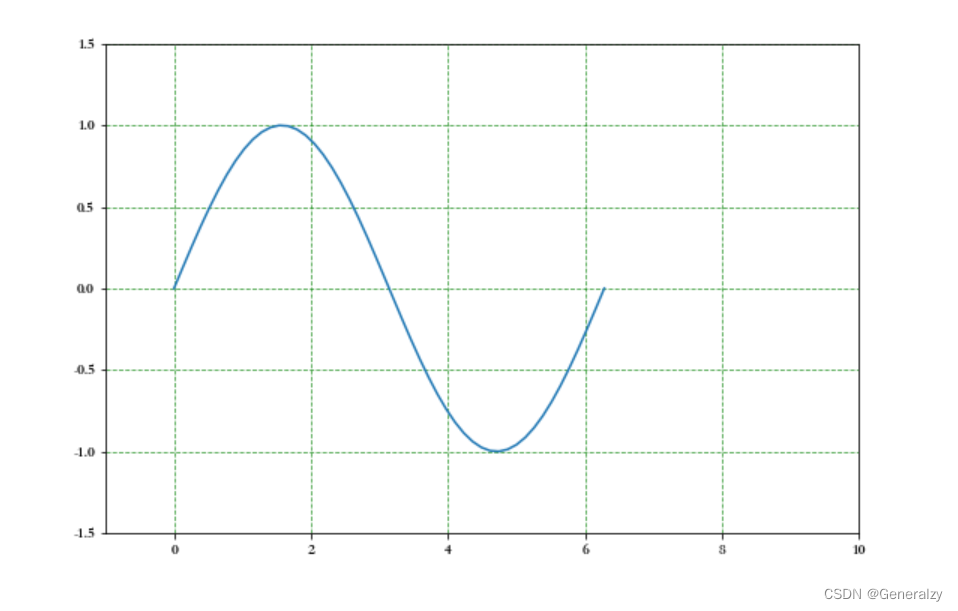
图形绘制
import numpy as np
import matplotlib.pyplot as plt
# 1、图形绘制
x = np.linspace(0,2*np.pi) # x轴
# y轴
y = np.sin(x) # 正弦
# 绘制线形图
# 调整尺寸
plt.figure(figsize=(9,6))
plt.plot(x,y)
# 继续调用plot绘制多条线形图
# 2、设置网格线
plt.grid(linestyle = '--',# 样式
         color = 'green',# 颜色
         alpha = 0.75) # 透明度
# 3、设置坐标轴范围
plt.axis([-1,10,-1.5,1.5])
plt.xlim([-1,10])
plt.ylim([-1.5,1.5])
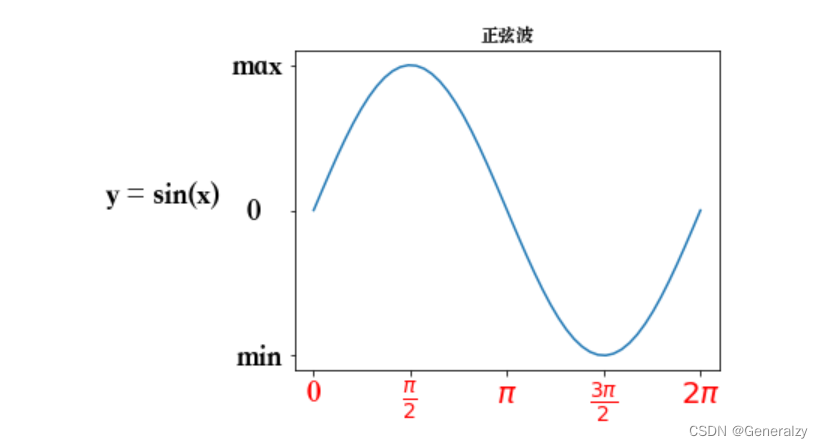
坐标轴刻度、标签、标题
import numpy as np
import matplotlib.pyplot as plt
# 1、图形绘制
x = np.linspace(0,2*np.pi) # x轴
# y轴
y = np.sin(x) # 正弦
plt.plot(x,y)
# 2、设置x轴y轴刻度
plt.xticks(np.arange(0,7,np.pi/2))
plt.yticks([-1,0,1])
# 3、设置x轴y轴刻度标签
_ = plt.yticks(ticks = [-1,0,1],labels=['min','   0   ','max'],fontsize = 20,ha = 'right')
font={'family':'serif','style':'italic','weight':'normal','color':'red','size':16}
_ = plt.xticks(ticks = np.arange(0,7,np.pi/2),
               # LaTex语法,输入格式为:r'$\sigma$'  #其中的sigma对应于希腊字母的σ
               labels = ['0',r'$\frac{\pi}{2}$',r'$\pi$',r'$\frac{3\pi}{2}$',r'$2\pi$'],
               fontsize = 20,
               fontweight = 'normal',
               color = 'red')
# 4、坐标轴标签,标题
plt.ylabel('y = sin(x)',rotation = 0,
           horizontalalignment = 'right',fontstyle = 'normal',fontsize = 20)
# 获取电脑上的字体库
from matplotlib.font_manager import FontManager
fm = FontManager()
mat_fonts = set(f.name for f in fm.ttflist)
# print(mat_fonts)
plt.rcParams['font.sans-serif'] = 'Songti SC' # 设置宋体,显示中文
plt.title('正弦波')

plt.show()
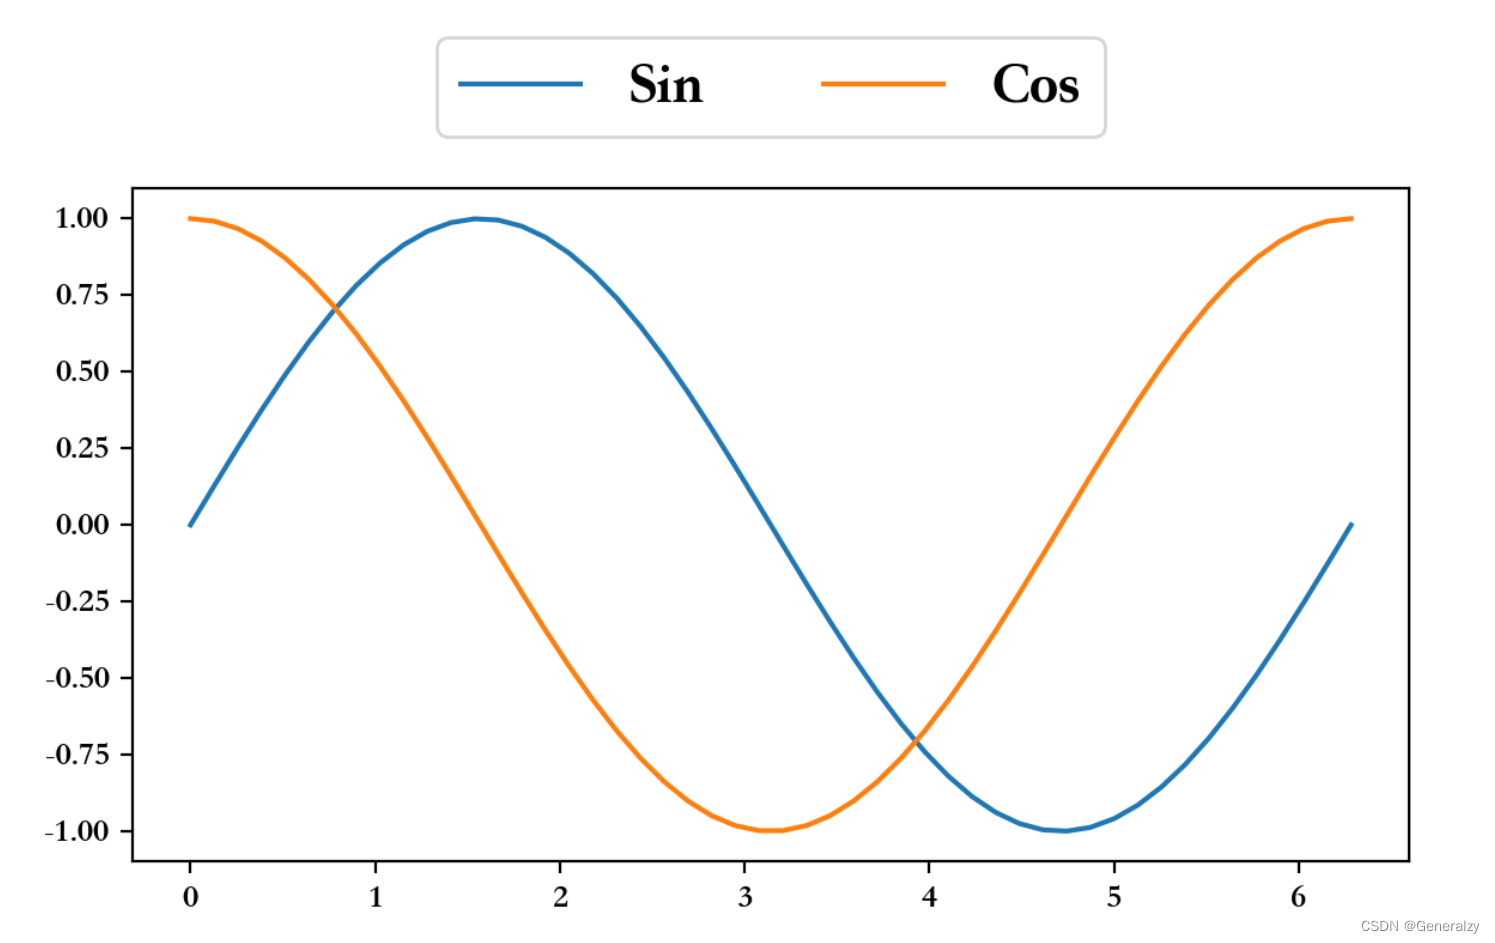
图例
import numpy as np
import matplotlib.pyplot as plt

# 1、图形绘制
x = np.linspace(0,2*np.pi) # x轴
# y轴
y = np.sin(x) # 正弦
# 绘制线形图
# 调整尺寸
plt.figure(figsize=(9,6))
plt.plot(x,y)

# 2、图例
plt.plot(x,np.cos(x)) # 余弦波
plt.legend(['Sin','Cos'],fontsize = 18,loc = 'center',ncol = 2,bbox_to_anchor = [0,1.05,1,0.2])
脊柱移动
import numpy as np
import matplotlib.pyplot as plt
x = np.linspace(-np.pi,np.pi,50)
plt.rcParams['axes.unicode_minus'] = False
plt.figure(figsize=(9,6))
plt.plot(x,np.sin(x),x,np.cos(x))
ax = plt.gca() # 获取当前视图
# 右边和上面脊柱消失
ax.spines['right'].set_color('white')
ax.spines['top'].set_color('#FFFFFF')

# 设置下面左边脊柱位置,data表示数据,axes表示相对位置0~1
ax.spines['bottom'].set_position(('data',0))
ax.spines['left'].set_position(('data',0))

plt.yticks([-1,0,1],labels=['-1','0','1'],fontsize = 18)
_ = plt.xticks([-np.pi,-np.pi/2,np.pi/2,np.pi],
           labels=[r'$-\pi$',r'$-\frac{\pi}{2}$',r'$\frac{\pi}{2}$',r'$\pi$'],
           fontsize = 18)

plt.show()
labels = ['0',r'$\frac{\pi}{2}$',r'$\pi$',r'$\frac{3\pi}{2}$',r'$2\pi$']
在这段代码中:
labels = ['0',r'$\frac{\pi}{2}$',r'$\pi$',r'$\frac{3\pi}{2}$',r'$2\pi$']
这里的 r'...' 是一个原始字符串(raw string)表示法,它告诉Python不要对字符串中的反斜杠进行转义。
这些标签使用了LaTeX语法,用于显示数学公式,具体解释如下:
'0':标签为普通字符0。r'$\frac{\pi}{2}$':使用LaTeX语法显示为 (\frac{\pi}{2})。r'$\pi$':使用LaTeX语法显示为 (\pi)。r'$\frac{3\pi}{2}$':使用LaTeX语法显示为 (\frac{3\pi}{2})。r'$2\pi$':使用LaTeX语法显示为 (2\pi)。
这些LaTeX格式的标签用于绘制图表时,可以让刻度标签以数学公式的形式显示,特别适合显示数学函数等内容。
所以,labels 列表定义了要在x轴上显示的标签,其中包括普通字符和使用LaTeX语法的数学公式。这个列表随后会被传递给 plt.xticks 函数,用于设置x轴的刻度标签。
LaTeX语法
LaTeX(读作 “Lay-tech” 或 “Lah-tech”)是一种基于排版系统TeX的文档准备系统,广泛用于科学和学术文档的排版。LaTeX允许作者在文档中插入复杂的数学公式、表格、图形和其他格式化内容,具有高质量的排版效果。
LaTeX文档由纯文本文件组成,通常以 .tex 为扩展名,包含特定的命令和环境。以下是一些基本的LaTeX语法示例:
-
文档结构:
\documentclass{article} % 文档类型 \begin{document} % 文档开始 Hello, World! % 文档内容 \end{document} % 文档结束 -
数学公式:
- 行内公式使用
$...$:这是一个行内公式:$E=mc^2$。 - 独立公式使用
\[...\]:这是一个独立公式: \[ E=mc^2 \]
- 行内公式使用
-
常用数学符号:
- 分数:
\frac{分子}{分母}\frac{a}{b} - 上标和下标:
a^2和a_1 - 希腊字母:
\alpha,\beta,\pi等
- 分数:
-
其他:
- 加粗:
\textbf{加粗文本} - 斜体:
\textit{斜体文本} - 插入图像:
\includegraphics{image.jpg}
- 加粗:
LaTeX有非常详细的官方文档和社区资源。以下是一些重要的资源链接:
-
LaTeX项目官方网站:LaTeX Project
- 提供了LaTeX的下载、介绍、指南等资源。
-
CTAN(Comprehensive TeX Archive Network):CTAN
- 是TeX和LaTeX软件包的主要存储库,提供了大量的文档和包。
-
在线LaTeX编辑器:Overleaf
- 是一个流行的在线LaTeX编辑器,支持实时协作和预览。
-
LaTeX Wikibook:Wikibooks LaTeX
- 提供了详细的LaTeX教程和参考。
图片保存
import numpy as np
import matplotlib.pyplot as plt
# 1、图形绘制
x = np.linspace(0,2*np.pi) # x轴
# y轴
y = np.sin(x) # 正弦波
plt.figure(linewidth = 4)
plt.plot(x,y,color = 'red')
plt.plot(x,np.cos(x),color = 'k') # 余弦波

ax = plt.gca() # 获取视图
ax.set_facecolor('lightgreen') # 设置视图背景颜色
# 2、图例
plt.legend(['Sin','Cos'],fontsize = 18,loc = 'center',ncol = 2,bbox_to_anchor = [0,1.05,1,0.2])
# plt.tight_layout() # 自动调整布局空间,就不会出现图片保存不完整
plt.savefig('./基础5.png', # 文件名:png、jpg、pdf
            dpi = 100, # 保存图片像素密度
            facecolor = 'violet', # 视图与边界之间颜色设置
            edgecolor = 'lightgreen', # 视图边界颜色设置
            bbox_inches = 'tight')# 保存图片完整
风格和样式
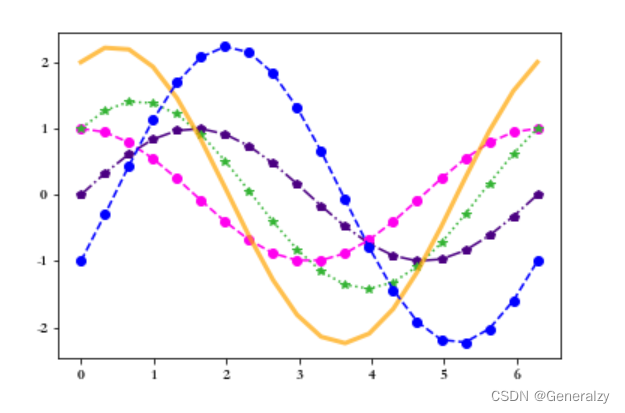
颜色、线形、点形、线宽、透明度
import numpy as np
import matplotlib.pyplot as plt
x = np.linspace(0,2*np.pi,20)
y1 = np.sin(x)
y2 = np.cos(x)

# 设置颜色,线型,点型
plt.plot(x,y1,color = 'indigo',ls = '-.',marker = 'p')
plt.plot(x,y2,color = '#FF00EE',ls = '--',marker = 'o')
plt.plot(x,y1 + y2,color = (0.2,0.7,0.2),marker = '*',ls = ':')
plt.plot(x,y1 + 2*y2,linewidth = 3,alpha = 0.7,color = 'orange') # 线宽、透明度
plt.plot(x,2*y1 - y2,'bo--') # 参数连用
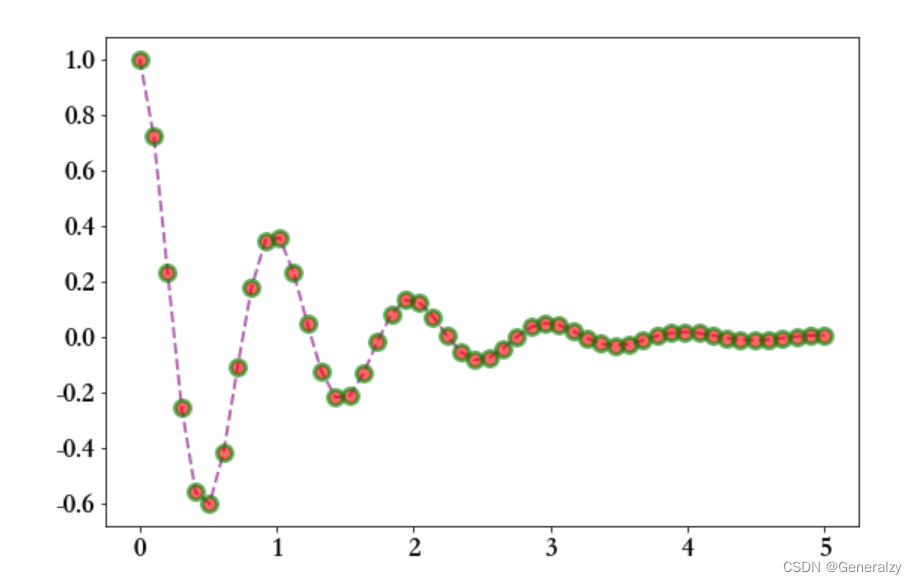
更多属性设置
import numpy as np
import pandas as pd
def f(x):
    return np.exp(-x) * np.cos(2*np.pi*x)
x = np.linspace(0,5,50)
plt.figure(figsize=(9,6))
plt.plot(x,f(x),color = 'purple',
         marker = 'o',
         ls = '--',
         lw = 2,
         alpha = 0.6,
         markerfacecolor = 'red',# 点颜色
         markersize = 10,# 点大小
         markeredgecolor = 'green',#点边缘颜色
         markeredgewidth = 3)#点边缘宽度
plt.xticks(size = 18) # 设置刻度大小
plt.yticks(size = 18)
多图布局
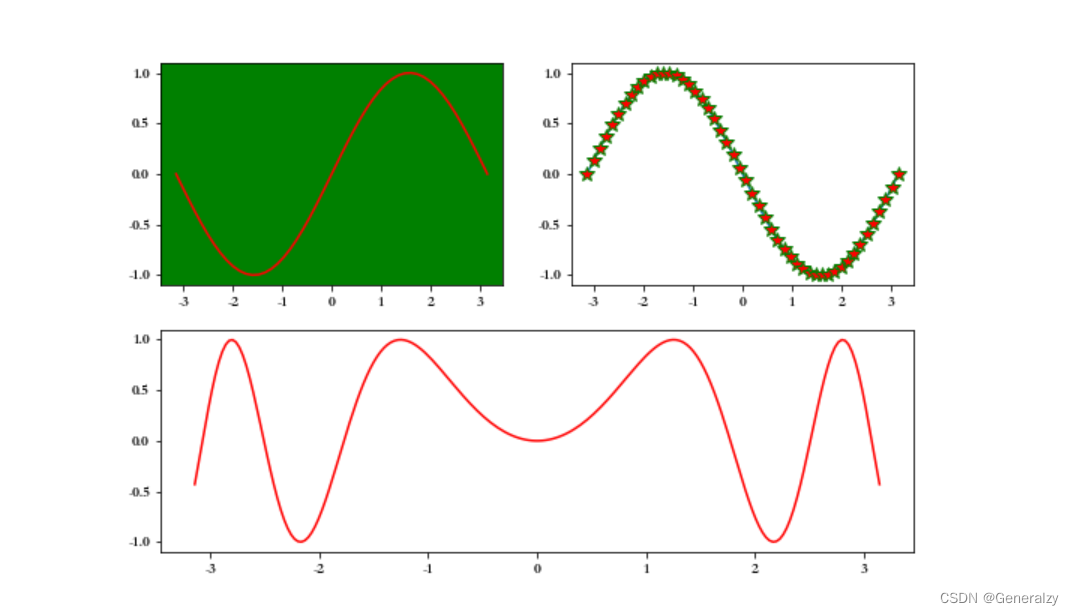
子视图
import numpy as np
import matplotlib.pyplot as plt

x = np.linspace(-np.pi,np.pi,50)
y = np.sin(x)

# 子视图1
plt.figure(figsize=(9,6))
ax = plt.subplot(221) # 两行两列第一个子视图
ax.plot(x,y,color = 'red')
ax.set_facecolor('green') # 调用子视图设置方法,设置子视图整体属性
# 子视图2
ax = plt.subplot(2,2,2) # 两行两列第二个子视图
line, = ax.plot(x,-y) # 返回绘制对象
line.set_marker('*') # 调用对象设置方法,设置属性
line.set_markerfacecolor('red')
line.set_markeredgecolor('green')
line.set_markersize(10)
# 子视图3
ax = plt.subplot(2,1,2) # 两行一列第二行视图
plt.sca(ax) # 设置当前视图
x = np.linspace(-np.pi,np.pi,200)
plt.plot(x,np.sin(x*x),color = 'red')
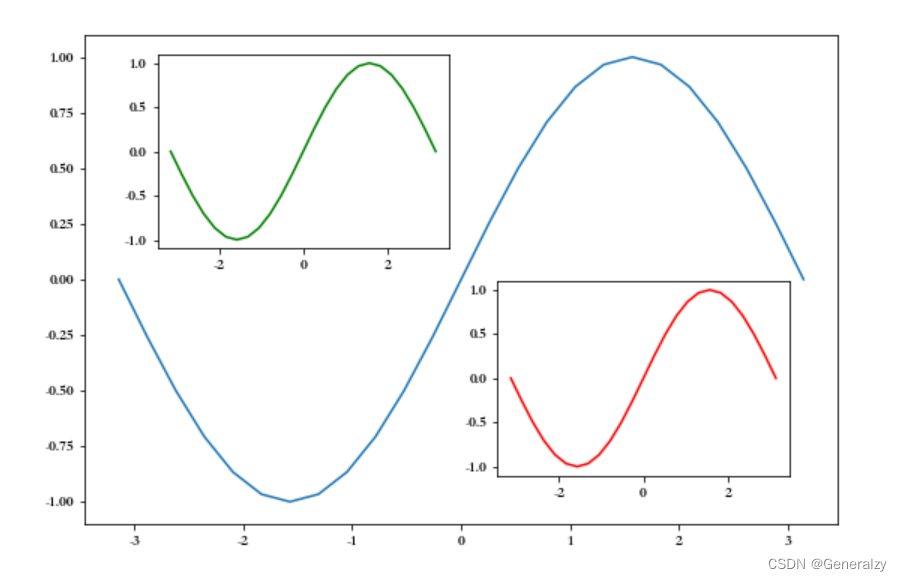
嵌套
import numpy as np
import matplotlib.pyplot as plt

x = np.linspace(-np.pi,np.pi,25)
y = np.sin(x)
fig = plt.figure(figsize=(9,6)) # 创建视图

plt.plot(x,y)

# 嵌套方式一,axes轴域(横纵坐标范围),子视图
ax = plt.axes([0.2,0.55,0.3,0.3]) # 参数含义[left, bottom, width, height]
ax.plot(x,y,color = 'g')

# 嵌套方式二
ax = fig.add_axes([0.55,0.2,0.3,0.3]) # 使用视图对象添加子视图
ax.plot(x,y,color = 'r')
多图布局分格显示
均匀布局
import numpy as np
import matplotlib.pyplot as plt
x = np.linspace(0,2*np.pi)
# sharex:所有小图共享x轴  sharey:表示所有小图共享y轴  坐标轴以所有小图中范围最大的进行显示
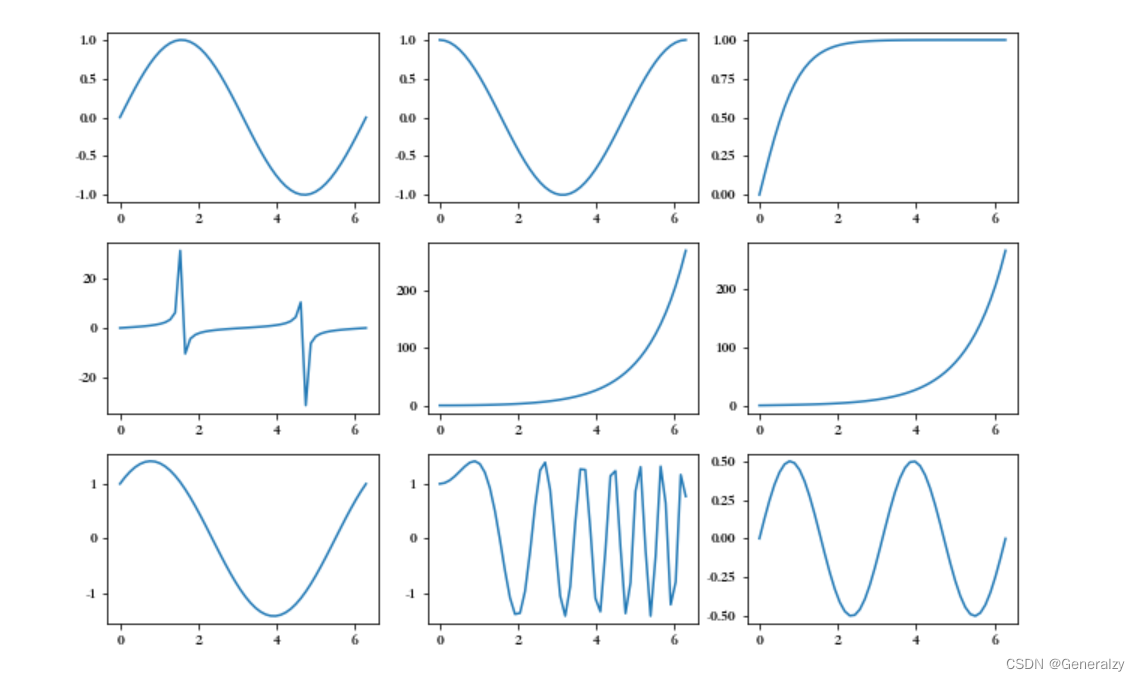
fig, ((ax11,ax12,ax13), (ax21,ax22,ax23),(ax31,ax32,ax33)) = plt.subplots(3, 3)
# 也可通过plt.subplot() 一个个添加子视图
fig.set_figwidth(9)
fig.set_figheight(6)
ax11.plot(x,np.sin(x))
ax12.plot(x,np.cos(x))
ax13.plot(x,np.tanh(x))
ax21.plot(x,np.tan(x))
ax22.plot(x,np.cosh(x))
ax23.plot(x,np.sinh(x))
ax31.plot(x,np.sin(x) + np.cos(x))
ax32.plot(x,np.sin(x*x) + np.cos(x*x))
ax33.plot(x,np.sin(x)*np.cos(x))
# 紧凑显示,边框会比较小,可以注释掉该行查看效果
plt.tight_layout()
plt.show()
不均匀分布
方式一:
import numpy as np
import matplotlib.pyplot as plt
# 需要导入gridspec模块
x = np.linspace(0,2*np.pi,200)
fig = plt.figure(figsize=(12,9))
# 使用切片方式设置子视图
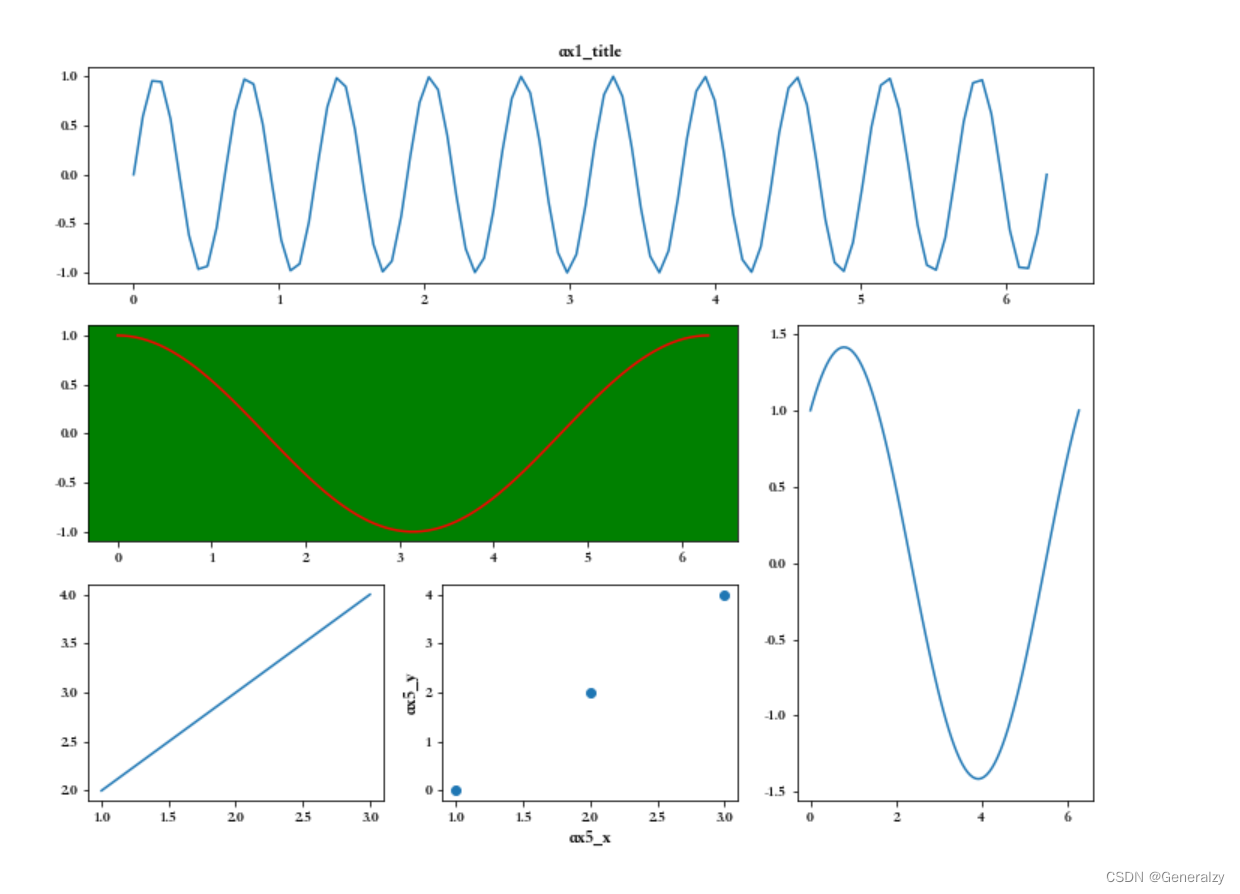
ax1 = plt.subplot(3,1,1) # 视图对象添加子视图
ax1.plot(x,np.sin(10*x))
# 设置ax1的标题,xlim、ylim、xlabel、ylabel等所有属性现在只能通过set_属性名的方法设置
ax1.set_title('ax1_title')  # 设置小图的标题
ax2 = plt.subplot(3,3,(4,5))
ax2.set_facecolor('green')
ax2.plot(x,np.cos(x),color = 'red')
ax3 = plt.subplot(3,3,(6,9))
ax3.plot(x,np.sin(x) + np.cos(x))
ax4 = plt.subplot(3,3,7)
ax4.plot([1,3],[2,4])
ax5 = plt.subplot(3,3,8)
ax5.scatter([1,2,3], [0,2, 4])
ax5.set_xlabel('ax5_x',fontsize = 12)
ax5.set_ylabel('ax5_y',fontsize = 12)
plt.show()
方式二:
import numpy as np
import matplotlib.pyplot as plt
x = np.linspace(0,2*np.pi,100)
plt.figure(figsize=(12,9))
# 子视图1
ax1 = plt.subplot2grid(shape = (3, 3),# 布局形状
                       loc =  (0, 0), # 布局绘制位置
                       colspan=3) # 跨几列
ax1.plot(x,np.sin(10*x))
# 设置ax1的标题,xlim、ylim、xlabel、ylabel等所有属性现在只能通过set_属性名的方法设置
ax1.set_title('ax1_title')  # 设置小图的标题
# 子视图2
ax2 = plt.subplot2grid((3, 3), (1, 0), colspan=2) # 跨两列
ax2.set_facecolor('green')
ax2.plot(x,np.cos(x),color = 'red')
# 子视图3
ax3 = plt.subplot2grid((3, 3), (1, 2), rowspan=2) # 跨两行
ax3.plot(x,np.sin(x) + np.cos(x))
# 子视图4
ax4 = plt.subplot2grid((3, 3), (2, 0))
ax4.plot([1,3],[2,4])
# 子视图5
ax5 = plt.subplot2grid((3, 3), (2, 1))
ax5.scatter([1,2,3], [0,2, 4])
ax5.set_xlabel('ax5_x',fontsize = 12)
ax5.set_ylabel('ax5_y',fontsize = 12)
方式三:
import numpy as np
import matplotlib.pyplot as plt
# 需要导入gridspec模块
import matplotlib.gridspec as gridspec
x = np.linspace(0,2*np.pi,200)
fig = plt.figure(figsize=(12,9))
# 将整个视图分成3x3布局
gs = gridspec.GridSpec(3, 3)
# 使用切片方式设置子视图
ax1 = fig.add_subplot(gs[0,:]) # 视图对象添加子视图
ax1.plot(x,np.sin(10*x))
# 设置ax1的标题,xlim、ylim、xlabel、ylabel等所有属性现在只能通过set_属性名的方法设置
ax1.set_title('ax1_title')  # 设置小图的标题
ax2 = plt.subplot(gs[1, :2]) # 模块调用
ax2.set_facecolor('green')
ax2.plot(x,np.cos(x),color = 'red')
# 从第一行到最后,占1、2两行,后面的2表示只占用第二列,也就是最后的一列
ax3 = plt.subplot(gs[1:, 2])
ax3.plot(x,np.sin(x) + np.cos(x))
# 倒数第一行,只占第0列这一列
ax4 = plt.subplot(gs[-1, 0])
ax4.plot([1,3],[2,4])
# 倒数第一行,只占倒数第二列,由于总共三列,所以倒数第二列就是序号1的列
ax5 = plt.subplot(gs[-1, -2])
ax5.scatter([1,2,3], [0,2, 4])
ax5.set_xlabel('ax5_x',fontsize = 12)
ax5.set_ylabel('ax5_y',fontsize = 12)
plt.show()
双轴显示
import numpy as np
import matplotlib.pyplot as plt

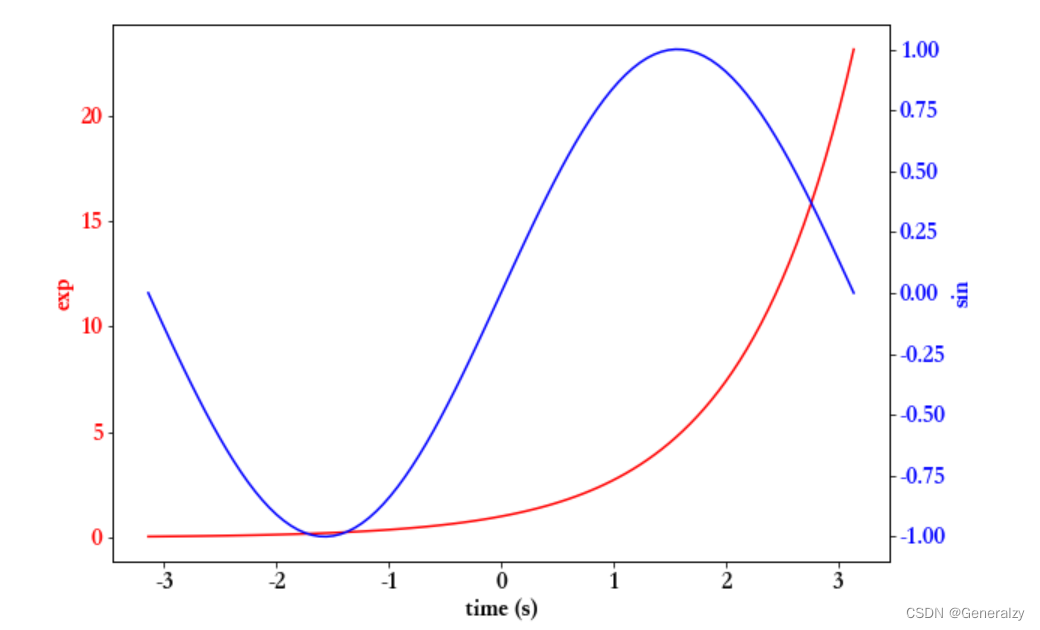
x = np.linspace(-np.pi,np.pi,100)
data1 = np.exp(x)
data2 = np.sin(x)

plt.figure(figsize=(9,6))
plt.rcParams['font.size'] = 16 # 设置整体字体大小

ax1 = plt.gca() # 获取当前轴域

ax1.set_xlabel('time (s)') # 设置x轴标签
ax1.set_ylabel('exp', color='red') # 设置y轴标签
ax1.plot(t, data1, color='red') # 数据绘制
ax1.tick_params(axis='y', labelcolor='red') # 设置y轴刻度属性

ax2 = ax1.twinx()  # 创建新axes实例,共享x轴,并设置
ax2.set_ylabel('sin', color='blue')
ax2.plot(t, data2, color='blue')
ax2.tick_params(axis='y', labelcolor='blue')

plt.tight_layout() # 紧凑布局
文本、注释、箭头
常用函数如下:
| Pyplot函数 | API方法 | 描述 |
|---|---|---|
| text() | mpl.axes.Axes.text() | 在Axes对象的任意位置添加文字 |
| xlabel() | mpl.axes.Axes.set_xlabel() | 为X轴添加标签 |
| ylabel() | mpl.axes.Axes.set_ylabel() | 为Y轴添加标签 |
| title() | mpl.axes.Axes.set_title() | 为Axes对象添加标题 |
| legend() | mpl.axes.Axes.legend() | 为Axes对象添加图例 |
| annnotate() | mpl.axes.Axes.annotate() | 为Axes对象添加注释(箭头可选) |
| figtext() | mpl.figure.Figure.text() | 在Figure对象的任意位置添加文字 |
| suptitle() | mpl.figure.Figure.suptitle() | 为Figure对象添加中心化的标题 |
文本
import numpy as np
import matplotlib.pyplot as plt

# 字体属性
font = {'fontsize': 20,
        'family': 'Kaiti SC',
        'color':  'red',
        'weight': 'bold'}

x = np.linspace(0.0, 5.0, 100)
y = np.cos(2*np.pi*x) * np.exp(-x)

plt.figure(figsize=(9,6))
plt.plot(x, y, 'k')
plt.title('exponential decay',fontdict=font)
plt.suptitle('指数衰减',y = 1.05,fontdict = font,fontsize = 30)
plt.text(x = 2, y = 0.65, # 横纵坐标位置
         s = r'$\cos(2 \pi t) \exp(-t)$') # 文本内容
plt.xlabel('time (s)')
plt.ylabel('voltage (mV)')
plt.show()
箭头
import matplotlib.pyplot as plt
import numpy

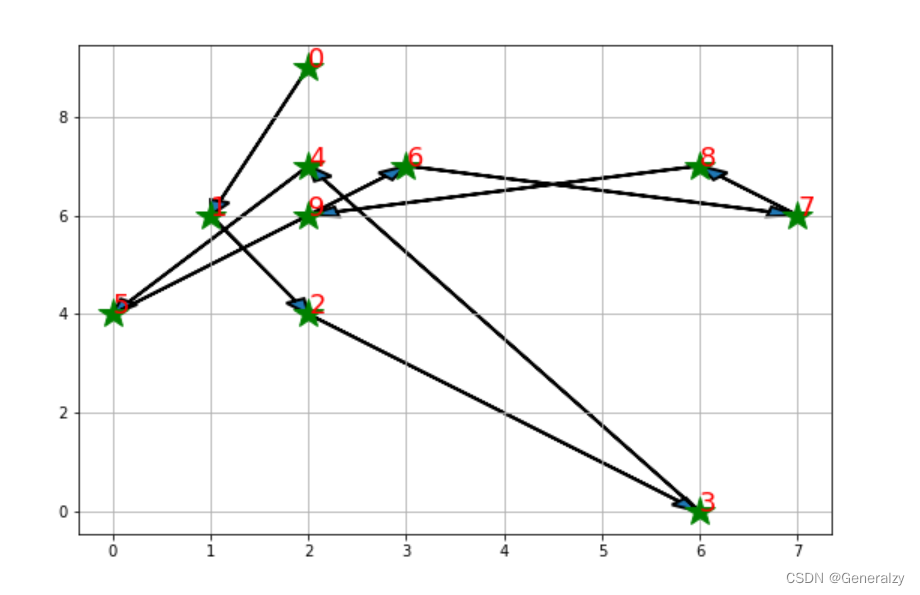
loc = np.random.randint(0,10,size = (10,2))
plt.figure(figsize=(10, 10))
plt.plot(loc[:,0], loc[:,1], 'g*', ms=20)
plt.grid(True)

# 路径
way = np.arange(10)
np.random.shuffle(way)

for i in range(0, len(way)-1):
    start = loc[way[i]]
    end = loc[way[i+1]]
    plt.arrow(start[0], start[1], end[0]-start[0], end[1]-start[1], # 坐标与距离
              head_width=0.2, lw=2,#箭头长度,箭尾线宽
              length_includes_head = True) # 长度计算包含箭头箭尾
    plt.text(start[0],start[1],s = i,fontsize = 18,color = 'red') # 文本
    if i == len(way) - 2: # 最后一个点
        plt.text(end[0],end[1],s = i + 1,fontsize = 18,color = 'red')
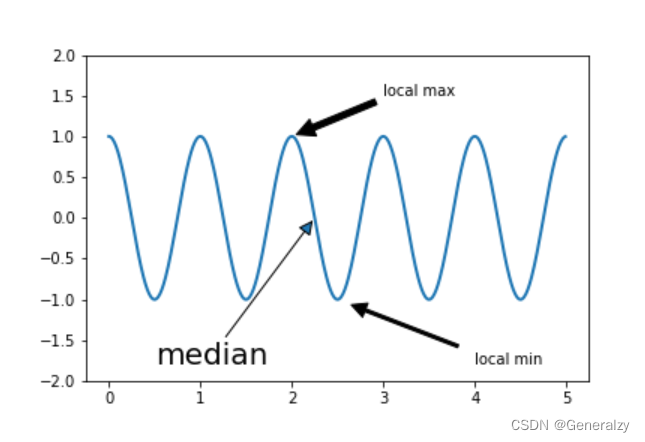
注释
import numpy as np
import matplotlib.pyplot as plt
fig, ax = plt.subplots()
x = np.arange(0.0, 5.0, 0.01)
y = np.cos(2*np.pi*x)
line, = ax.plot(x,y,lw=2)
ax.annotate('local max', # 文本内容
            xy=(2, 1),  # 箭头指向位置
            xytext=(3, 1.5), # 文本位置
            arrowprops=dict(facecolor='black', shrink=0.05)) # 箭头
ax.annotate('local min',
            xy = (2.5,-1),
            xytext = (4,-1.8),
            arrowprops = dict(facecolor = 'black',
                              width = 2, # 箭头宽度
                              headwidth = 10,# 箭头头部宽度
                              headlength = 10, # 箭头头部长度
                              shrink = 0.1)) # 箭头两端收缩的百分比(占总长)
ax.annotate('median',
            xy = (2.25,0),
            xytext = (0.5,-1.8),
            arrowprops = dict(arrowstyle = '-|>'), # 箭头样式
            fontsize = 20)
ax.set_ylim(-2, 2)
注释箭头连接形状
import matplotlib.pyplot as plt

def annotate_con_style(ax, connectionstyle):
    x1, y1 = 3,2
    x2, y2 = 8,6
    ax.plot([x1, x2], [y1, y2], ".")
    ax.annotate(s = '',
                xy=(x1, y1), # 相当于B点,arrow head
                xytext=(x2, y2), # 相当于A点,arrow tail
                arrowprops=dict(arrowstyle='->', color='red',
                                shrinkA = 5,shrinkB = 5,
                                connectionstyle=connectionstyle))

    ax.text(.05, 0.95, connectionstyle.replace(",", "\n"),
            transform=ax.transAxes, # 相对坐标
            ha="left", va="top")# 指定对齐方式

# 常用箭头连接样式
fig, axs = plt.subplots(3, 5, figsize=(9,6))
annotate_con_style(axs[0, 0], "angle3,angleA=90,angleB=0")
annotate_con_style(axs[1, 0], "angle3,angleA=0,angleB=90")
annotate_con_style(axs[2, 0], "angle3,angleA = 0,angleB=150")
annotate_con_style(axs[0, 1], "arc3,rad=0.")
annotate_con_style(axs[1, 1], "arc3,rad=0.3")
annotate_con_style(axs[2, 1], "arc3,rad=-0.3")
annotate_con_style(axs[0, 2], "angle,angleA=-90,angleB=180,rad=0")
annotate_con_style(axs[1, 2], "angle,angleA=-90,angleB=180,rad=5")
annotate_con_style(axs[2, 2], "angle,angleA=-90,angleB=10,rad=5")
annotate_con_style(axs[0, 3], "arc,angleA=-90,angleB=0,armA=30,armB=30,rad=0")
annotate_con_style(axs[1, 3], "arc,angleA=-90,angleB=0,armA=30,armB=30,rad=5")
annotate_con_style(axs[2, 3], "arc,angleA=-90,angleB=0,armA=0,armB=40,rad=0")
annotate_con_style(axs[0, 4], "bar,fraction=0.3")
annotate_con_style(axs[1, 4], "bar,fraction=-0.3")
annotate_con_style(axs[2, 4], "bar,angle=180,fraction=-0.2")

for ax in axs.flat:
    # 设置轴域刻度
    ax.set(xlim=(0, 10), ylim=(0, 10),xticks = [],yticks = [],aspect=1)
fig.tight_layout(pad=0.2)
常用视图
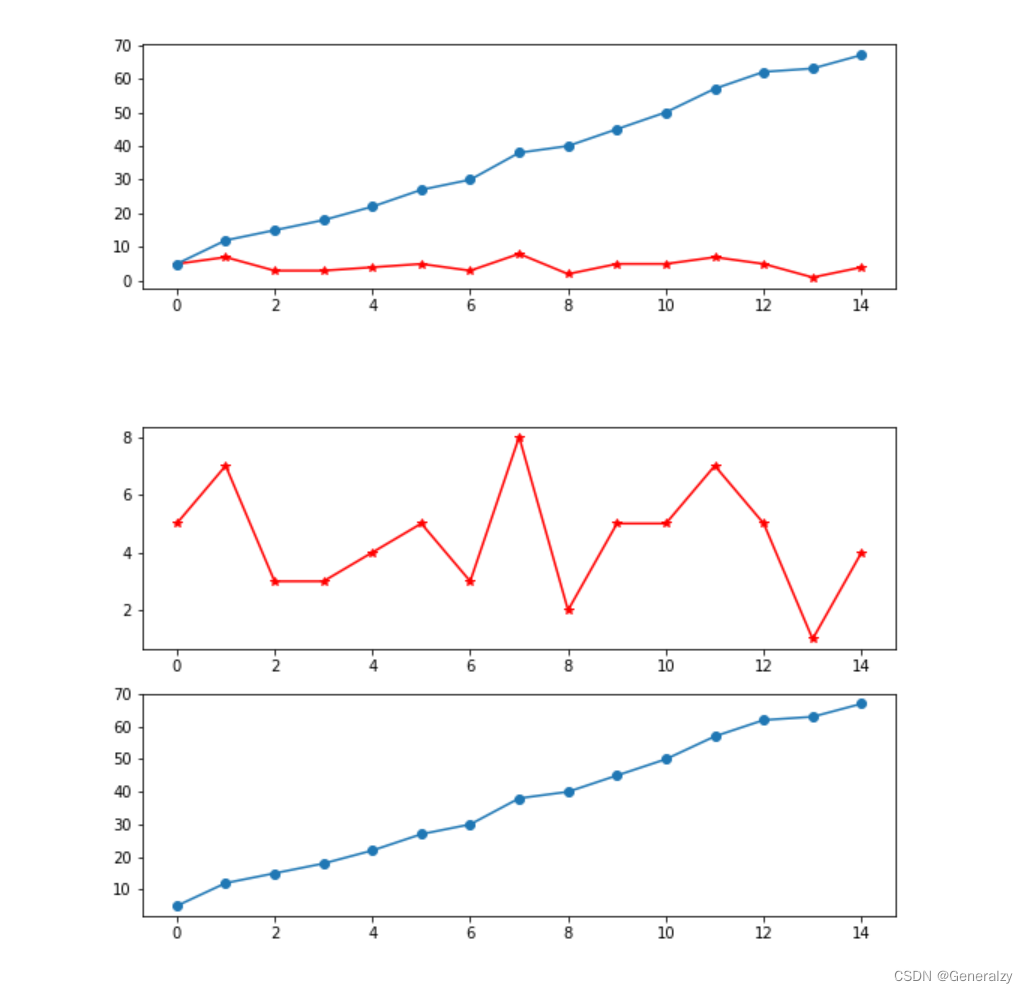
折线图
import numpy as np
import matplotlib.pyplot as plt
x = np.random.randint(0,10,size = 15)
# 一图多线
plt.figure(figsize=(9,6))
plt.plot(x,marker = '*',color = 'r')
plt.plot(x.cumsum(),marker = 'o')

# 多图布局
fig,axs = plt.subplots(2,1)
fig.set_figwidth(9)
fig.set_figheight(6)
axs[0].plot(x,marker = '*',color = 'red')
axs[1].plot(x.cumsum(),marker = 'o')
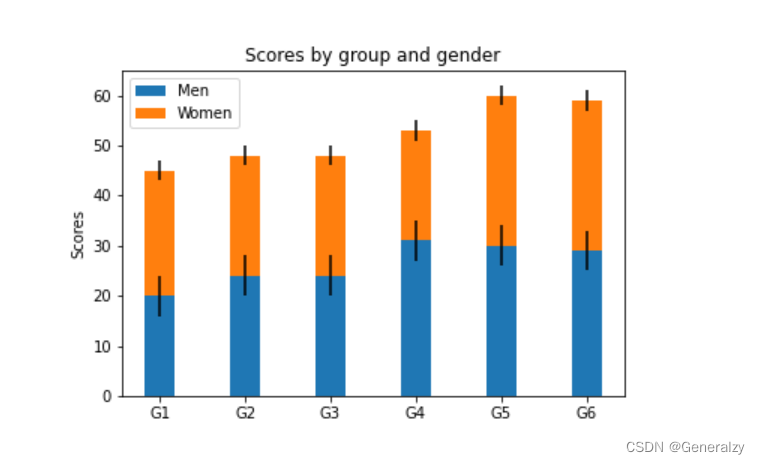
柱状图
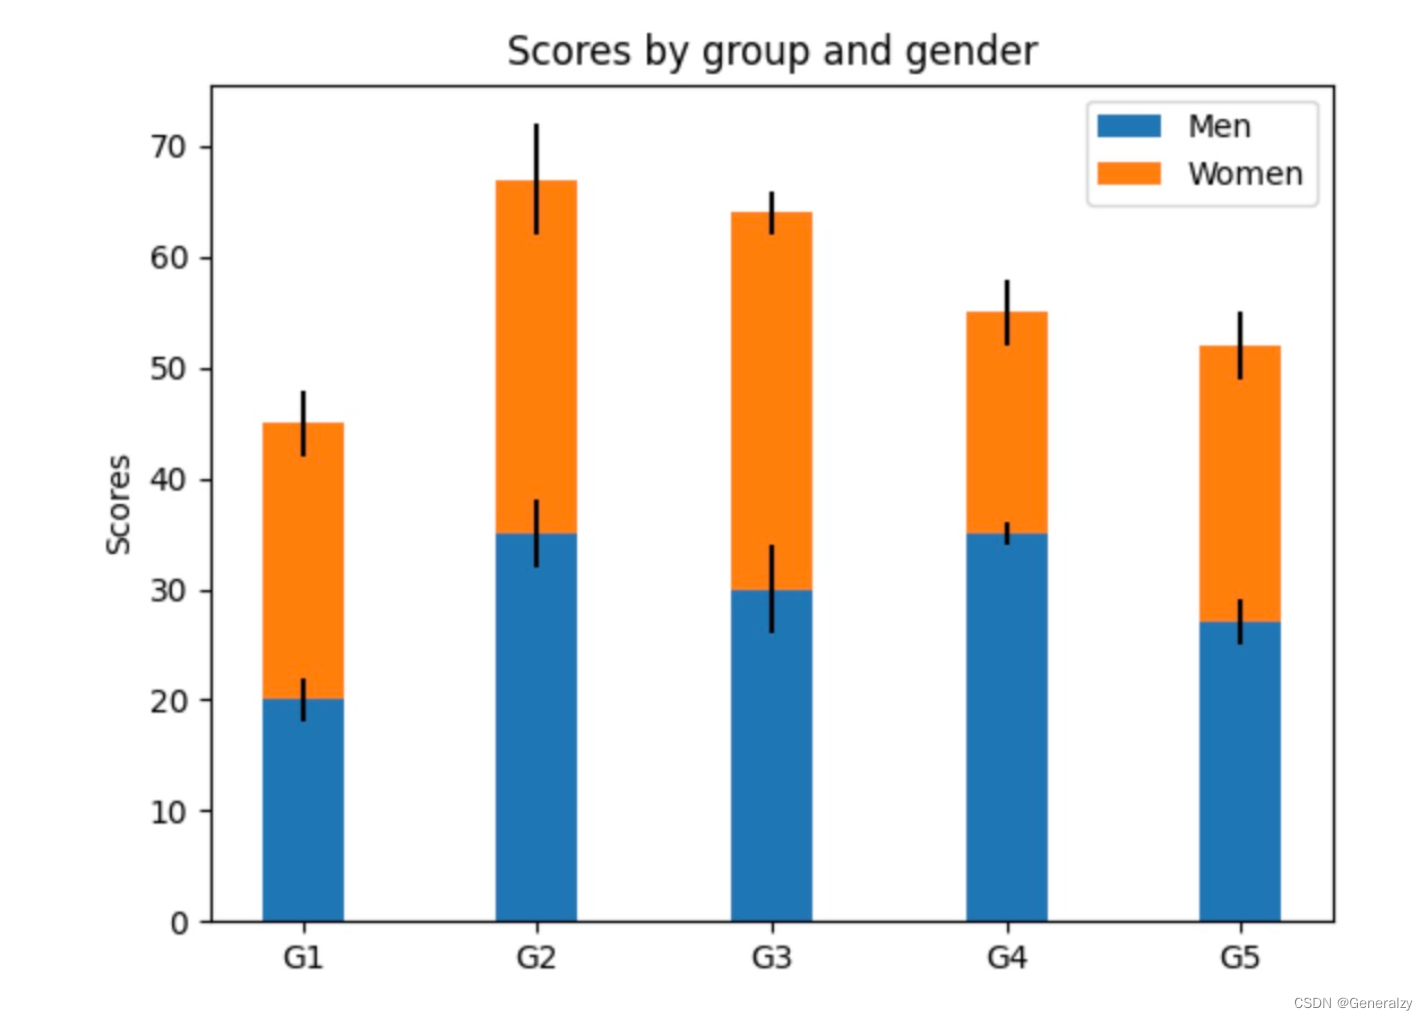
堆叠柱状图:
import numpy as np
import matplotlib.pyplot as plt
labels = ['G1', 'G2', 'G3', 'G4', 'G5','G6'] # 级别
men_means = np.random.randint(20,35,size = 6)
women_means = np.random.randint(20,35,size = 6)
men_std = np.random.randint(1,7,size = 6)
women_std = np.random.randint(1,7,size = 6)
width = 0.35
plt.bar(labels, # 横坐标
        men_means, # 柱高
        width, # 线宽
        yerr=4, # 误差条
        label='Men')#标签
plt.bar(labels, women_means, width, yerr=2, bottom=men_means,
       label='Women')
plt.ylabel('Scores')
plt.title('Scores by group and gender')
plt.legend()
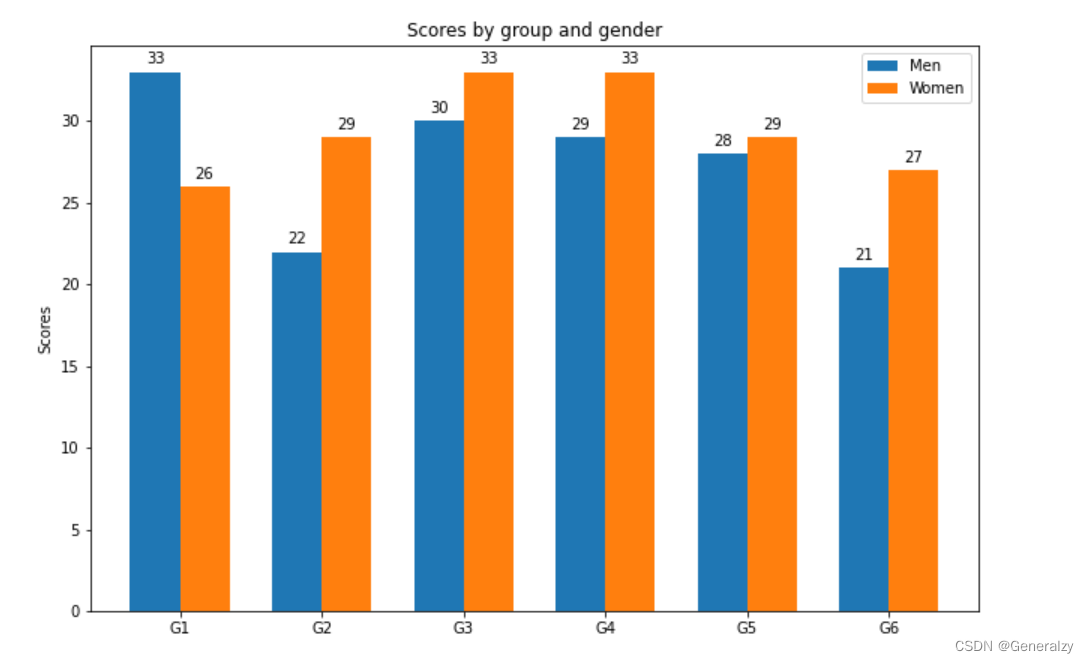
分组带标签柱状图:
import matplotlib
import matplotlib.pyplot as plt
import numpy as np

labels = ['G1', 'G2', 'G3', 'G4', 'G5','G6'] # 级别
men_means = np.random.randint(20,35,size = 6)
women_means = np.random.randint(20,35,size = 6)
x = np.arange(len(men_means))
plt.figure(figsize=(9,6))
rects1 = plt.bar(x - width/2, men_means, width) # 返回绘图区域对象
rects2 = plt.bar(x + width/2, women_means, width)

# 设置标签标题,图例
plt.ylabel('Scores')
plt.title('Scores by group and gender')
plt.xticks(x,labels)
plt.legend(['Men','Women'])

# 添加注释
def set_label(rects):
    for rect in rects:
        height = rect.get_height() # 获取高度
        plt.text(x = rect.get_x() + rect.get_width()/2, # 水平坐标
                 y = height + 0.5, # 竖直坐标
                 s = height, # 文本
                 ha = 'center') # 水平居中

set_label(rects1)
set_label(rects2)
plt.tight_layout() # 设置紧凑布局
plt.savefig('./分组带标签柱状图.png')
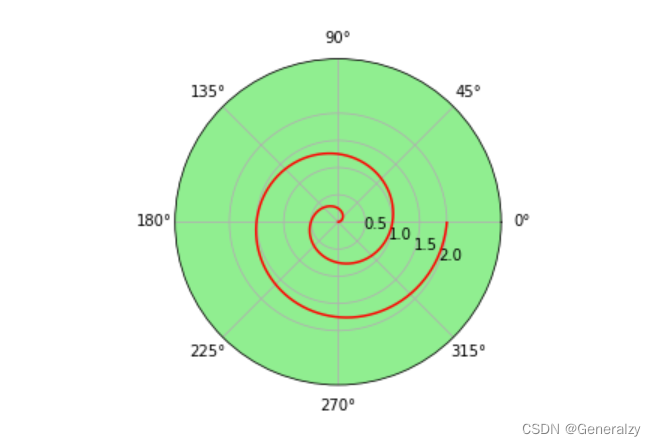
极坐标图
极坐标线形图:
import numpy as np
import matplotlib.pyplot as plt

r = np.arange(0, 4*np.pi, 0.01) # 弧度值
y = np.linspace(0,2,len(r)) # 目标值

ax = plt.subplot(111,projection = 'polar',facecolor = 'lightgreen') # 定义极坐标
ax.plot(r, y,color = 'red')
ax.set_rmax(3) # 设置半径最大值
ax.set_rticks([0.5, 1, 1.5, 2])  # 设置半径刻度
ax.set_rlabel_position(-22.5)  # 设置半径刻度位置
ax.grid(True) # 网格线

ax.set_title("A line plot on a polar axis", va='center',ha = 'center',pad = 30)
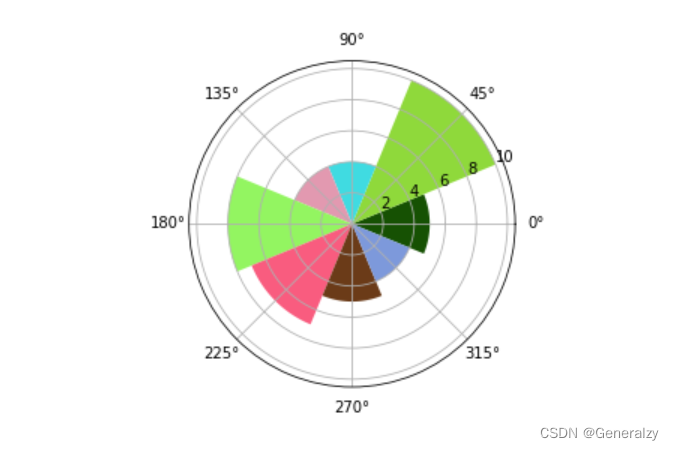
极坐标柱状图:
import numpy as np
import matplotlib.pyplot as plt
N = 8 # 分成8份
theta = np.linspace(0.0, 2 * np.pi, N, endpoint=False)
radii = np.random.randint(3,15,size = N)
width = np.pi / 4
colors = np.random.rand(8,3) # 随机生成颜色
ax = plt.subplot(111, projection='polar') # polar表示极坐标
ax.bar(theta, radii, width=width, bottom=0.0,color = colors)
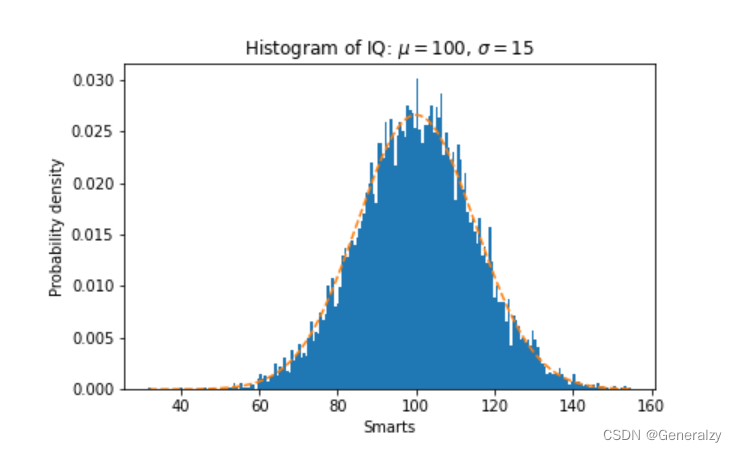
直方图
import numpy as np
import matplotlib.pyplot as plt

mu = 100 # 平均值
sigma = 15 # 标准差
x = np.random.normal(loc = mu,scale = 15,size = 10000)
fig, ax = plt.subplots()

n, bins, patches = ax.hist(x, 200, density=True) # 直方图

# 概率密度函数
y = ((1 / (np.sqrt(2 * np.pi) * sigma)) *
     np.exp(-0.5 * (1 / sigma * (bins - mu))**2))
plt.plot(bins, y, '--')
plt.xlabel('Smarts')
plt.ylabel('Probability density')
plt.title(r'Histogram of IQ: $\mu=100$, $\sigma=15$')

# 紧凑布局
fig.tight_layout()
plt.savefig('./直方图.png')
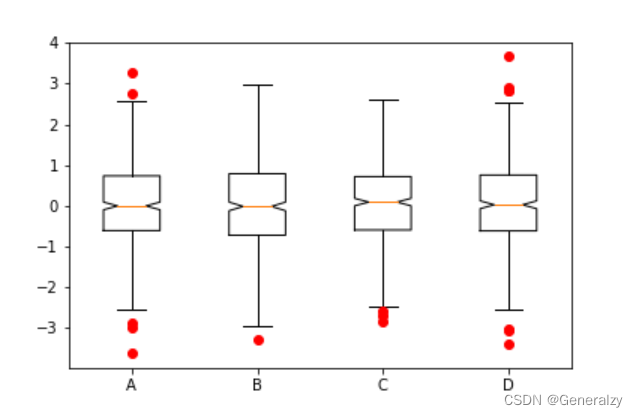
箱形图
import numpy as np
import matplotlib.pyplot as plt
data=np.random.normal(size=(500,4))
lables = ['A','B','C','D']
# 用Matplotlib画箱线图
plt.boxplot(data,1,'gD',labels=lables) # 红色的圆点是异常值
散点图
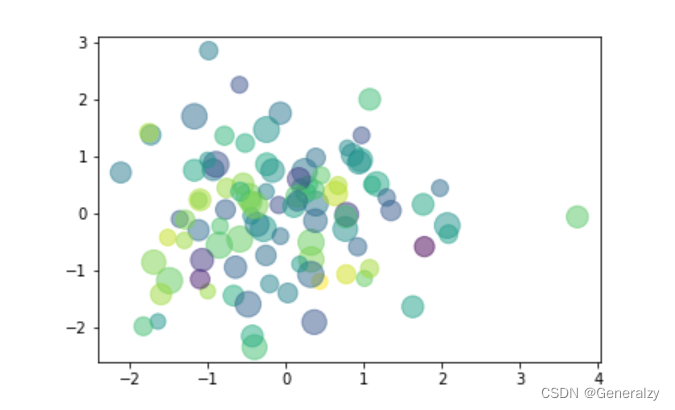
散点图的英文叫做 scatter plot,它将两个变量的值显示在二维坐标中,非常适合展示两个变量之间的关系
import numpy as np
import matplotlib.pyplot as plt
data = np.random.randn(100,2)
s = np.random.randint(100,300,size = 100)
color = np.random.randn(100)
plt.scatter(data[:,0], # 横坐标
            data[:,1], # 纵坐标
            s = s, # 尺寸
            c = color, # 颜色
            alpha = 0.5) # 透明度
饼图
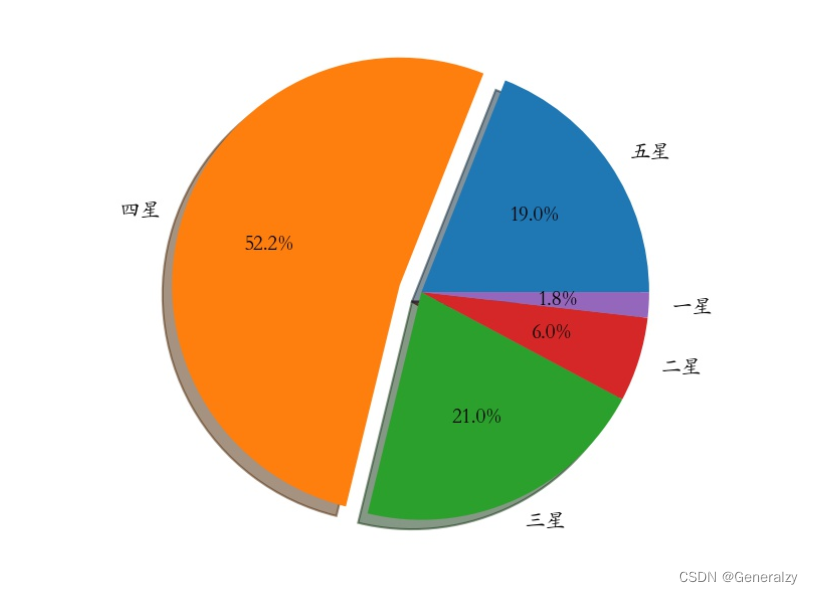
一般饼图:
import numpy as np
import matplotlib.pyplot as plt
# 解决中文字体乱码的问题
matplotlib.rcParams['font.sans-serif']='Kaiti SC'

labels =["五星","四星","三星","二星","一星"] # 标签
percent = [95,261,105,30,9] # 某市星级酒店数量

# 设置图片大小和分辨率
fig=plt.figure(figsize=(5,5), dpi=150)
# 偏移中心量,突出某一部分
explode = (0, 0.1, 0, 0, 0)
# 绘制饼图:autopct显示百分比,这里保留一位小数;shadow控制是否显示阴影
plt.pie(x = percent, # 数据
        explode=explode, # 偏移中心量
        labels=labels,  # 显示标签
        autopct='%0.1f%%', # 显示百分比
        shadow=True) # 阴影,3D效果
plt.savefig("./饼图.jpg")
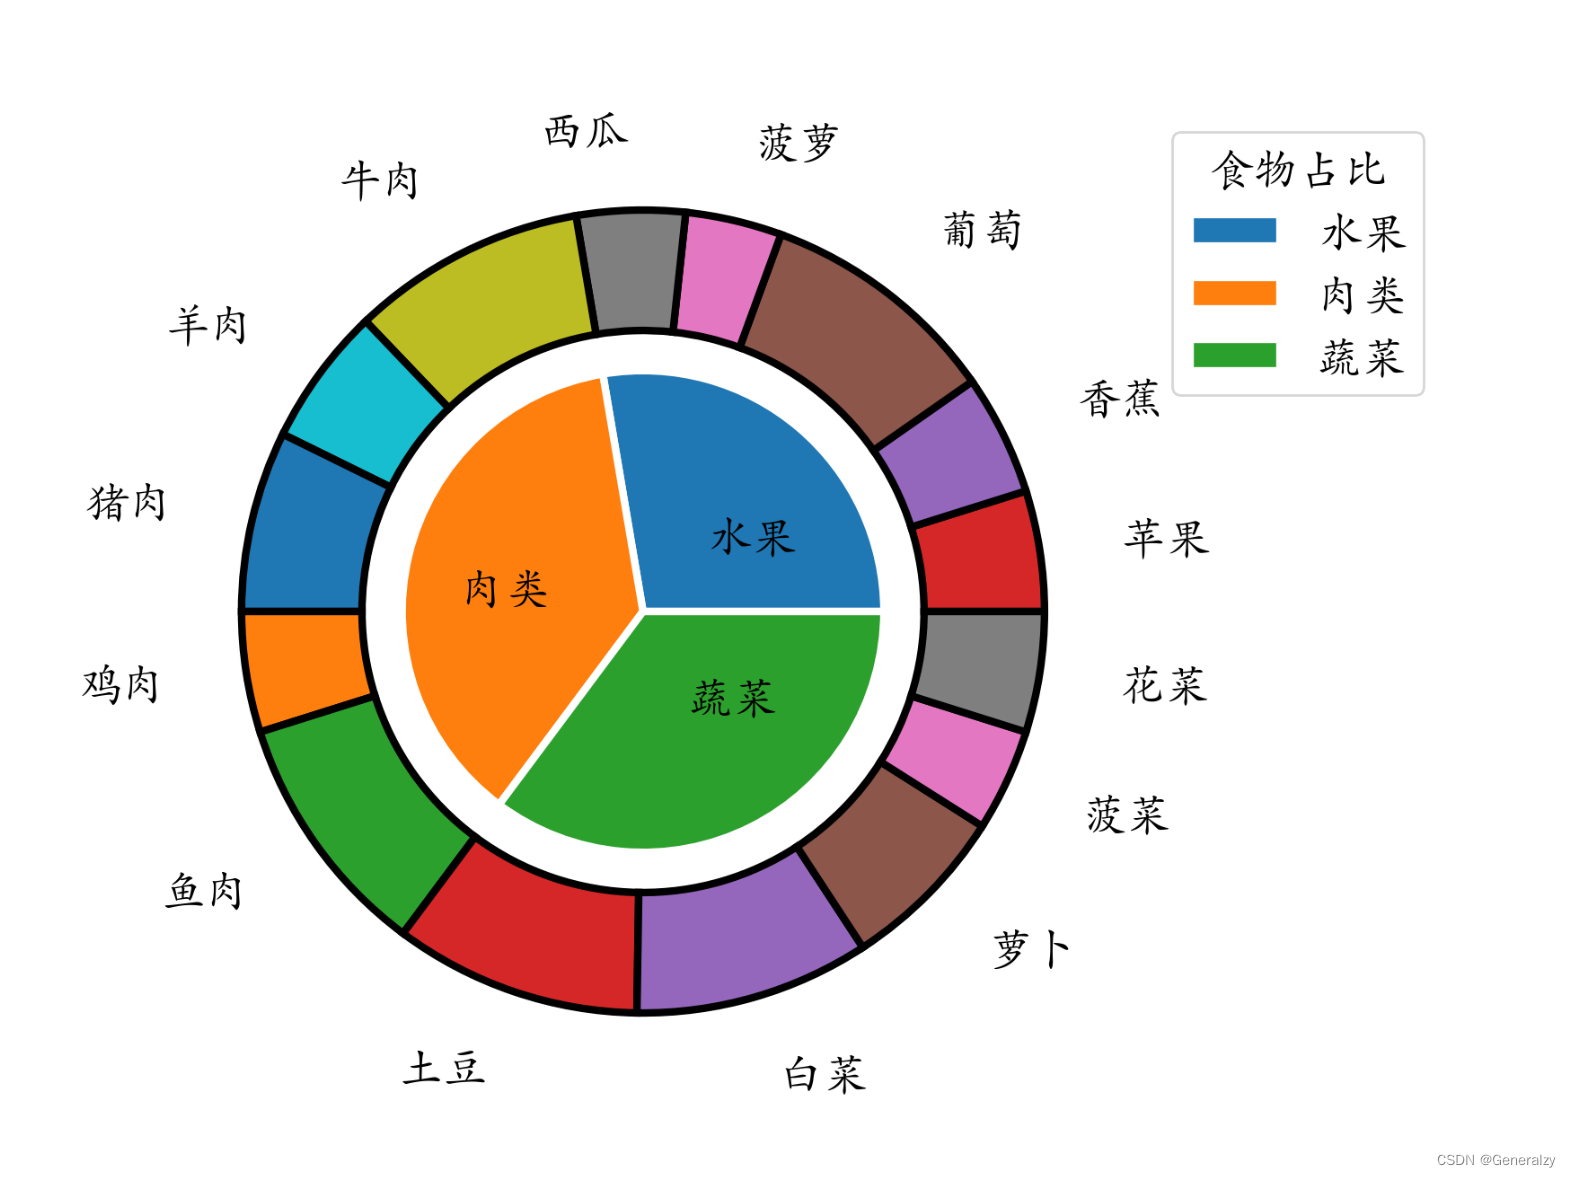
嵌套饼图:
import pandas as pd
import matplotlib.pyplot as plt
food = pd.read_excel('./food.xlsx')
# 分组聚合,内圈数据
inner = food.groupby(by = 'type')['花费'].sum()
outer = food['花费'] # 外圈数据
plt.rcParams['font.family'] = 'Kaiti SC'
plt.rcParams['font.size'] = 18
fig=plt.figure(figsize=(8,8))
# 绘制内部饼图
plt.pie(x = inner, # 数据
        radius=0.6, # 饼图半径
        wedgeprops=dict(linewidth=3,width=0.6,edgecolor='w'),# 饼图格式:间隔线宽、饼图宽度、边界颜色
        labels = inner.index, # 显示标签
        labeldistance=0.4) # 标签位置
# 绘制外部饼图
plt.pie(x = outer,
        radius=1, # 半径
        wedgeprops=dict(linewidth=3,width=0.3,edgecolor='k'),# 饼图格式:间隔线宽、饼图宽度、边界颜色
        labels = food['食材'], # 显示标签
        labeldistance=1.2) # 标签位置

# 设置图例标题,bbox_to_anchor = (x, y, width, height)控制图例显示位置
plt.legend(inner.index,bbox_to_anchor = (0.9,0.6,0.4,0.4),title = '食物占比')
plt.tight_layout()
plt.savefig('./嵌套饼图.png',dpi = 200)
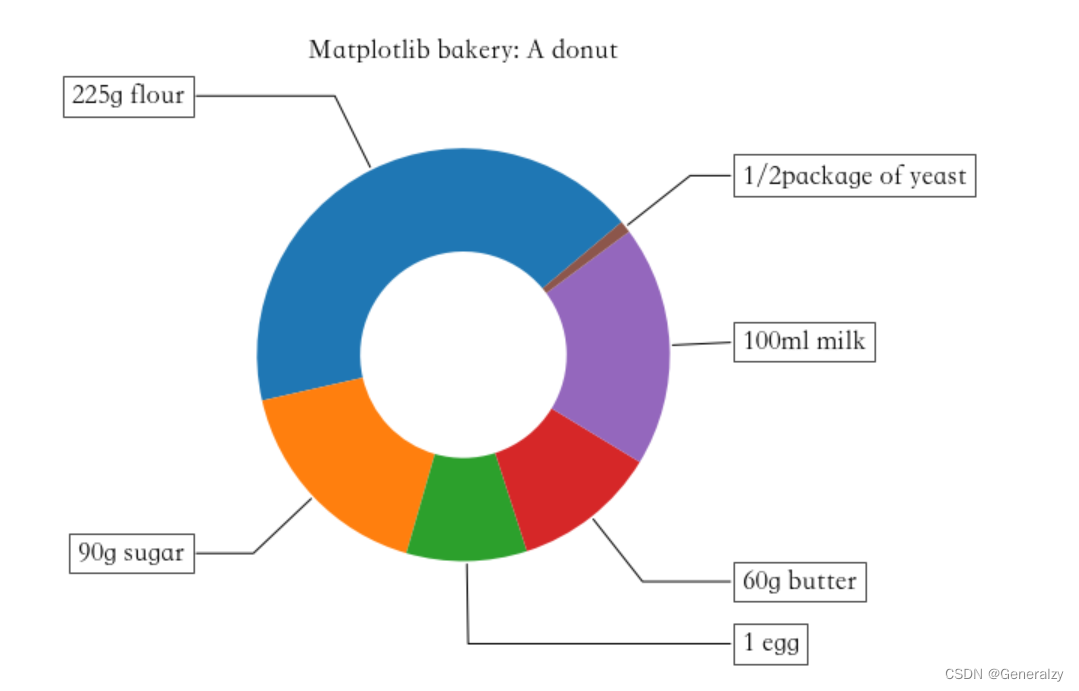
甜甜圈
import numpy as np
import matplotlib.pyplot as plt

plt.figure(figsize=(6,6))
# 甜甜圈原料
recipe = ["225g flour",
          "90g sugar",
          "1 egg",
          "60g butter",
          "100ml milk",
          "1/2package of yeast"]
# 原料比例
data = [225, 90, 50, 60, 100, 5]
wedges, texts = plt.pie(data,startangle=40)
bbox_props = dict(boxstyle="square,pad=0.3", fc="w", ec="k", lw=0.72)
kw = dict(arrowprops=dict(arrowstyle="-"),
          bbox=bbox_props,va="center")

for i, p in enumerate(wedges):
    ang = (p.theta2 - p.theta1)/2. + p.theta1 # 角度计算
    # 角度转弧度----->弧度转坐标
    y = np.sin(np.deg2rad(ang))
    x = np.cos(np.deg2rad(ang))
    ha = {-1: "right", 1: "left"}[int(np.sign(x))] # 水平对齐方式
    connectionstyle = "angle,angleA=0,angleB={}".format(ang) # 箭头连接样式
    kw["arrowprops"].update({"connectionstyle": connectionstyle}) # 更新箭头连接方式
    plt.annotate(recipe[i], xy=(x, y), xytext=(1.35*np.sign(x), 1.4*y),
                 ha=ha,**kw,fontsize = 18,weight = 'bold')
plt.title("Matplotlib bakery: A donut",fontsize = 18,pad = 25)
plt.tight_layout()
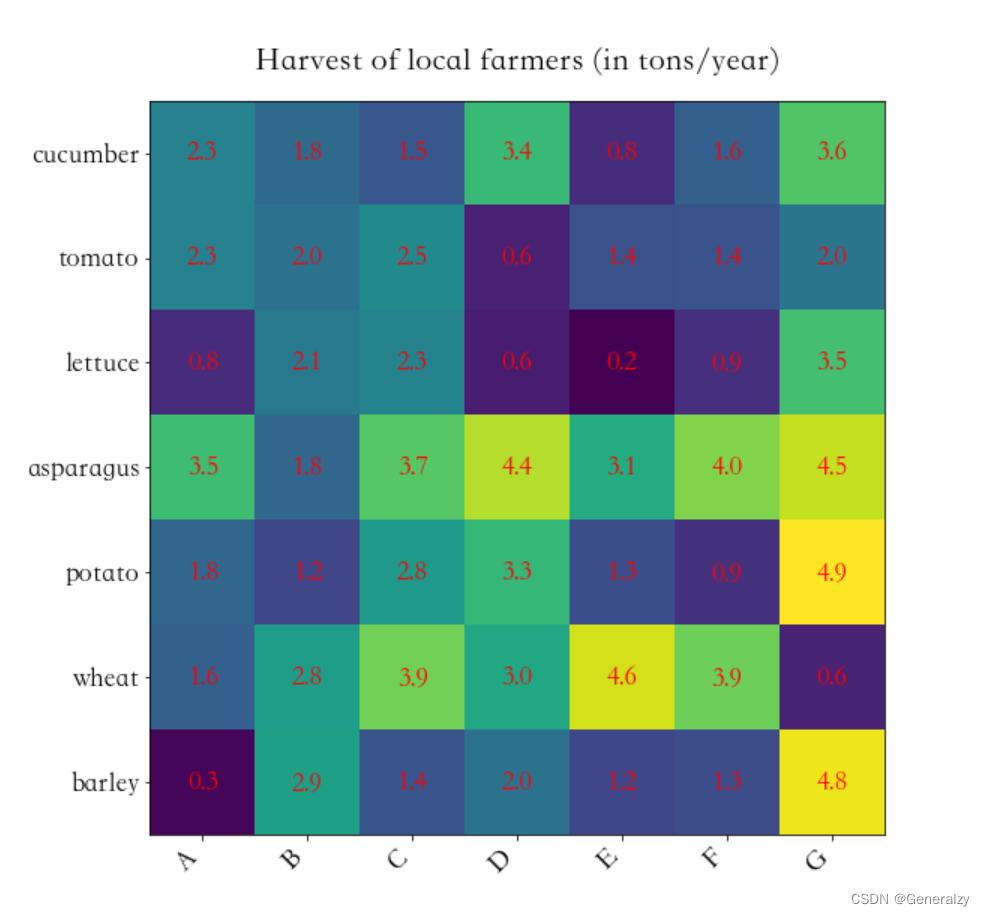
热力图
import numpy as np
import matplotlib
import matplotlib.pyplot as plt

vegetables = ["cucumber", "tomato", "lettuce", "asparagus","potato", "wheat", "barley"]
farmers = list('ABCDEFG')

harvest = np.random.rand(7,7)*5 # 农民丰收数据

plt.rcParams['font.size'] = 18
plt.rcParams['font.weight'] = 'heavy'
plt.figure(figsize=(9,9))
im = plt.imshow(harvest)

plt.xticks(np.arange(len(farmers)),farmers,rotation = 45,ha = 'right')
plt.yticks(np.arange(len(vegetables)),vegetables)

# 绘制文本
for i in range(len(vegetables)):
    for j in range(len(farmers)):
        text = plt.text(j, i, round(harvest[i, j],1),
                       ha="center", va="center", color='r')
plt.title("Harvest of local farmers (in tons/year)",pad = 20)
fig.tight_layout()
plt.savefig('./热力图.png')
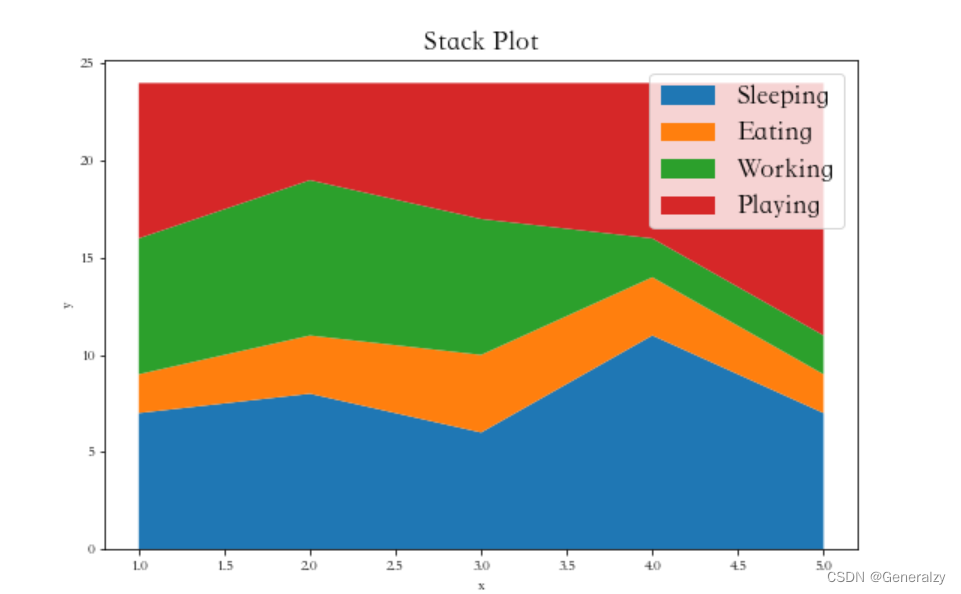
面积图
import matplotlib.pyplot as plt
plt.figure(figsize=(9,6))
days = [1,2,3,4,5]
sleeping =[7,8,6,11,7]
eating = [2,3,4,3,2]
working =[7,8,7,2,2]
playing = [8,5,7,8,13]
plt.stackplot(days,sleeping,eating,working,playing)
plt.xlabel('x')
plt.ylabel('y')
plt.title('Stack Plot',fontsize = 18)
plt.legend(['Sleeping','Eating','Working','Playing'],fontsize = 18)
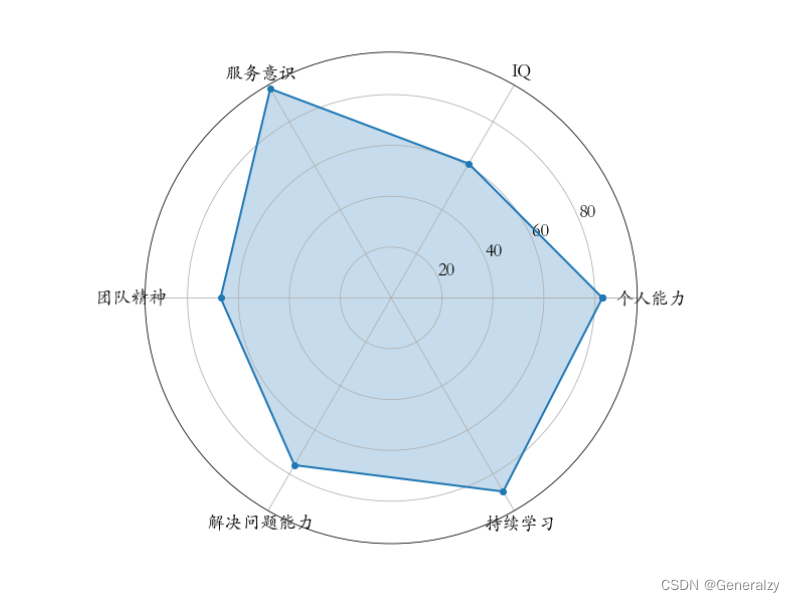
蜘蛛图
import numpy as np
import matplotlib.pyplot as plt
plt.rcParams['font.family'] = 'Kaiti SC'
labels=np.array(["个人能力","IQ","服务意识","团队精神","解决问题能力","持续学习"])
stats=[83, 61, 95, 67, 76, 88]
# 画图数据准备,角度、状态值
angles=np.linspace(0, 2*np.pi, len(labels), endpoint=False)
stats=np.concatenate((stats,[stats[0]]))
angles=np.concatenate((angles,[angles[0]]))
# 用Matplotlib画蜘蛛图
fig = plt.figure(figsize=(9,9))
ax = fig.add_subplot(111, polar=True)
ax.plot(angles, stats, 'o-', linewidth=2) # 连线
ax.fill(angles, stats, alpha=0.25) # 填充
# 设置角度
ax.set_thetagrids(angles*180/np.pi,#角度值
                  labels,
                  fontsize = 18)
ax.set_rgrids([20,40,60,80],fontsize = 18)
3D图形
三维折线图散点图
import numpy as np
import matplotlib.pyplot as plt
from mpl_toolkits.mplot3d.axes3d import Axes3D # 3D引擎

x = np.linspace(0,60,300)
y = np.sin(x)
z = np.cos(x)

fig = plt.figure(figsize=(9,6)) # 二维图形
ax3 = Axes3D(fig) # 二维变成了三维
ax3.plot(x,y,z) # 3维折线图
# 3维散点图
ax3.scatter(np.random.rand(50)*60,np.random.rand(50),np.random.rand(50),
            color = 'red',s = 100)
三维柱状图
import numpy as np
import matplotlib.pyplot as plt
from mpl_toolkits.mplot3d.axes3d import Axes3D # 3D引擎
month = np.arange(1,5)
# 每个月 4周 每周都会产生数据
# 三个维度:月、周、销量
fig = plt.figure(figsize=(9,6))
ax3 = Axes3D(fig)

for m in month:
    ax3.bar(np.arange(4),
            np.random.randint(1,10,size = 4),
            zs = m ,
            zdir = 'x',# 在哪个方向上,一排排排列
            alpha = 0.7,# alpha 透明度
            width = 0.5)
ax3.set_xlabel('X',fontsize = 18,color = 'red')
ax3.set_ylabel('Y',fontsize = 18,color = 'red')
ax3.set_zlabel('Z',fontsize = 18,color = 'green')
实战-数据分析师招聘数据分析
颜色代码对应表:https://www.cnblogs.com/doudou618/p/4455585.html
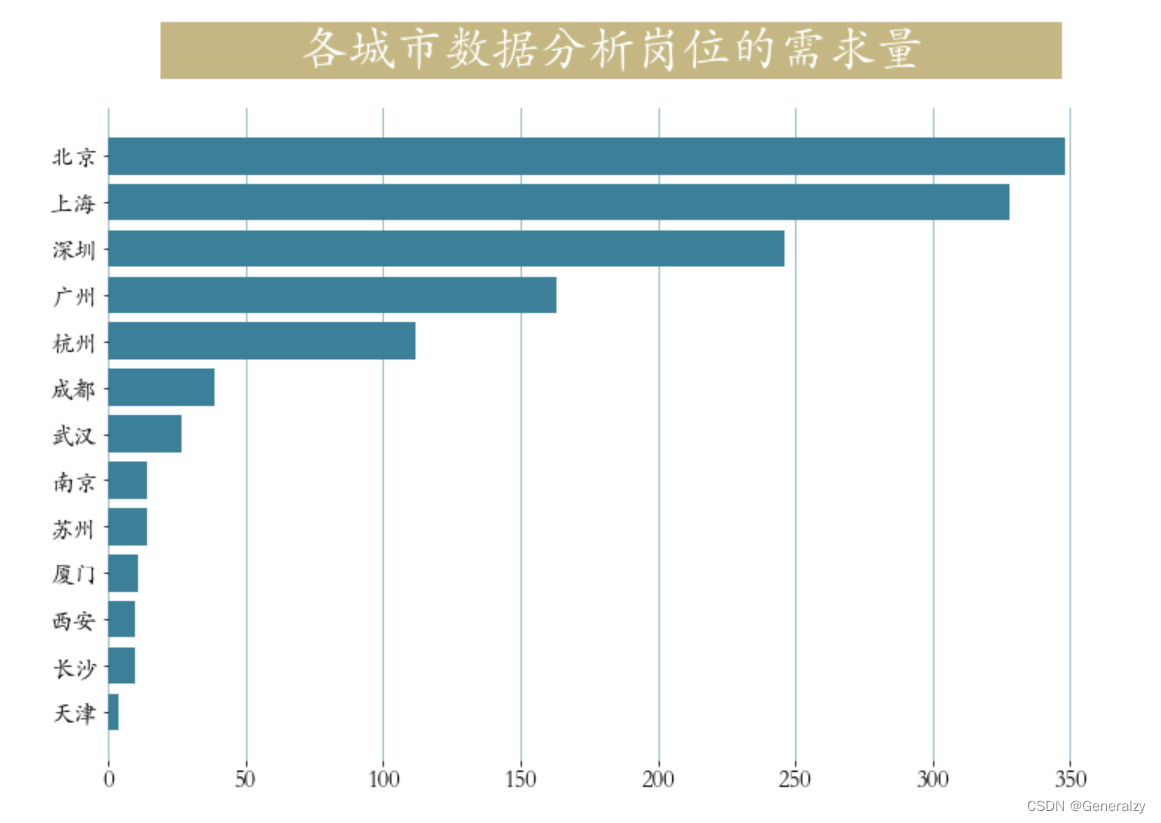
各城市对数据分析岗位的需求量
两种常用颜色:浅蓝色: #3c7f99 ,淡黄色:#c5b783
plt.figure(figsize=(12,9))
cities = job['city'].value_counts() # 统计城市工作数量
plt.barh(y = cities.index[::-1],
        width = cities.values[::-1],
        color = '#3c7f99')
plt.box(False) # 不显示边框
plt.title(label='           各城市数据分析岗位的需求量           ',
          fontsize=32, weight='bold', color='white',
          backgroundcolor='#c5b783',pad = 30 )
plt.tick_params(labelsize = 16)
plt.grid(axis = 'x',linewidth = 0.5,color = '#3c7f99')
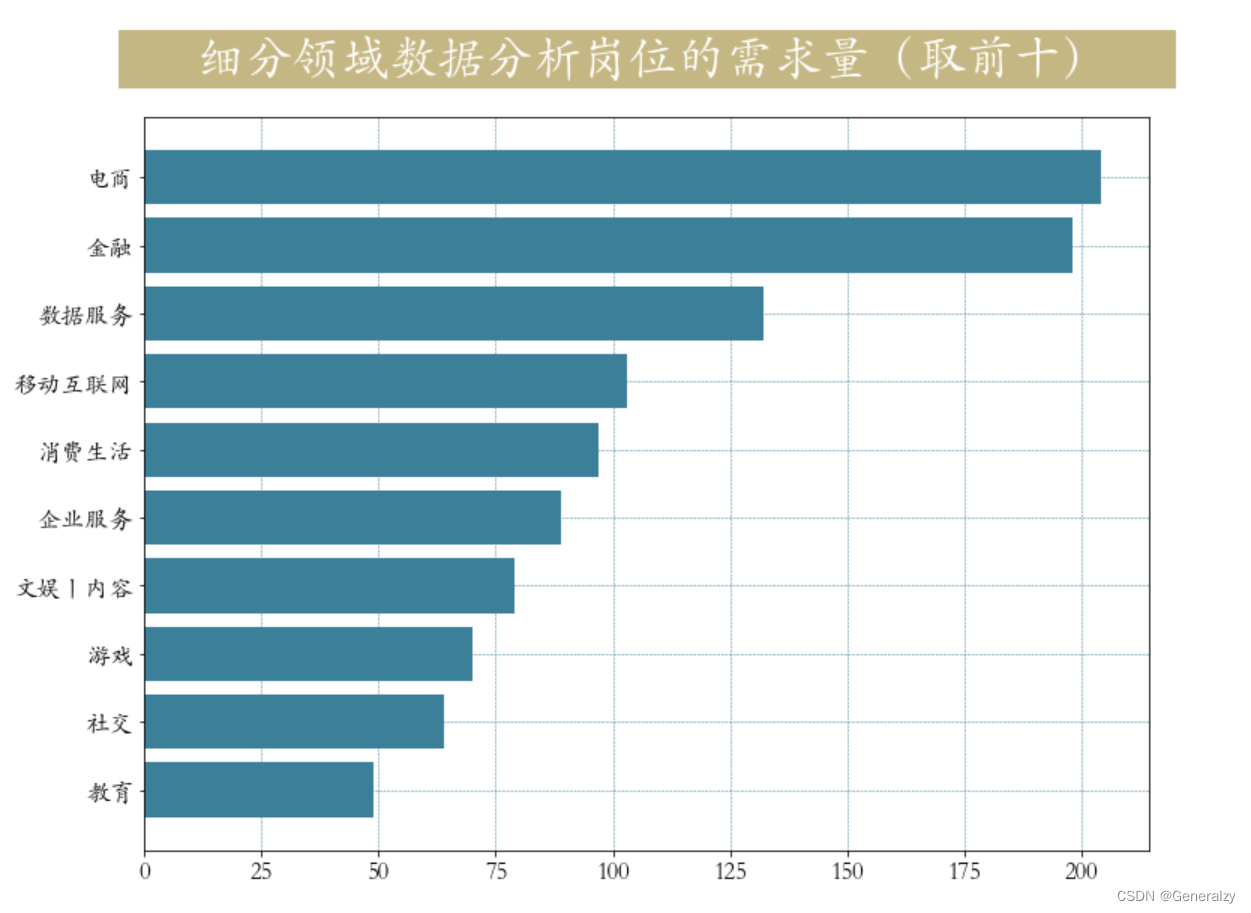
不同领域对数据分析岗的需求量
# 获取需求量前10多的领域
industry_index = job["industryField"].value_counts()[:10].index
industry =job.loc[job["industryField"].isin(industry_index),"industryField"]
plt.figure(figsize=(12,9))
plt.barh(y = industry_index[::-1],
         width=pd.Series.value_counts(industry.values).values[::-1],
         color = '#3c7f99')
plt.title(label='      细分领域数据分析岗位的需求量(取前十)     ',
          fontsize=32, weight='bold', color='white',
          backgroundcolor='#c5b783',ha = 'center',pad = 30)
plt.tick_params(labelsize=16)
plt.grid(lw = 0.5,color = '#3c7f99',ls = '--')
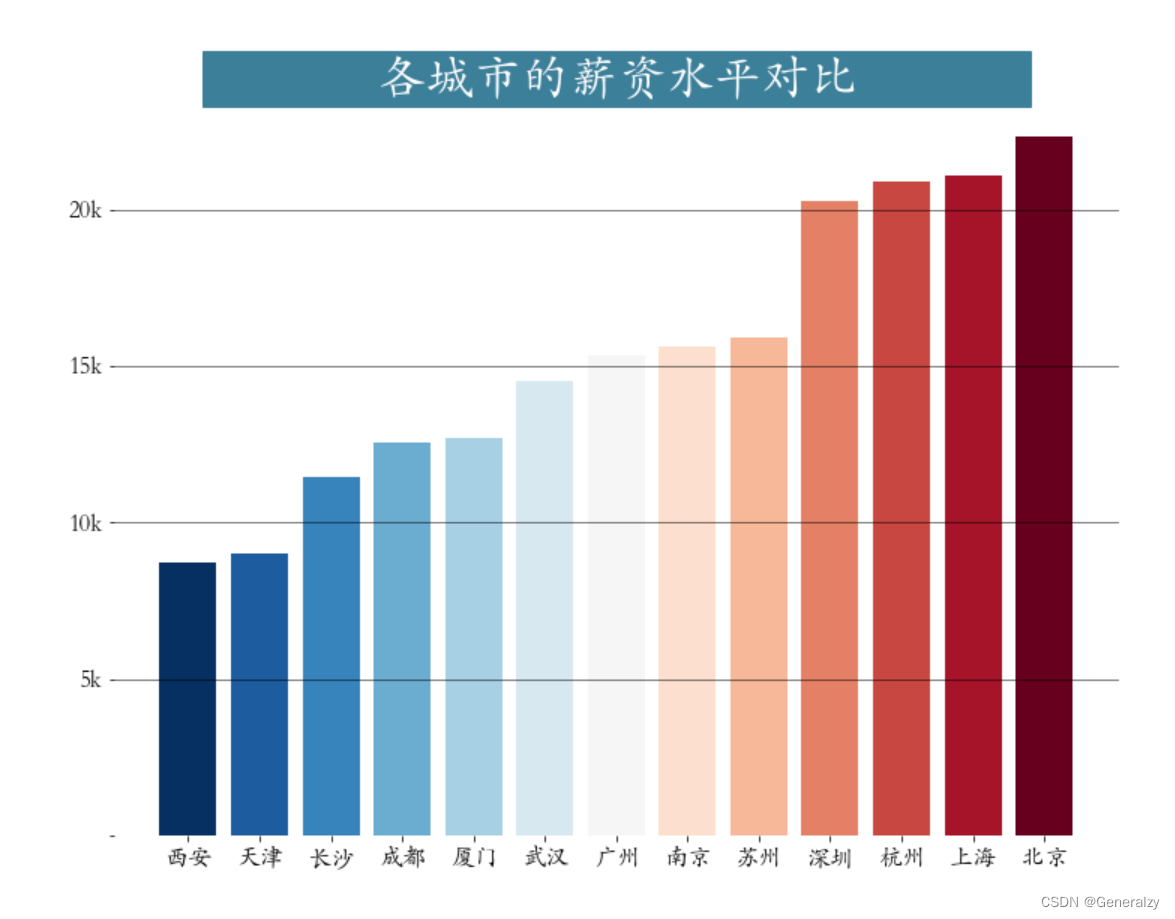
各城市薪资状况
plt.figure(figsize=(12,9))
city_salary = job.groupby("city")["salary"].mean().sort_values() # 分组聚合运算
plt.bar(x = city_salary.index,height = city_salary.values,
       color = plt.cm.RdBu_r(np.linspace(0,1,len(city_salary))))
plt.title(label='              各城市的薪资水平对比              ',
         fontsize=32, weight='bold', color='white', backgroundcolor='#3c7f99')
plt.tick_params(labelsize=16)
plt.grid(axis = 'y',linewidth = 0.5,color = 'black')
plt.yticks(ticks = np.arange(0,25,step = 5,),labels = ['','5k','10k','15k','20k'])
plt.box(False) # 去掉边框
plt.savefig('./各城市薪资状况.png')
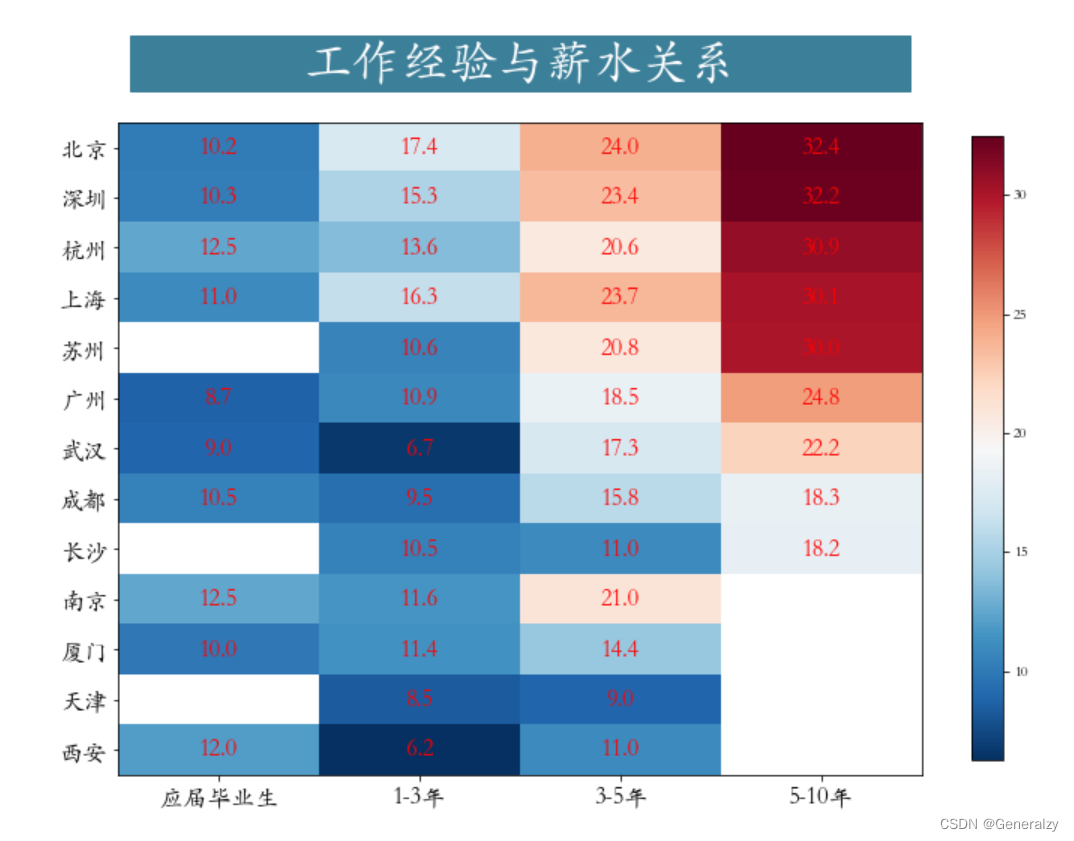
工作经验与薪水关系
work_salary = job.pivot_table(index="city",columns="workYear",values="salary") # 透视表
work_salary = work_salary[["应届毕业生","1-3年","3-5年","5-10年"]]\
              .sort_values(by = '5-10年',ascending = False) # 筛选一部分工作经验
data = work_salary.values
data = np.repeat(data,4,axis = 1) # 重复4次,目的画图,美观,图片宽度拉大
plt.figure(figsize=(12,9))
plt.imshow(data,cmap='RdBu_r')
plt.yticks(np.arange(13),work_salary.index)
plt.xticks(np.array([1.5,5.5,9.5,13.5]),work_salary.columns)
# 绘制文本
h,w = data.shape
for x in range(w):
    for y in range(h):
        if (x%4 == 0) and (~np.isnan(data[y,x])):
            text = plt.text(x + 1.5, y, round(data[y,x],1),
                           ha="center", va="center", color='r',fontsize = 16)
plt.colorbar(shrink = 0.85)
plt.tick_params(labelsize = 16)
plt.savefig('./工作经验与薪水关系.png')
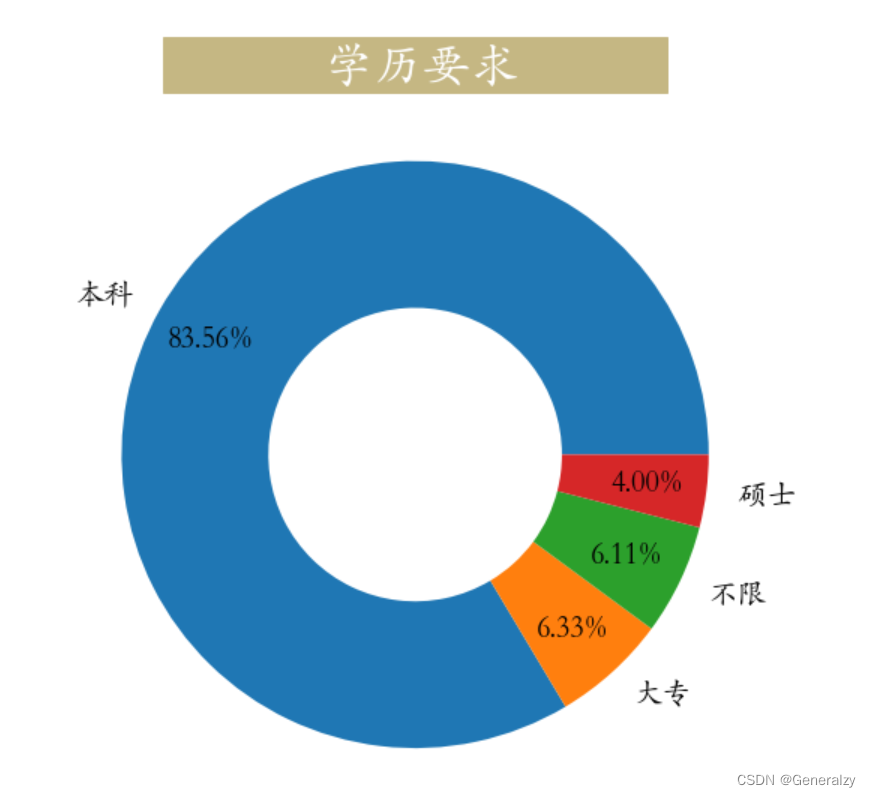
学历要求
education = job["education"].value_counts(normalize=True)
plt.figure(figsize=(9,9))
_ = plt.pie(education,labels=education.index,autopct='%0.2f%%',
            wedgeprops=dict(linewidth=3,width = 0.5),pctdistance=0.8,
            textprops = dict(fontsize = 20))
_ = plt.title(label='             学历要求            ',
          fontsize=32, weight='bold',
          color='white', backgroundcolor='#c5b783')
plt.savefig('./学历要求.png')
技能要求
def get_level(x):
    if x["Python/R"] == 1:
        x["skill"] = "Python/R"
    elif x["SQL"] == 1:
        x["skill"] = "SQL"
    elif x["Excel"] == 1:
        x["skill"] = "Excel"
    elif x['SPSS/SAS'] == 1:
        x['skill'] = 'SPSS/SAS'
    else:
        x["skill"] = "其他"
    return x
job = job.apply(get_level,axis=1) # 数据转换

# 获取主要技能
x = job.loc[job.skill!='其他'][['salary','skill']]
cond1 = x['skill'] == 'Python/R'
cond2 = x['skill'] =='SQL'
cond3 = x['skill'] == 'Excel'
cond4 = x['skill'] == 'SPSS/SAS'

plt.figure(figsize=(12,8))
plt.title(label='             不同技能的薪资水平对比            ',
          fontsize=32, weight='bold', color='white',
          backgroundcolor='#c5b783',pad = 30)
plt.boxplot(x = [job.loc[job.skill!='其他']['salary'][cond1],
                job.loc[job.skill!='其他']['salary'][cond2],
                job.loc[job.skill!='其他']['salary'][cond3],
                job.loc[job.skill!='其他']['salary'][cond4]],
           vert = False,labels = ["Python/R","SQL","Excel",'SPSS/SAS'])
plt.tick_params(axis="both",labelsize=16)
plt.grid(axis = 'x',linewidth = 0.75)
plt.xticks(np.arange(0,61,10), [str(i)+"k" for i in range(0,61,10)])
plt.box(False)
plt.xlabel('工资', fontsize=18)
plt.ylabel('技能', fontsize=18)
plt.savefig('./技能要求.png')
大公司对技能要求
colors = [‘#ff0000’, ‘#ffa500’, ‘#c5b783’, ‘#3c7f99’, ‘#0000cd’]
skill_count = job[job['companySize'] == '2000人以上'][['Python','SQL','Tableau','Excel','SPSS/SAS']].sum()
plt.figure(figsize=(9,6))
plt.bar(np.arange(5),skill_count,
        tick_label = ['Python/R','SQL','Tableau','Excel','SPSS/SAS'],
        width = 0.5,
        color = plt.cm.RdBu_r(skill_count/skill_count.max()))
_ = plt.title(label='             大公司对技能的要求         ',
          fontsize=32, weight='bold', color='white',
          backgroundcolor='#c5b783',pad = 30)
plt.tick_params(labelsize=16,)
plt.grid(axis = 'y')
plt.box(False)
plt.savefig('./大公司技能要求.png')
不同规模的公司在招人要求上的差异
from matplotlib import gridspec
workYear_map = {
    "5-10年": 5,
    "3-5年": 4,
    "1-3年": 3,
    "1年以下": 2,
    "应届毕业生": 1}
color_map = {
    5:"#ff0000",
    4:"#ffa500",
    3:"#c5b783",
    2:"#3c7f99",
    1:"#0000cd"}
cond = job.workYear.isin(workYear_map)
job = job[cond]
job['workYear'] = job.workYear.map(workYear_map)
# 根据companySize进行排序,人数从多到少
job['companySize'] = job['companySize'].astype('category')
list_custom = ['2000人以上', '500-2000人','150-500人','50-150人','15-50人','少于15人']
job['companySize'].cat.reorder_categories(list_custom, inplace=True)
job.sort_values(by = 'companySize',inplace = True,ascending = False)

plt.figure(figsize=(12,11))
gs = gridspec.GridSpec(10,1)
plt.subplot(gs[:8])
plt.suptitle(t='            不同规模公司的用人需求差异          ',
         fontsize=32,
         weight='bold', color='white', backgroundcolor='#3c7f99')
plt.scatter(job.salary,job.companySize,
            c = job.workYear.map(color_map),
            s = (job.workYear*100),alpha = 0.35)
plt.scatter(job.salary,job.companySize,
            c = job.workYear.map(color_map))
plt.grid(axis = 'x')
plt.xticks(np.arange(0,161,10), [str(i)+"k" for i in range(0,161,10)])
plt.xlabel('工资', fontsize=18)
plt.box(False)
plt.tick_params(labelsize = 18)

# 绘制底部标记
plt.subplot(gs[9:])
x = np.arange(5)[::-1]
y = np.zeros(len(x))
s = x*100
plt.scatter(x,y,s=s,c=color_map.values(),alpha=0.3)
plt.scatter(x,y,c=color_map.values())
plt.box(False)
plt.xticks(ticks=x,labels=list(workYear_map.keys()),fontsize=14)
plt.yticks(np.arange(1),labels=['  经验:'],fontsize=18)
plt.savefig('./不同规模公司招聘薪资工作经验差异.png')


