SVD奇异式分解
SVD是将一个
m
×
n
m\times n
m×n的矩阵分解成三个矩阵的乘积
即
A
=
U
Σ
V
T
A = U\Sigma V^T
A=UΣVT
其中
U
,
V
U,V
U,V分别为
m
×
m
,
n
×
n
n
m\times m,n\times nn
m×m,n×nn的矩阵
Σ
\Sigma
Σ是一个
m
×
n
m\times n
m×n的对角矩阵
其中
U
U
U,是左奇异矩阵,为
A
A
T
AA^T
AAT的所有特征向量组成的矩阵,
V
V
V是是右奇异矩阵,为
A
T
A
A^TA
ATA的所有特征向量组成的矩阵(按照特征值从大到小排序)
那么奇异值矩阵
Σ
=
U
−
1
A
V
\Sigma = U^{-1}AV
Σ=U−1AV
对于奇异值,它跟我们特征分解中的特征值类似,在奇异值矩阵中也是按照从大到小排列,而且奇异值的减少特别的快,在很多情况下,前10%甚至1%的奇异值的和就占了全部的奇异值之和的99%以上的比例。也就是说,我们也可以用最大的k个的奇异值和对应的左右奇异向量来近似描述矩阵。也就是说:
A m × n = U m × m Σ m × n V n × n T ≈ U m × k Σ k × k V k × n T A_{m\times n} = U_{m\times m}\Sigma_{m\times n} V^T_{n\times n}\approx U_{m\times k}\Sigma_{k\times k} V^T_{k\times n} Am×n=Um×mΣm×nVn×nT≈Um×kΣk×kVk×nT
应用在图片压缩中,我们只需要保留分解出的矩阵的前k行(列)的数据,就能够大致还原出图像。
github链接
图片压缩
首先需要明白一点,那就是SVD图片压缩是有损压缩QAQ
那么我们代码思路就是:
- 载入图片,转化为数值矩阵(R,G,B三种颜色,即三个矩阵,每个像素点的值在[0,255]之间)
- 对矩阵进行奇异式分解
- 删除矩阵后面一些行(列),即实现图片压缩
- 再把删除数据后的矩阵重新相乘,还原图片
- 计算压缩率,还原程度
import numpy as np
from PIL import Image
import matplotlib.pyplot as plt
import pylab

def loadImage(filename): # 1. 载入图片
    image = Image.open(filename)
    return np.array(image)

def svd(A):
    return np.linalg.svd(A)

def reBuildSVD(U, S, V):
    r = len(S)
    return np.dot(U[:,:r] * S, V[:r,:])

def setZero(U, S, V, k): # 把3.部分数据清除
    r = len(S)
    for i in range(k, r):
        U[:, i] = 0
        S[i] = 0
        V[i, :] = 0
    return U, S, V

def totalVariation(S, k): # 计算剩余的数据的比例
    return np.sum(S[:k]) / np.sum(S)

def imageProcess(img, k):
    img2 = np.zeros_like(img) # 构建相同的0矩阵
    tv = 1.0
    for c in range(img.shape[2]): #shape[0]图片高度,shape[1]图片宽度,shape[2]图片通道数(彩色图片是3,即R,G,B)
        A = img[:, :, c]
        U, S, V = svd(A) #2 奇异式分解
        tv *= totalVariation(S, k)
        U, S, V = setZero(U, S, V, k)
        img2[:, :, c] = reBuildSVD(U, S, V)
    return img2, tv

def Ratio(A, k): #压缩率
    den = A.shape[0] * A.shape[1] * A.shape[2]
    nom = (A.shape[0] * k + k * A.shape[1] + k) * A.shape[2]
    return 1 - nom/den


filname = "./miku.jpg"
miku = loadImage(filname)

plt.figure(figsize=(20, 10))

## 分别放原图,然后从压缩率高往低
#1
plt.subplot(2, 2, 1)
plt.imshow(miku)
plt.title("origin")


# 2
plt.subplot(2, 2, 2)
img, var = imageProcess(miku, 4 ** 2)
ratio = Ratio(miku, 4 ** 1)
plt.imshow(img)
plt.title('{:.2%} / {:.2%}'.format(var, ratio))

# 3
plt.subplot(2, 2, 3)
img, var = imageProcess(miku, 4 ** 3)
ratio = Ratio(miku, 4 ** 3)
plt.imshow(img)
plt.title('{:.2%} / {:.2%}'.format(var, ratio))


# 4
plt.subplot(2, 2, 4)
img, var = imageProcess(miku, 4 ** 4)
ratio = Ratio(miku, 4 ** 4)
plt.imshow(img)
plt.title('{:.2%} / {:.2%}'.format(var, ratio))

pylab.show()
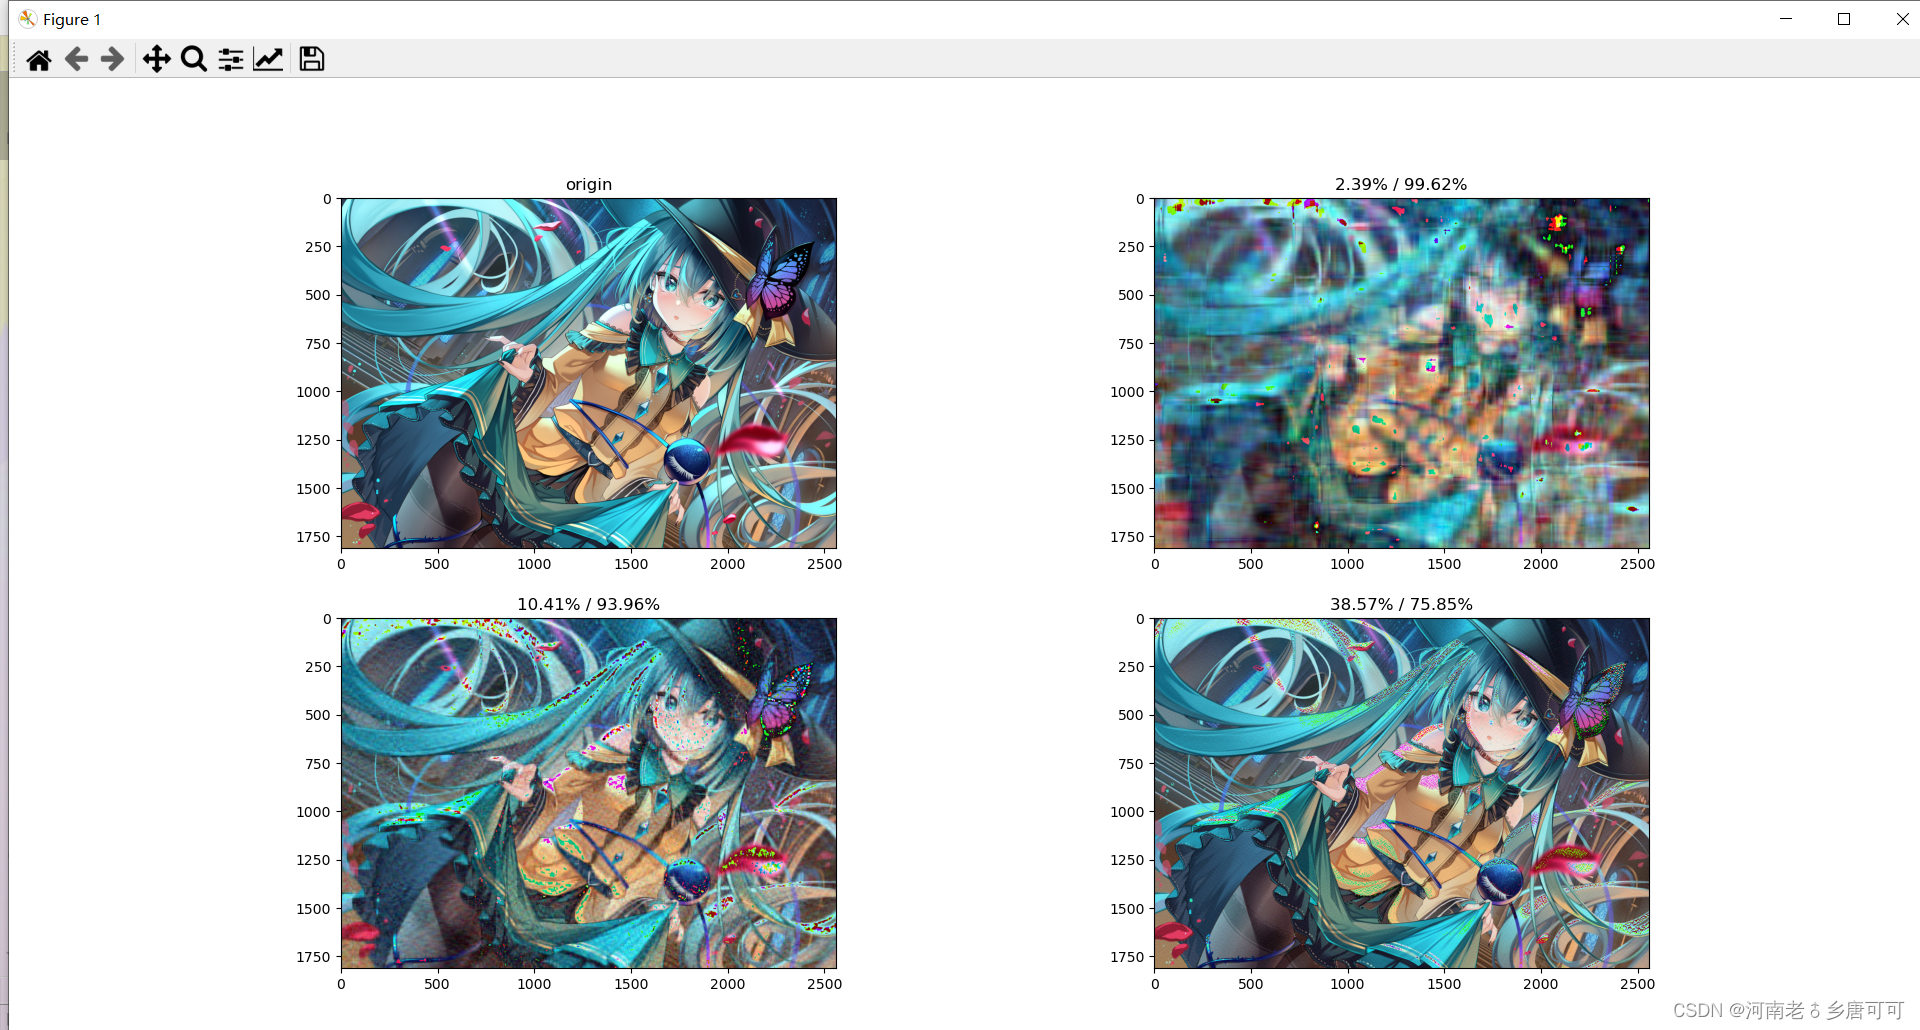
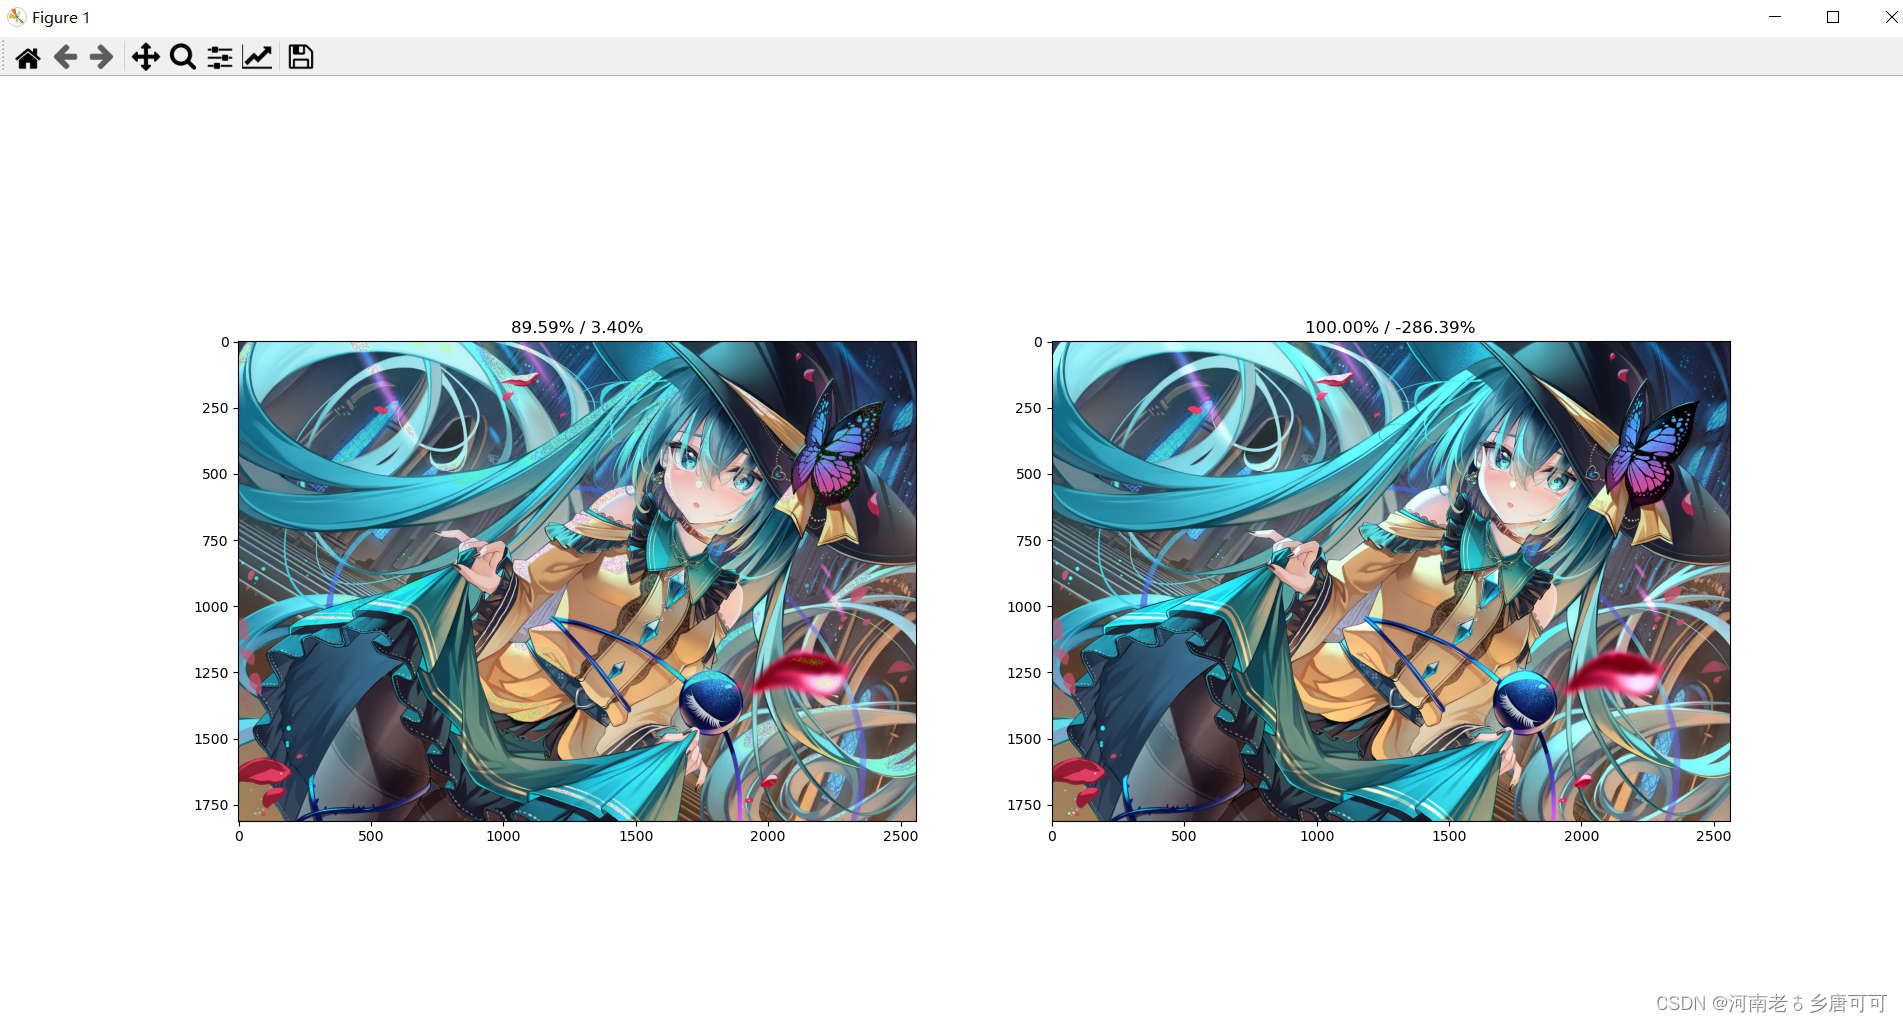
效果
发现压缩率低于
90
90
90%的时候,就能大致还原出图像了
但是想要清晰还原,代价就很大了。甚至还有负压缩(毕竟分解成了三个矩阵)
对二刺螈图片还是别用有损压缩了


