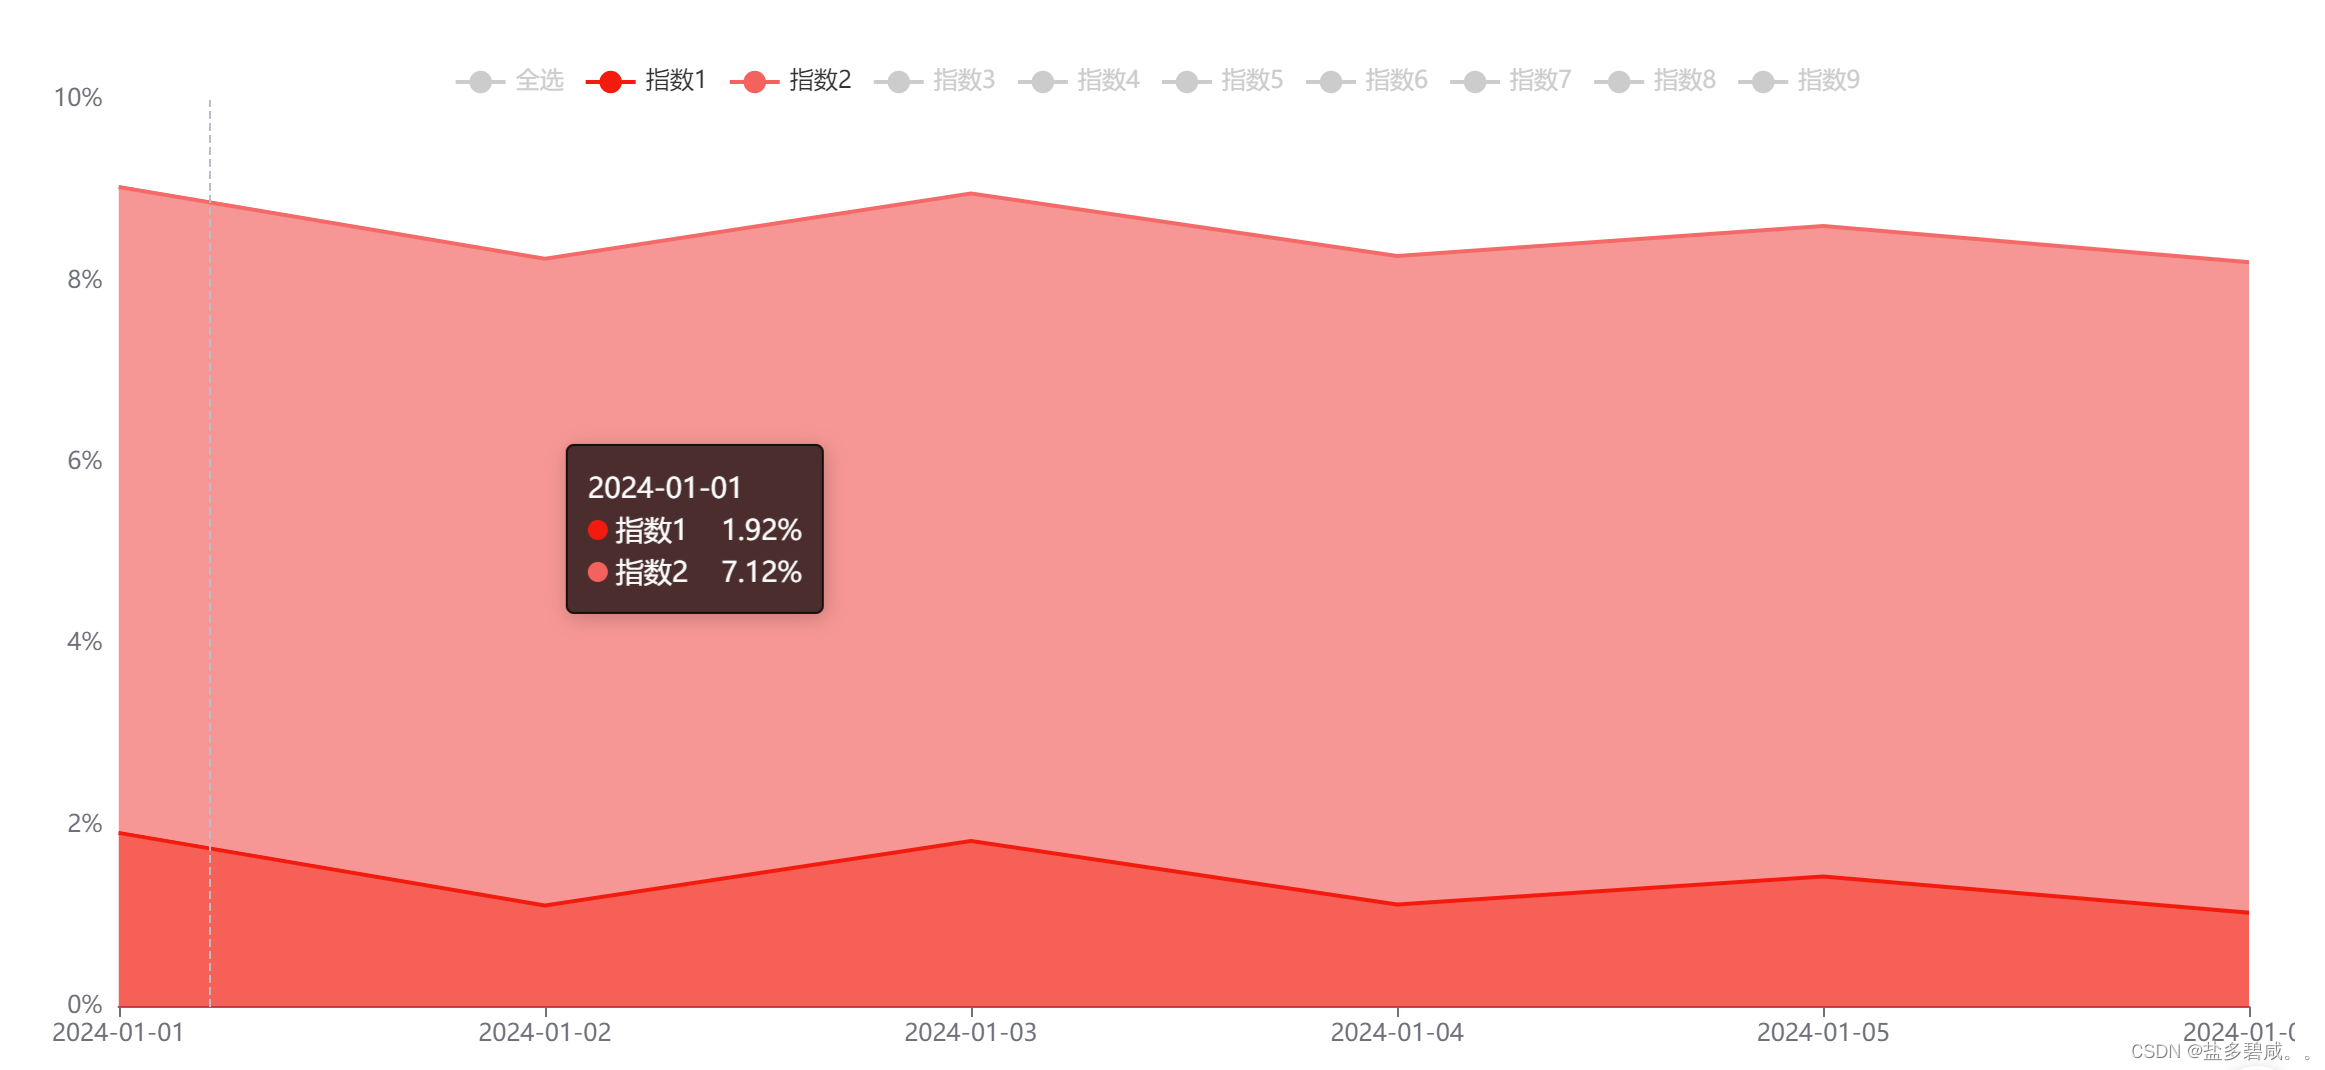
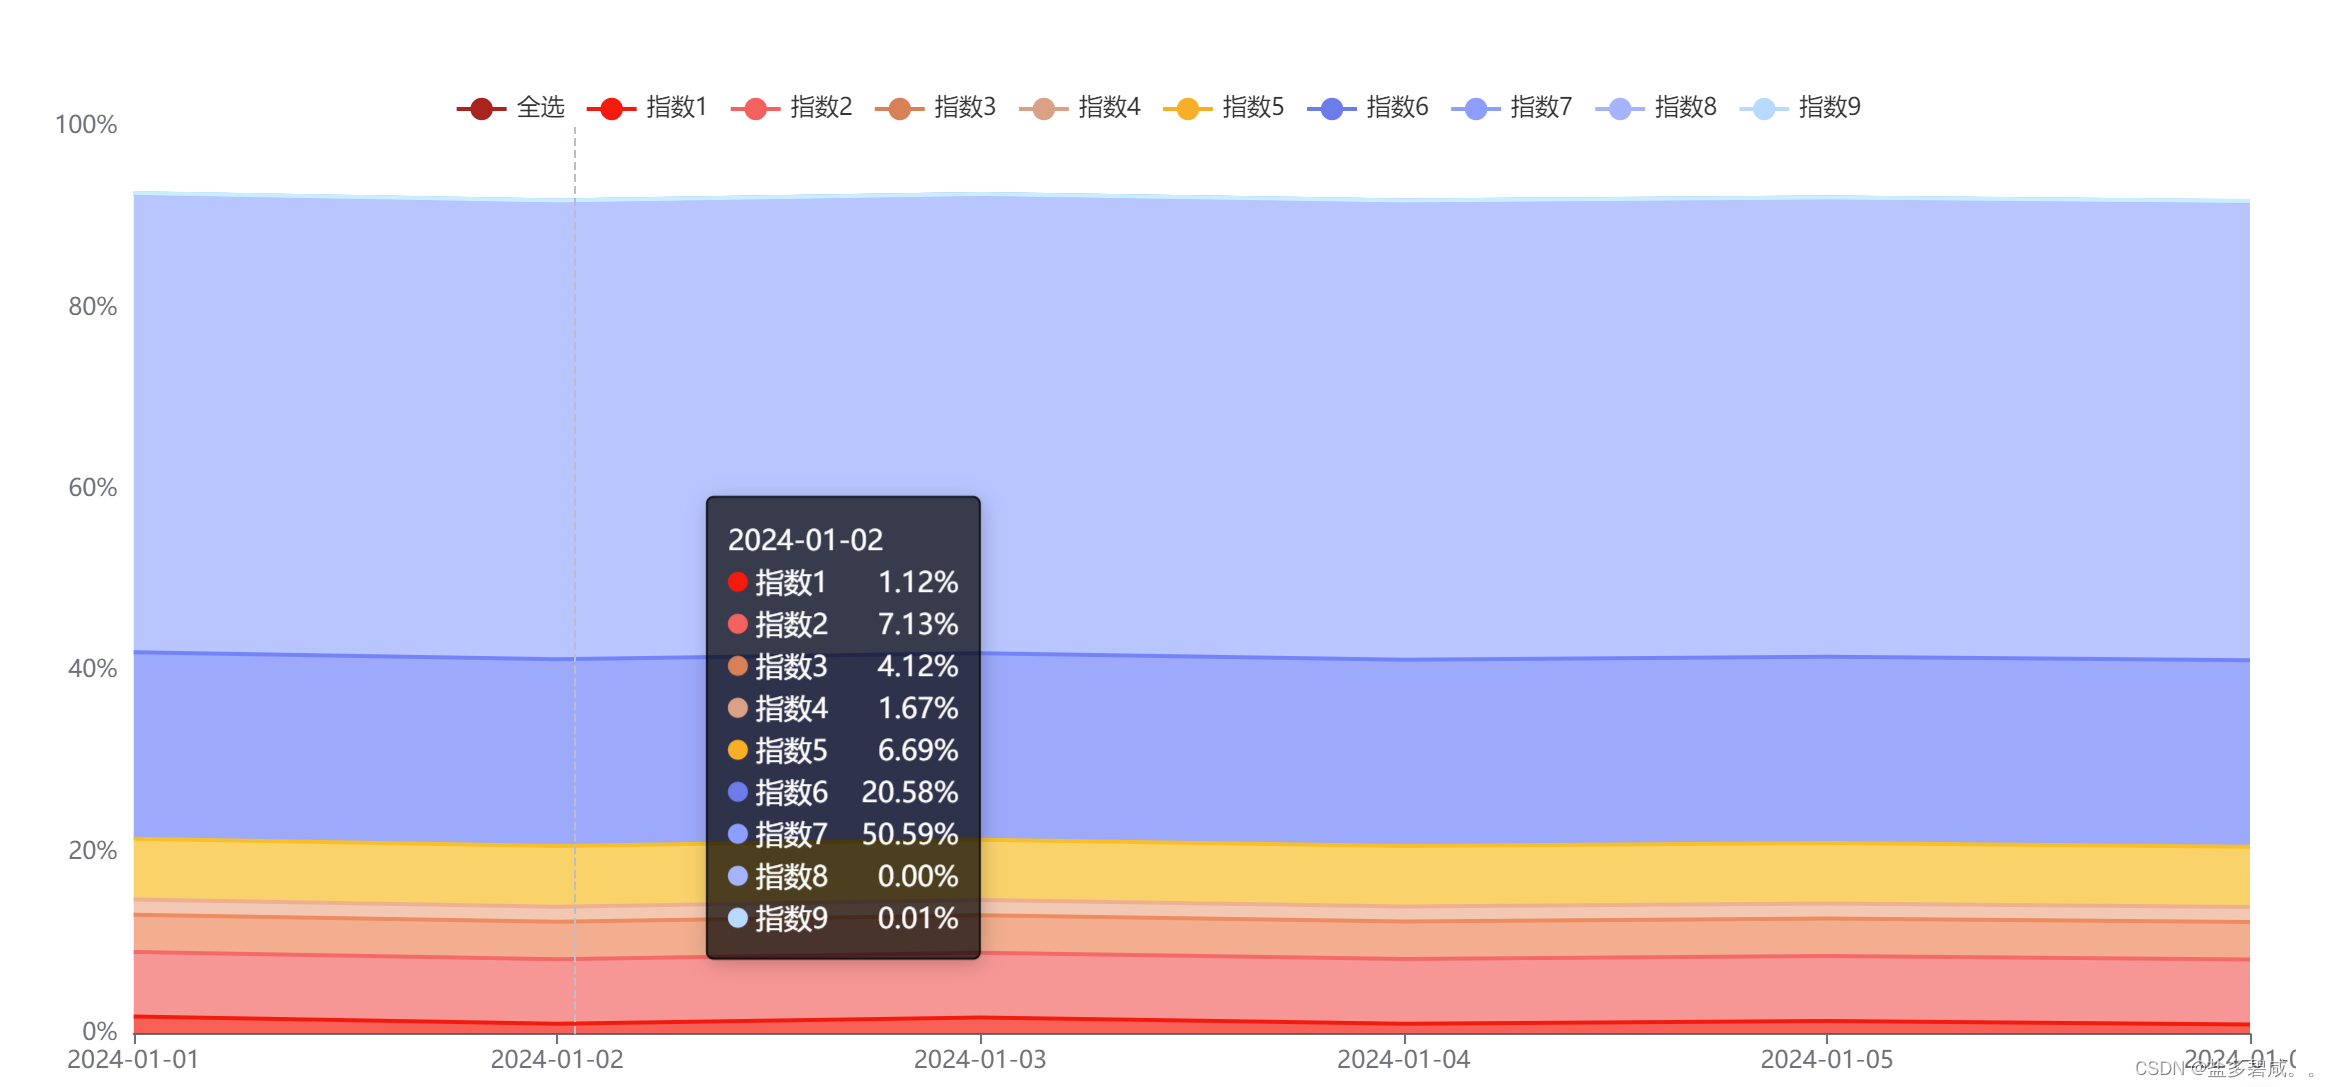
vue echarts 折线图 堆叠面积图
1、默认只展示指数1和指数2的数据,可以手动点击legend展示其他数据;
2、legend手动添加 ‘全选’ 选项;
<template>
<div>
<div id="lineChart"
ref="lineChartRef"
style="width: 100%; height: 550px"></div>
</div>
</template>
<script>
import * as echarts from 'echarts';
export default {
name: '',
props: {},
components: {},
data() {
return {
chart: null,
_thisForChart: null,
_thisForWindow: null,
}
},
watch: {},
mounted () {
this.$nextTick(() => {
this.initAssetsChart();
this.addEventListenerToSidebarContainer(this)
this.addEventListenerToWindowResize(this)
});
},
beforeDestroy () {
this.removeEventListenerToSidebarContainer()
this.removeEventListenerToWindowResize()
},
methods: {
initAssetsChart () {
let xAxisData = ['2024-01-01','2024-01-02','2024-01-03','2024-01-04','2024-01-05','2024-01-06',]
let index1 = ["1.92", "1.12", "1.83", "1.13", "1.44", "1.04",]
let index2 = ["7.12", "7.13", "7.14", "7.15", "7.17", "7.17",]
let index3 = ["4.11", "4.12", "4.13", "4.13", "4.13", "4.13",]
let index4 = ["1.69", "1.67", "1.67", "1.66", "1.66", "1.66", ]
let index5 = ["6.68", "6.69", "6.66", "6.65", "6.65", "6.65",]
let index6 = ["20.57", "20.58", "20.56", "20.55", "20.55", "20.55",]
let index7 = ["50.61", "50.59", "50.61", "50.62", "50.62", "50.62",]
let index8 = ["0.00", "0.00", "0.00", "0.00", "0.00", "0.00",]
let index9 = ["0.01", "0.01", "0.01", "0.01", "0.01", "0.01", ]
var chartDom = document.getElementById('lineChart');
this.chart = echarts.init(chartDom);
let option = {
color: ['#B22222','#ff1717','#ff6161','#e0815b','#e0a188','#ffaf33','#637be6', '#879dff', '#a1b2ff', '#b3daff',],
tooltip: {
trigger: 'axis',
backgroundColor: 'rgba( 0, 0, 0,0.7)',
borderColor: 'rgba( 0, 0, 0,0.7)',
formatter:function(params) {
var str = params[0].name + '</br>'
for(let item of params) {
str = `<span style='color: #fff;'>${str}</span><div style='display:flex;align-items:center;justify-content:space-between;'><span>${item.marker}<span style='color: #fff;'>${item.seriesName}</span></span> <span style='color: #fff;'>${item.value}%</span></div>`
}
return str;
}
},
legend: {
top: 40,
left: 'center',
data: ['全选', '指数1', '指数2', '指数3', '指数4','指数5', '指数6', '指数7','指数8','指数9'],
selected: {'全选': false,'指数1': true, '指数2':true, '指数3':false, '指数4':false,'指数5':false, '指数6':false, '指数7':false,'指数8':false,'指数9':false}
},
grid: {
left: '1.5%',
right: '2%',
bottom: '3%',
containLabel: true
},
xAxis: {
type: 'category',
boundaryGap: false,
axisLabel: {
// color: '#fff',
// interval: 40
},
axisLine: {
show: true,
lineStyle: {
},
},
splitLine: {
show: false,
},
data: xAxisData
},
yAxis: {
type: 'value',
axisLabel: {
show: true,
formatter: '{value}%'
},
axisLine: {
show: false
},
splitLine: {
show: false,
},
},
series: [
{
name: '全选',
type: 'line',
stack: 'total',
symbol: 'none',
label: {
show: true,
position: 'top'
},
areaStyle: {},
itemStyle: {
normal: {
label: {
show: false
}
}
},
data: [],
},
{
name: '指数1',
type: 'line',
stack: 'total',
symbol: 'none',
label: {
show: true,
position: 'top'
},
areaStyle: {},
itemStyle: {
normal: {
label: {
show: false
}
}
},
data: index1
},
{
name: '指数2',
type: 'line',
stack: 'total',
symbol: 'none',
label: {
show: true,
position: 'top'
},
areaStyle: {},
itemStyle: {
normal: {
label: {
show: false
}
}
},
data: index2
},
{
name: '指数3',
type: 'line',
stack: 'total',
symbol: 'none',
label: {
show: true,
position: 'top'
},
areaStyle: {},
itemStyle: {
normal: {
label: {
show: false
}
}
},
data: index3
},
{
name: '指数4',
type: 'line',
stack: 'total',
symbol: 'none',
areaStyle: {},
itemStyle: {
normal: {
label: {
show: false
}
}
},
data: index4
},
{
name: '指数5',
type: 'line',
stack: 'total',
symbol: 'none',
areaStyle: {},
itemStyle: {
normal: {
label: {
show: false
}
}
},
data: index5
},
{
name: '指数6',
type: 'line',
stack: 'total',
symbol: 'none',
label: {
show: true,
position: 'top'
},
areaStyle: {},
itemStyle: {
normal: {
label: {
show: false
}
}
},
data: index6
},
{
name: '指数7',
type: 'line',
stack: 'total',
symbol: 'none',
areaStyle: {},
itemStyle: {
normal: {
label: {
show: false
}
}
},
data: index7
},
{
name: '指数8',
type: 'line',
stack: 'total',
symbol: 'none',
areaStyle: {},
itemStyle: {
normal: {
label: {
show: false
}
}
},
data: index8
},
{
name: '指数9',
type: 'line',
stack: 'total',
symbol: 'none',
label: {
show: true,
position: 'top'
},
areaStyle: {},
itemStyle: {
normal: {
label: {
show: false
}
}
},
data: index9
},
]
};
this.chart.setOption(option,true);
this.chart.on("legendselectchanged",function(params) {
if (params.name == "全选") {
let selectMark = option.legend.selected["全选"]; //获取图例中的全选状态,作为一个标记变量
console.log(selectMark,'selectMark---');
//option为上面的Echarts对象
var data = option.legend.data;
if (selectMark) {
//判断
for (var i = 0; i < data.length; i++) {
option.legend.selected[data[i]] = false;
}
} else {
for (var i = 0; i < data.length; i++) {
option.legend.selected[data[i]] = true;
}
}
this.setOption(option);
}
})
},
// 监听侧边栏导航的宽度发生变化
addEventListenerToSidebarContainer(_this) {
let sidebarContainer = document.getElementsByClassName("sidebar-container")[0];
this._thisForChart = _this;
sidebarContainer &&
sidebarContainer.addEventListener("transitionend", this.sidebarResizeHandler);
},
removeEventListenerToSidebarContainer() {
let sidebarContainer = document.getElementsByClassName("sidebar-container")[0];
this._thisForChart = null
sidebarContainer &&
sidebarContainer.removeEventListener("transitionend", this.sidebarResizeHandler);
},
sidebarResizeHandler(e) {
if (e.propertyName === "width") {
this._thisForChart.chart.resize();
}
},
// window 的尺寸发生变化的时候 会执行图表的resize
addEventListenerToWindowResize(_this) {
this._thisForWindow = _this;
window.addEventListener("resize", this.windowResizeHandler);
},
removeEventListenerToWindowResize(_this) {
this. _thisForWindow = null
window.removeEventListener("resize", this.windowResizeHandler);
},
windowResizeHandler(e) {
this._thisForWindow.chart.resize();
},
}
}
</script>
<style lang="scss" scoped>
</style>
展示效果图:
默认效果
全选效果

