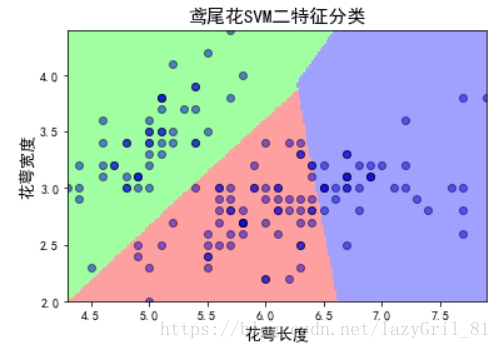
上一篇文章详细说明了支持向量机算法模型的原理,这篇文章中,我将用python通过该算法来实现对鸢尾花数据集的分类。
1、先导入需要的库
# -*- coding:utf-8 -*-

import numpy as np
import pandas as pd
from sklearn import svm
from sklearn.model_selection import train_test_split
import matplotlib as mpl
import matplotlib.pyplot as plt
from sklearn import metrics
2、读取数据并切分数据
import os
path = 'data' + os.sep + 'iris_data.csv'
Data = pd.read_csv(path)
Data.head()

# 映射函数iris_type: 将string的label映射至数字label
# 参数s: 鸢尾花品种的名字
def iris_type(s):
    class_label = {'Iris-setosa': 0, 'Iris-versicolor': 1, 'Iris-virginica': 2}
    return class_label[s]

Data = pd.read_csv(path,converters = {4:iris_type})
Data.head()
from sklearn.model_selection import train_test_split

#将原始数据集划分成训练集与测试集
# 用np.split按列(axis=1)进行分割 # (4,):分割位置,前4列作为x的数据,第4列之后都是y的数据
x,y = np.split(Data, (4,), axis = 1)
#print(x)
# 取前两列特征
x = x.iloc[:, :2]
# 用train_test_split将数据按照7:3的比例分割训练集与测试集,
# 随机种子设为1(每次得到一样的随机数,结果重现),设为1或不设(每次随机数都不同)
x_train, x_test, y_train,y_test = train_test_split(x,y,test_size = 0.3,random_state = 1)
3、 搭建模型,训练SVM分类器
# classifier=svm.SVC(kernel='linear',gamma=0.1,decision_function_shape='ovo',C=0.1)
# kernel='linear'时,为线性核函数,C越大分类效果越好,但有可能会过拟合(defaul C=1)。
# kernel='rbf'(default)时,为高斯核函数,gamma值越小,分类界面越连续;gamma值越大,分类界面越“散”,分类效果越好,但有可能会过拟合。
# decision_function_shape='ovo'时,为one v one分类问题,即将类别两两之间进行划分,用二分类的方法模拟多分类的结果。
# decision_function_shape='ovr'时,为one v rest分类问题,即一个类别与其他类别进行划分。
classifier_svm=svm.SVC(kernel='rbf',gamma=0.1,decision_function_shape='ovo',C=0.8)
#开始训练
classifier_svm.fit(x_train,y_train)
4.、计算svm分类器的准确率
print("SVM-输出训练集的准确率为:",classifier_svm.score(x_train,y_train))
print("SVM-输出测试集的准确率为:",classifier_svm.score(x_test,y_test))
5、分类器的评估报告
精确率(Precision):针对我们预测结果而言的,它表示的是预测为正的样本中有多少是真正的正样本;
召回率(Recall):针对我们原来的样本而言的,它表示的是样本中的正例有多少被正确预测了;
F1 Score = 2 * P * R / (P+R) 调和平均数
y_pred = classifier_svm.predict(x_test)
print(metrics.classification_report(y_test, y_pred, target_names = ['Iris-setosa', 'Iris-versicolor', 'Iris-virginica']))
6、绘制图像
# 1.确定坐标轴范围,x,y轴分别表示两个特征
x1_min, x1_max = x.iloc[:, 0].min(), x.iloc[:, 0].max()  # 第0列的范围  x[:, 0] ":"表示所有行,0表示第1列
x2_min, x2_max = x.iloc[:, 1].min(), x.iloc[:, 1].max()  # 第1列的范围  x[:, 0] ":"表示所有行,1表示第2列
x1, x2 = np.mgrid[x1_min:x1_max:200j, x2_min:x2_max:200j]  # 生成网格采样点(用meshgrid函数生成两个网格矩阵X1和X2)
grid_test = np.stack((x1.flat, x2.flat), axis=1)  # 测试点,再通过stack()函数,axis=1,生成测试点
# .flat 将矩阵转变成一维数组 (与ravel()的区别:flatten:返回的是拷贝
grid_hat = classifier_svm.predict(grid_test)       # 预测分类值
grid_hat = grid_hat.reshape(x1.shape)  # 使之与输入的形状相同
cm_light = mpl.colors.ListedColormap(['#A0FFA0', '#FFA0A0', '#A0A0FF'])
plt.pcolormesh(x1, x2, grid_hat, cmap=cm_light) # 预测值的显示
plt.plot(x.iloc[:, 0], x.iloc[:, 1], 'o', alpha=alpha, color='blue', markeredgecolor='k')
plt.scatter(x_test.iloc[:, 0], x_test.iloc[:, 1], s=120, facecolors='none', zorder=10)  # 圈中测试集样本
plt.xlabel(u'花萼长度', fontsize=13)
plt.ylabel(u'花萼宽度', fontsize=13)
plt.xlim(x1_min, x1_max)
plt.ylim(x2_min, x2_max)
plt.title(u'鸢尾花SVM二特征分类', fontsize=15)
plt.show()
7、总结
由上述结果,我们得到其在测试集上准确率小于0.8,与前面逻辑斯蒂回归模型相比,模型的分类效果好一点,但是还是不是很好。