我自己翻遍了网上,以及插件市场,其实并没有uniapp 上使用echarts-gl的样例,大多数都是使用插件市场的echarts的插件
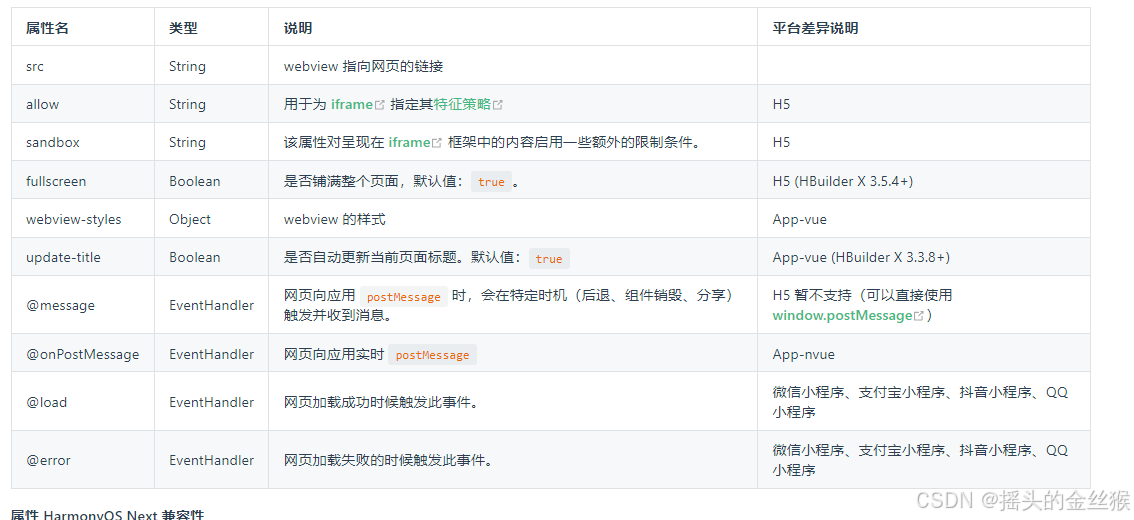
开始自己尝试直接用echartsgl 没有成功,后来尝试使用threejs 但是也遇到一些问题,最后我看官网的时候有 web-view | uni-app官网 想着就可以做一个外嵌的网页
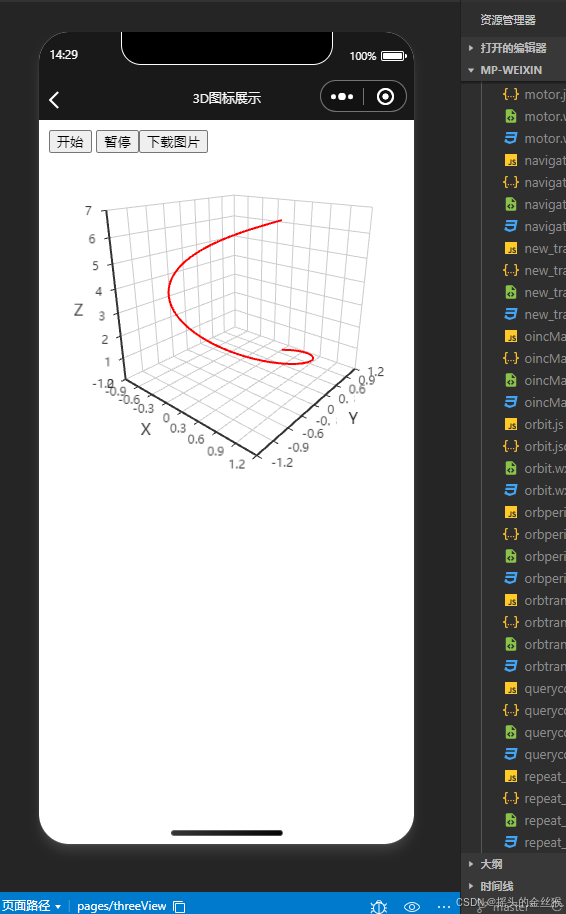
一、效果图
二、使用过程
1、先写一个外部的html
结构的网页 就是自己跳转的写就行了
(因为我用到了着一些js就引用了)
uniapp官网有uniapp 和外部通信的方法和回调函数(但是都没用,不知道为什么)
个人不知道为什么里面官方的方法没有用,比如数据传输和调用成功的方法(因为我只做数据展示,所以我在这里直接请求数据回来展示就行了)下面是官方的方法,如果有大佬知道这是为什么,请给小子留言是为什么谢谢。
2、uniapp代码
//在当前页面点击跳转(配界面我就不用说了大家去自己的pages.json去添加就行了)
uni.navigateTo({
	url: `/pages/threeView`
})

// 另外写一个页面,这个页面专门负责跳转外部链接窗口的
<template>
	<web-view :src="data.url"></web-view>
</template>
<script setup>
	import {
		reactive,
		ref,
	} from 'vue';
	let data = reactive({
	 url: "http://127.0.0.1:8080/"
	})
</script>
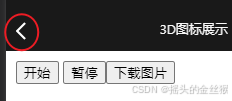
必须要使用一个页面跳转到,为什么要这样写,因为跳转之后就会有返回的一个箭头
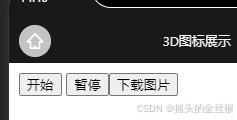
如果直接在一个页面上跳转就会出现
3、跳转外部的地址
http://127.0.0.1:8080/ 我这里上面是我自己启的一个服务
小程序仅支持加载网络网页,不支持本地htm
所以如果真是的时候还是得让后端挂到服务器上面去
4、本地代码html
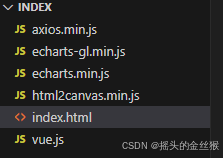
(其中的js 都是) 插件 引用了axios、echarts-gl、echarts、html2canvas 、vuejs(使用vue3写法)这些js 网络上都有可自行下载
如果自己不会挂,请参考以下
使用本地服务器打开html文件_html以服务器打开-CSDN博客
<!DOCTYPE html>
<html lang="en">

<head>
    <meta charset="UTF-8">
    <meta name="viewport" content="width=device-width, initial-scale=1.0">
    <title>3D图标展示</title>
    <script src="./echarts.min.js"></script>
    <script src="./echarts-gl.min.js"></script>
    <!-- <script type="text/javascript" src="//res.wx.qq.com/open/js/jweixin-1.4.0.js"></script>
    <script type="text/javascript" src="https://gitcode.net/dcloud/uni-app/-/raw/dev/dist/uni.webview.1.5.6.js">
    </script> -->
    <script src="./axios.min.js"></script>
    <script src="./vue.js"></script>
    <script src="./html2canvas.min.js"></script>
</head>

<body>
    <div id="app">
        <div class="operation">
            <button class="kaishi" @click="kaishi">开始</button>{{test}}
            <button class="zanting" @click="zanting">暂停</button>
            <button class="xiazai" @click="xiazai">下载图片</button>
        </div>
        <div class="content">
            <div id="mychart" style="width:90vw;height:375px;"></div>
        </div>
    </div>
    <script>
        const {
            createApp,
            ref,
            onMounted
        } = Vue
        const app = createApp({
            setup() {
                //测试变量
                let index = 0;
                let intervalId;
                let curveData = []
                let dtc = null
                let option
                //测试函数
                const kaishi = () => {
                    if (!intervalId) {
                        intervalId = setInterval(function () {
                            updatePoint(index++);
                            if (index >= curveData.length) index = 0; // 循环回到起点
                        }, 100);
                    }
                }
                const zanting = () => {
                    if (intervalId) {
                        clearInterval(intervalId);
                        intervalId = null;
                    }
                }
                const xiazai = () => {
                    html2canvas(document.getElementById("mychart")).then(function (canvas) {
                        var img = canvas
                            .toDataURL("image/png")
                            .replace("image/png", "image/octet-stream");
                        // 创建a标签,实现下载
                        var creatIMg = document.createElement("a");
                        creatIMg.download = "3d.png"; // 设置下载的文件名,
                        creatIMg.href = img; // 下载url
                        document.body.appendChild(creatIMg);
                        creatIMg.click();
                        creatIMg.remove(); // 下载之后把创建的元素删除
                    })

                }


                onMounted(() => {
                    init()

                })

                const init = () => {
                    axios({
                        method: "get",
                        url: "https://mpapi.sstlab.cn/test/ssr/latest?name=undefined&type=1"
                    }).then(function (resp) {
                        console.log(resp, "resp");
                    })

                    dtc = echarts.init(document.getElementById('mychart'))
                    option = {
                        tooltip: {},
                        visualMap: {
                            show: false,
                            dimension: 2,
                            min: -1,
                            max: 1,
                            inRange: {
                                color: [
                                    '#313695',
                                    '#4575b4',
                                    '#74add1',
                                    '#abd9e9',
                                    '#e0f3f8',
                                    '#ffffbf',
                                    '#fee090',
                                    '#fdae61',
                                    '#f46d43',
                                    '#d73027',
                                    '#a50026'
                                ]
                            }
                        },
                        xAxis3D: {},
                        yAxis3D: {},
                        zAxis3D: {},
                        grid3D: {
                            left: '5%',
                            top: '-5%',
                            right: '5%',
                            bottom: '0%',
                            containLabel: true,

                            viewControl: {
                                distance: 230 // 根据实际情况调整这个值,数值越大,看起来图表越小
                            }
                        },
                        series: [{
                            type: 'line3D',
                            coordinateSystem: 'cartesian3D',
                            lineStyle: {
                                width: 2,
                                color: '#ff0000' // 线的颜色
                            },
                            data: (function () {
                                let data = [];
                                for (let t = 0; t < 2 * Math.PI; t += 0.1) {
                                    data.push([Math.sin(t), Math.cos(t),
                                        t
                                    ]); // x, y, z 坐标
                                }
                                return data;
                            })()
                        }, {
                            id: 'movingPoint', // 用于更新数据时引用
                            type: 'scatter3D',
                            coordinateSystem: 'cartesian3D',
                            symbolSize: 10, // 点的大小
                            itemStyle: {
                                color: 'blue' // 点的颜色
                            },
                            data: [] // 初始为空
                        }]
                    }

                    if (localStorage.getItem("threeView")) {
                        console.log(localStorage.getItem("threeView"), "11111");
                        option.series[0].data = JSON.parse(localStorage.getItem("threeView"));
                    }
                    // 使用刚指定的配置项和数据显示图表
                    dtc.setOption(option);
                    // 获取曲线数据
                    curveData = option.series[0].data;


                }


                // 更新点的位置函数
                const updatePoint = (index) => {
                    if (index >= curveData.length) index = 0; // 循环回到起点
                    dtc.setOption({
                        series: [{
                            id: 'movingPoint',
                            data: [curveData[index]]
                        }]
                    });
                }


                return {
                    kaishi,
                    zanting,
                    xiazai
                }
            }
        })

        app.mount("#app")
    </script>

</body>

</html>
<style>
    .content {
        width: 100%;
        height: 100%;
    }

    #mychart {
        margin: auto;
    }

    .operation {
        position: fixed;
        top: 10px;
        left: 10px;
        z-index: 1000;
    }
</style>