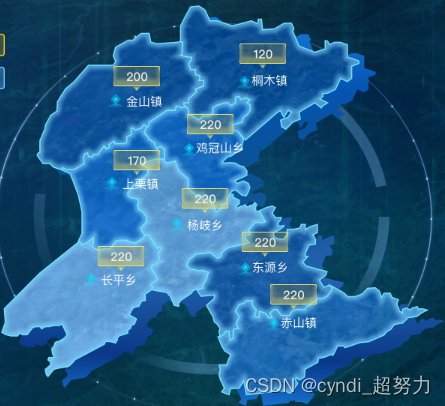
在echarts生成的图形上如果利用本地的图片达到标记的效果
想要达到的效果
1.首先我们可以在全局先把这个图片引进来
2.在我们的那个生成图形的方法里面可以这样
 let markImg='image://'+baseBg
 let littleIcom ='image://'+littleIcon
我console.log(markImg)后,在控制台输出,显然图片已经转成了base64格式了
3.在需要配置的地方
async initMap(data) {
// console.log(data,'传递过来的地图数据===');
let that = this
// var data = [
// {
// name: "上栗镇",
// value:196,
// },
// {
// name: "桐木镇",
// value: 200,
// },
// {
// name: "金山镇",
// value: 198,
// },
// {
// name: "福田镇",
// value: 120,
// },
// {
// name: "彭高镇",
// value: 174,
// },
// {
// name: "赤山镇",
// value:115,
// },
// {
// name: "鸡冠山乡",
// value: 120,
// },
// {
// name: "长平乡",
// value:156,
// },
// {
// name: "东源乡",
// value: 198,
// },
// {
// name: "杨岐乡",
// value: 50,
// },
// ]
var zuoArr=[
{
name: "上栗镇",
value:[113.766448,27.865476],
},
{
name: "桐木镇",
value: [113.889000,27.969262]
},
{
name: "金山镇",
value: [113.766838,27.943140],
},
{
name: "赤山镇",
value:[113.926089,27.735441],
},
{
name: "鸡冠山乡",
value: [113.866207,27.888261],
},
{
name: "长平乡",
value:[113.739957,27.772457],
},
{
name: "东源乡",
value: [113.889963,27.791695],
},
{
name: "杨岐乡",
value: [113.825879,27.83341],
},
]
var biaozhi=[
{
name: "上栗镇",
value:[113.792448,27.885476],
num:null
},
{
name: "桐木镇",
value: [113.914356,27.988262],
num:null
},
{
name: "金山镇",
value: [113.790838,27.961640],
num:null
},
{
name: "赤山镇",
value:[113.952089,27.755441],
num:null
},
{
name: "鸡冠山乡",
value: [113.866207,27.918261],
num:null
},
{
name: "长平乡",
value:[113.764957,27.792457],
num:null
},
{
name: "东源乡",
value: [113.918963,27.810695],
num:null
},
{
name: "杨岐乡",
value: [113.851879,27.85241],
num:null
},
]
data.data.forEach((item,index) => {
biaozhi.forEach((item2,index2)=>{
if(item.name==item2.name){
biaozhi[index2].num=item.value
biaozhi[index2].unit=item.unit
}
})
})
// console.log(biaozhi,'标志点数据***');
let res = await this.$getJson("/DreamWeb/dist-jsc/static/slx.json")
// let res = await this.$getJson("/static/slx.json")
this.$echarts.registerMap('shangli', res.data);
let markImg='image://'+baseBg
let littleIcom ='image://'+littleIcon
// console.log(markImg);
let option = {
layoutCenter: ['50%', '48%'],//距离左右,上下距离的百分比
layoutSize:'95%',//map百分比大小
geo: {
layoutCenter: ['50%', '52%'],//距离左右,上下距离的百分比
layoutSize:'95%',//map百分比大小
map: "shangli",
aspectScale: 1, //长宽比
zoom: 1,
roam: false,
itemStyle: {
normal: {
areaColor: "rgba(20,105,187,0.8)",
shadowColor: "rgba(20,105,187,0.8)",
borderWidth: 0.5,
borderColor: "#666",
shadowOffsetX: 2,
shadowOffsetY: 2,
label: {
show: true,
},
},
emphasis: {
areaColor: "#999",
borderWidth: 0.5,
borderColor: "#666",
color: "#000",
label: {
show: false,
},
},
},
},
// select: { // 地图选中区域样式
// label:{ // 选中区域的label(文字)样式
// color: '#000',
// textStyle: {
// color: '#ffd673'
// }
// },
// itemStyle: {// 选中区域的默认样式
// borderWidth: 2,
// borderColor: '#ffd673',
// areaColor: '#024ca9',
// color: '#ffd673',
// },
// },
visualMap: {
type: 'continuous',
right:"4%",
bottom:"5%",
min:data.min,
max: data.max,
text: ['高', '低'],
// textGap:20,
textStyle: {
color: "#FFF",
fontSize: this.getFontSize(14),
},
realtime: false,
calculable: false,
inRange: {
color:['rgba(122,189,244,0.6)', 'rgba(20,105,187,1)']
},
itemWidth:this.getFontSize(21),
itemHeight:this.getFontSize(144),
seriesIndex: 0,
zlevel: 2,
},
tooltip: {
show: false,
trigger: 'item',
// formatter: '{b}'
axisPointer: {
type: 'shadow'
},
backgroundColor: '#025272',
textStyle: {
color: "#FFF"
},
formatter: function (series) {
// console.log(series)
let str = ``
str = `<div style="text-align:left;font-size:${that.getFontSize(16)}px;padding:0 ${that.getFontSize(5)}px ${that.getFontSize(5)}px ${that.getFontSize(5)}px;">
${series.name}:${series.value? series.value:'--'}
</div>
</div>`
// console.log(series)
return str
},
borderWidth: 0,
},
series: [
// 地图配置
{
type: "map",
roam: false,
selectedMode: "single",
label: {
normal: {
show: true,
textStyle: {
color: "#FFFFFF",
fontSize: this.getFontSize(16),
},
},
emphasis: {
textStyle: {
color: "#FFFFFF",
},
},
},
itemStyle: {
normal: {
borderColor: "rgba(107, 229, 255,1)",
borderWidth:2,
},
// emphasis: {
// areaColor: '#0091FF',
// // borderWidth: 0.1,
// }
},
aspectScale: 1,
zoom: 1,
map: "shangli", //使用
data: data.data,
},
// 坐标点的配置
{
type: 'effectScatter',
coordinateSystem: 'geo',
geoIndex: 0,
rippleEffect: { //坐标点动画
period: 5,
scale: 1,
brushType: 'fill'
},
label: {
normal: {
show: false,
position: 'right',
formatter: '{b}',
color: '#FFEB90',
fontWeight: "bold",
fontSize: this.getFontSize(14),
}
},
symbol: littleIcom,
symbolSize: [this.getFontSize(22), this.getFontSize(22)],
z: 999,
symbolSize: this.getFontSize(12),
showEffectOn: 'render',
rippleEffect: {
brushType: 'stroke',
},
hoverAnimation: true,
label: {
normal: {
formatter: '{}',
position: 'left',
show: false,
},
},
itemStyle: {
normal: {
color: "#09DBFF", //标点颜色
},
},
zlevel: 2,
data:zuoArr
},
//地图标志框的配置
{
type: 'scatter',
coordinateSystem: 'geo',
label: {
show: true,
formatter: function (params) {
// console.log(params);
return params.data.num+params.data.unit;
},
lineHeight:this.getFontSize(10),
textAlign:'center',
color: '#ffffff',
fontSize:this.getFontSize(14),
padding: [4,24]
},
symbol: markImg,
symbolSize: [this.getFontSize(120), this.getFontSize(32)],
z: 999,
data:biaozhi,
}
],
};
let myChart = this.$echarts.init(this.$refs.map)
if (option && typeof option === 'object') {
myChart.on('click', function (params) {
console.log(params);
});
}
myChart.clear();
myChart.setOption(option, true);
window.addEventListener("resize", () => {
myChart.resize();
});
},

