Figure 3-17 shows the utilization of the same port during a week. The peak utilization values generate two alerts for greater than 80% utilization. On the other hand, the utilization of the same port does not generate any alert with average values. Because of using a longer duration (1 week), the data points are aggregated to fit in the graph. While the data points are the same, the outcome of aggregates created using the peak function is different from the aggregates created using an average function. 图 3-17 显示了同一端口一周内的使用情况。峰值利用率值超过 80% 会产生两个警报。另一方面,同一端口的平均利用率值不会产生任何警报。由于使用了较长的持续时间(1 周),数据点被汇总到图表中。虽然数据点相同,但使用峰值函数创建的聚合结果与使用平均函数创建的聚合结果不同。
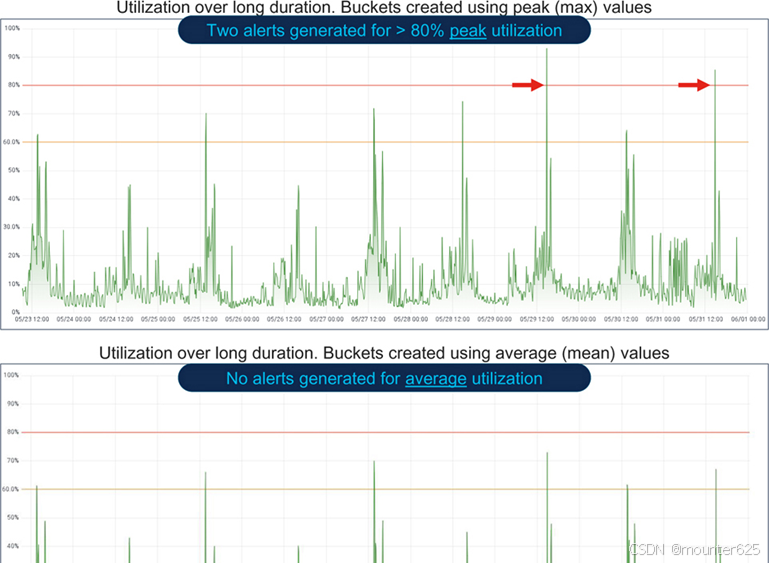
Figure 3-18 shows the utilization of the same port for two days when Figure 3-17 shows the first alert. Because of fewer data points, no aggregates are created this time. As a result, the peak and the average utilization graphs are identical and both result in generating the same alert. 图 3-18 显示了图 3-17 显示第一个警报时同一端口两天的使用情况。由于数据点较少,这次没有创建聚合。因此,峰值利用率图和平均利用率图完全相同,都会生成相同的警报。
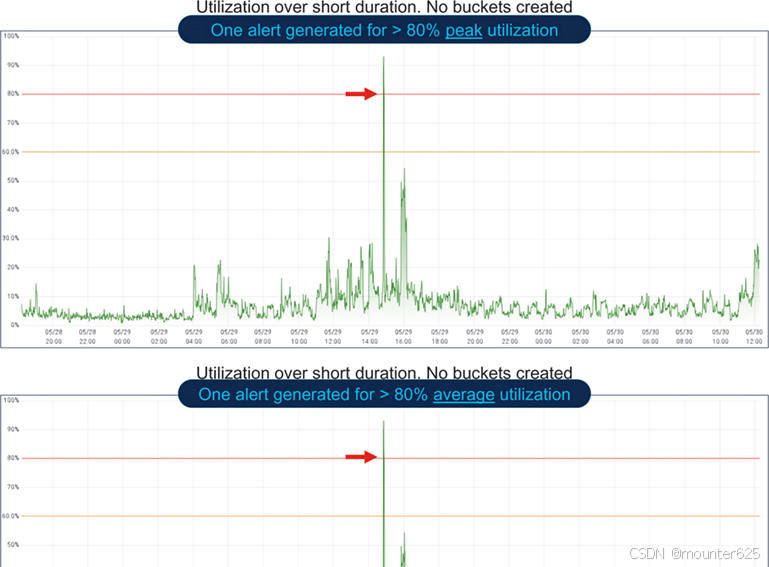
Figure 3-18 Same peak and average utilization over a short duration.
As evident from Figure 3-17 and 3-18, the different outcomes of peak and average functions may be unnoticed at a short duration (2 days), whereas the results are misleading at a longer duration (1 week). 从图 3-17 和图 3-18 中可以看出,峰值函数和平均函数的不同结果在短时间内(2 天)可能不会引起注意,而在较长时间内(1 周)则会产生误导。
Between the peak and the average utilization, one may not be necessarily better than the other. Both have their use cases. While peak values capture all the events, some users do not want to be alarmed about the peak values, especially when these events are already being investigated. Other users prefer to keep the peak-utilization events for themselves