目录
谷歌地球引擎的不确定性量化
利用保形预测对谷歌地球引擎中的分类和回归任务进行不确定性量化。 示例包括:1)利用 Planet NICFI 和 GEDI 数据,使用保形量化回归估算树冠高度;2)谷歌动态世界土地覆盖数据的不确定性量化;3)入侵树种绘图。
不确定性量化(UQ)提供了关于预测质量的信息,并可以允许数据集之间的比较和整合。保形预测目前是唯一可以提供有效覆盖的逐像素不确定性信息的 UQ 框架(即,如果指定了 0.9 的置信水平,alpha = 0.1,预测区域将以 90% 的概率包含实际值)。
不确定性量化方法
实现不确定性的量化通常涉及到概率论和统计学的概念和方法。以下是一些常用的方法和技术:
1. 概率分布:使用概率分布来描述不确定性。常见的概率分布包括正态分布、均匀分布、二项分布等。可以根据实际情况选择合适的概率分布来描述不确定性。
2. 随机变量:将不确定的量表示为随机变量。随机变量是一个可以取多个可能值的变量,每个可能值的发生概率由概率分布决定。
3. 统计推断:使用统计学中的方法来推断未知的参数或变量。常用的统计推断方法包括最大似然估计、贝叶斯推断等。
4. 蒙特卡洛模拟:通过随机抽样的方式来估计不确定性。蒙特卡洛模拟是一种基于随机抽样的数值计算方法,可以用来模拟复杂的概率分布和随机过程。
5. 不确定性传播:将不确定性通过数学模型传递到输出变量。不确定性传播是一种将输入不确定性通过数学运算传递到输出变量的方法,常用的方法包括蒙特卡洛模拟、蒙特卡洛方法等。
以上是一些常用的方法和技术,根据具体情况选择合适的方法来实现不确定性的量化。
功能
GEE原生的保形分类器和回归器支持
支持GEE-JS和GEE-Python API
创建无云的Sentinel-2图像合成和无间隙的Sentinel-1合成。
示例展示包括可视化、基于API的导入和导出、额外的地形和坐标变换变量的计算、模型拟合和推断的端到端工作流程。
空间交叉验证。
JavaScript代码
可以通过以下链接访问包含所有 GEE 规范 JS 代码的存储库:https://code.earthengine.google.com/?accept_repo=users/geethensingh/conformal
该存储库包含用于校准、评估和使用校准的规范分类器或回归器进行推断的代码,适用于特征和图像集合。每个脚本都提供了演示。
假设已经为分类或回归任务训练了模型,并且有一个可用于校准和评估规范预测器的样本外数据集,则量化不确定性有三个步骤,以确保覆盖(如下所示)。
注意:图像集合和特征集合有不同的模块。推断模块是唯一的共享模块。
步骤1:查验校准一个符合预测器(分类器)
参考代码
//导入保角分类器校准函数
var calFunctions = require('users/geethensingh/conformal:calibrateConformalFeatureClassifier.js');

// 配置参数
var ALPHA = 0.1; // 1-ALPHA corresponds to required coverage. For example, 0.1 for 90% coverage
var SCALE = 10; // Used to compute Eval metrics
var SPLIT = 0.8; // Split used for calibration and test data (for example, 0.8 corresponds to 80% calibration data)
var LABEL = 'label'; //band name for reference label band

// 点指的是样本外特征集合(在训练过程中未使用),其属性包括
1) 每个候选类别的伪概率
2) 参考标签(此处称为 “标签”)。应为零索引
3) randomColumn 函数中的一个值,用于根据用户指定的 SPLIT 将数据拆分成校准数据集和评估数据集。
var result = calFunctions.calibrate(points, bands, ALPHA, SCALE, SPLIT, LABEL, 'demoDW_15112023');
print(result);//返回在评估和推理(不确定性量化)过程中使用的 qhat 值
实例代码
//import conformal classifier calibration functions
var calFunctions = require('users/geethensingh/conformal:calibrateConformalFeatureClassifier.js');

// Configuration parameters
var ALPHA = 0.1; // 1-ALPHA corresponds to required coverage. For example, 0.1 for 90% coverage
var SCALE = 10; // Used to compute Eval metrics
var SPLIT = 0.8; // Split used for calibration and test data (for example, 0.8 corresponds to 80% calibration data)
var LABEL = 'label'; //band name for reference label band
// ****************************//
// Data preparation

// Create a single polygon with a global extent
var globalBounds = ee.Geometry.Polygon([-180, 90, 0, 90, 180, 90, 180, -90, 10, -90, -180, -90], null, false);

// List of probability band names
var bands = ee.List(['water', 'trees', 'grass', 'flooded_vegetation',
'crops', 'shrub_and_scrub', 'built', 'bare', 'snow_and_ice']);

var dwl = ee.ImageCollection('projects/nina/GIS_synergy/Extent/DW_global_validation_tiles');
// var dwl = ee.ImageCollection('projects/ee-geethensingh/assets/UQ/dwTest_labels_4326');
var dwLabels = dwl
  .select([1], ['label'])//Select reference label band
  .map(function(img){//remove unmarked up areas and extra-class
    return ee.Image(img.updateMask(img.gt(0).and(img.lt(10))).subtract(1).copyProperties(img))
    //hacky method to edit image property
    .set('joinindex', img.rename(img.getString('system:index')).regexpRename('^[^_]*_', '').bandNames().getString(0));
  })

// var dwp = ee.ImageCollection("projects/ee-geethensingh/assets/UQ/dwTest_probs_4326");
var dwp = ee.ImageCollection("projects/ee-geethensingh/assets/UQ/DW_probs");
var dwp = dwp.map(function(img){//rename bands, mask 0 pixels
    return ee.Image(img.rename(bands).selfMask()).copyProperties(img)
    //hacky method to edit image property
    .set('joinindex', img.select([0]).rename(img.getString('id_no')).regexpRename('^[^_]*_', '').bandNames().getString(0));
  });

// Join label collection and probability collection on their 'joinindex' property.
// The propertyName parameter is the name of the property
// that references the joined image.
function indexJoin(collectionA, collectionB, propertyName) {
  var joined = ee.ImageCollection(ee.Join.saveFirst(propertyName).apply({
    primary: collectionA,
    secondary: collectionB,
    condition: ee.Filter.equals({
      leftField: 'joinindex',
      rightField: 'joinindex'})
  }));
  // Merge the bands of the joined image.
  return joined.map(function(image) {
    return image.addBands(ee.Image(image.get(propertyName)));
  });
}

var dwCombined = indexJoin(dwLabels, dwp, 'probImage');

// Get a stratified sample of each of 9 classes using the label band.
var data = ee.Image(dwCombined.first());

// Sample 600 points
var points = ee.FeatureCollection(data
.stratifiedSample({numPoints:100, classBand:'label', region:data.geometry(100),
scale:10, seed:42, geometries: true})).randomColumn({seed: 42});//add random column;

var result = calFunctions.calibrate(points, bands, ALPHA, SCALE, SPLIT, LABEL, 'demoDW_15112023');
print(result);
结果
Feature
type:
Feature
geometry:
null
properties:
Object (3 properties)
version:
demoDW_15112023
qHat:
0.06434600055217743
qLevel:
9.815950920245399
步骤2:评估预测
参考代码
var evalFunctions = require('users/geethensingh/conformal:evaluateConformalFeatureClassifier.js');
// 配置参数
var QHAT = 0.06450596045364033; // 来自校准脚本
var SCALE = 10; // 用于计算 Eval 指标
var SPLIT = 0.8; // 校准和测试数据使用的分割比例(例如,0.8 相当于 80% 校准数据,20% 评估数据)。


// 点指的是样本外特征集合(在训练过程中未使用,但在校准阶段提供了相同的集合),其属性包括
1) 每个候选类别的伪概率
2) 参考标签(此处称为 “标签”)。它应为零索引
3) randomColumn 函数中的一个值,该函数用于根据用户指定的 SPLIT 将数据拆分为校准数据集和评估数据集。
var result = evalFunctions.evaluate(points, bands, QHAT, SCALE, SPLIT, 'demoDW_15112023');
print(result);// This will return the empirical coverage and the average set size
实例代码
//import conformal classifier evaluation functions
var evalFunctions = require('users/geethensingh/conformal:evaluateConformalFeatureClassifier.js');

// Configuration parameters
var QHAT = 0.06450596045364033; // from calibration script
var SCALE = 10; // Used to compute Eval metrics
var SPLIT = 0.8; // Split used for calibration and test data (for example, 0.8 corresponds to 80% calibration data)
// ****************************//
// Data preparation

// Create a single polygon with a global extent
var globalBounds = ee.Geometry.Polygon([-180, 90, 0, 90, 180, 90, 180, -90, 10, -90, -180, -90], null, false);

// List of probability band names
var bands = ee.List(['water', 'trees', 'grass', 'flooded_vegetation',
'crops', 'shrub_and_scrub', 'built', 'bare', 'snow_and_ice']);

var dwl = ee.ImageCollection('projects/nina/GIS_synergy/Extent/DW_global_validation_tiles');
// var dwl = ee.ImageCollection('projects/ee-geethensingh/assets/UQ/dwTest_labels_4326');
var dwLabels = dwl
  .select([1], ['label'])//Select reference label band
  .map(function(img){//remove unmarked up areas and extra-class
    return ee.Image(img.updateMask(img.gt(0).and(img.lt(10))).subtract(1).copyProperties(img))
    //hacky method to edit image property
    .set('joinindex', img.rename(img.getString('system:index')).regexpRename('^[^_]*_', '').bandNames().getString(0));
  });

// var dwp = ee.ImageCollection("projects/ee-geethensingh/assets/UQ/dwTest_probs_4326");
var dwp = ee.ImageCollection("projects/ee-geethensingh/assets/UQ/DW_probs");
var dwp = dwp.map(function(img){//rename bands, mask 0 pixels
    return ee.Image(img.rename(bands).selfMask()).copyProperties(img)
    //hacky method to edit image property
    .set('joinindex', img.select([0]).rename(img.getString('id_no')).regexpRename('^[^_]*_', '').bandNames().getString(0));
  });

// Join label collection and probability collection on their 'joinindex' property.
// The propertyName parameter is the name of the property
// that references the joined image.
function indexJoin(collectionA, collectionB, propertyName) {
  var joined = ee.ImageCollection(ee.Join.saveFirst(propertyName).apply({
    primary: collectionA,
    secondary: collectionB,
    condition: ee.Filter.equals({
      leftField: 'joinindex',
      rightField: 'joinindex'})
  }));
  // Merge the bands of the joined image.
  return joined.map(function(image) {
    return image.addBands(ee.Image(image.get(propertyName)));
  });
}

var dwCombined = indexJoin(dwLabels, dwp, 'probImage');

// Get a stratified sample of each of 9 classes using the label band.
var data = ee.Image(dwCombined.first());

// Sample 100 points per class. some classes have less than
// 100 pixels, so there will be less than 900 points
var points = ee.FeatureCollection(data
.stratifiedSample({numPoints:100, classBand:'label', region:data.geometry(100),
scale:10, seed:42, geometries: true})).randomColumn({seed: 42});//add random column;

var result = evalFunctions.evaluate(points, bands, QHAT, SCALE, SPLIT, 'demoDW_15112023');
print(result);
步骤3:对测试图像进行不确定性量化
参考代码
var infFunctions = require('users/geethensingh/conformal:inferenceConformalImageClassifier.js');

//配置参数
var QHAT = 0.06067845112312009; // From calibration script

// 不确定性量化:推理函数映射集合中的每个动态世界图像。
//如果使用ee.Classifier,请使用arrayFlatten([[频段名]])
var result = infFunctions.inference(dwp, bands, QHAT);
实例代码
var geometry =
    /* color: #0b4a8b */
    /* shown: false */
    /* displayProperties: [
      {
        "type": "rectangle"
      }
    ] */
    ee.Geometry.Polygon(
        [[[18.285481583210114, -33.208236289512705],
          [18.285481583210114, -34.442160111475346],
          [19.58169664058316, -34.442160111475346],
          [19.58169664058316, -33.208236289512705]]], null, false),
    geometry2 =
    /* color: #d63000 */
    /* shown: false */
    /* displayProperties: [
      {
        "type": "rectangle"
      }
    ] */
    ee.Geometry.Polygon(
        [[[-124.58837360718884, 42.24132567361335],
          [-124.58837360718884, 32.1623568470788],
          [-113.95360798218884, 32.1623568470788],
          [-113.95360798218884, 42.24132567361335]]], null, false);
var geometry = geometry2;
// Import conformal classifier inference functions
var infFunctions = require('users/geethensingh/conformal:inferenceConformalImageClassifier.js');

// Configuration parameters
var QHAT = 0.06067845112312009; // From calibration script

// List of probability band names
var bands = ee.List(['water', 'trees', 'grass', 'flooded_vegetation',
'crops', 'shrub_and_scrub', 'built', 'bare', 'snow_and_ice']);

// Data preparation - Spatio-temporal filtering
var dwFiltered = ee.ImageCollection("GOOGLE/DYNAMICWORLD/V1")
.filterDate('2020-01-01', '2021-01-01')
.filterBounds(geometry)
.reduce(ee.Reducer.firstNonNull()).aside(print)
.rename(bands.add('label'));

// Select probability bands
var dwp = dwFiltered.select(bands);
// Select label bands
var dwl = dwFiltered.select('label');

// Uncertainty Quantification
// inference function is mapped over every dynamic world image in the collection
var result = infFunctions.inference(dwp, bands, QHAT);

// Visualise results
// Map.centerObject(geometry, 7);
var palettes = require('users/gena/packages:palettes');
var palette = palettes.matplotlib.viridis[7];
var dwPalette = [
    '419BDF', '397D49', '88B053', '7A87C6', 'E49635', 'DFC35A',
    'C4281B', 'A59B8F', 'B39FE1'
  ];
var dwVisParams = {
  min: 0,
  max: 8,
  palette: dwPalette
};
// Visualise DW label image
Map.addLayer(dwl.reduce(ee.Reducer.firstNonNull()).clip(geometry),dwVisParams,'DW first non null labels');
// Visualise Set length (Uncertainty)
Map.addLayer(result.select('setLength').clip(geometry),{min:0, max:9, palette: palettes.matplotlib.viridis[7]}, 'Set lengths', false);
// Visualise Potential water pixels for entire year of 2020
Map.addLayer(result.select('water').clip(geometry), {min:0, max:1, bands: ['water']}, 'Potential water set', false, 1);

// Create and display legends(no changes required)
// set position of panel
var legend = ui.Panel({
  style: {
    position: 'bottom-left',
    padding: '8px 15px'
  }
});

// Create legend title
var legendTitle = ui.Label({
  value: 'Dynamic World',
  style: {
    fontWeight: 'bold',
    fontSize: '18px',
    margin: '0 0 4px 0',
    padding: '0'
    }
});

// Add the title to the panel
legend.add(legendTitle);

// Creates and styles 1 row of the legend.
var makeRow = function(color, name) {

      // Create the label that is actually the colored box.
      var colorBox = ui.Label({
        style: {
          backgroundColor: '#' + color,
          // Use padding to give the box height and width.
          padding: '8px',
          margin: '0 0 4px 0'
        }
      });

      // Create the label filled with the description text.
      var description = ui.Label({
        value: name,
        style: {margin: '0 0 4px 6px'}
      });

      // return the panel
      return ui.Panel({
        widgets: [colorBox, description],
        layout: ui.Panel.Layout.Flow('horizontal')
      });
};

function ColorBar(palette) {
  return ui.Thumbnail({
    image: ee.Image.pixelLonLat().select(0),
    params: {
      bbox: [0, 0, 1, 0.1],
      dimensions: '200x20',
      format: 'png',
      min: 0,
      max: 1,
      palette: palette,
    },
    style: {stretch: 'horizontal', margin: '0px 8px'},
  });
}
// Make Legend//
function makeLegend(low, mid, high, palette, title) {
  // Legend title
var legendTitle = ui.Label({
  value: title,
  style: {fontWeight: 'bold'}
});
  var labelPanel = ui.Panel(
      [
        ui.Label(low, {margin: '4px 8px'}),
        ui.Label(mid, {margin: '4px 8px', textAlign: 'center', stretch: 'horizontal'}),
        ui.Label(high, {margin: '4px 8px'})
      ],
      ui.Panel.Layout.flow('horizontal'));
  return ui.Panel({widgets:[legendTitle, ColorBar(palette), labelPanel],
  style: {
    position: 'bottom-left'
  }})}

//  Palette with the colors
var palette = dwPalette;

// name of the legend
var names = [
    'Water',
    'Trees',
    'Grass',
    'Flooded vegetation',
    'Crops',
    'Shrub and scrub',
    'Built',
    'Bare',
    'Snow and ice',
];

// Add color and and names
for (var i = 0; i < 9; i++) {
  legend.add(makeRow(palette[i], names[i]));
  }

// add legend to map (alternatively you can also print the legend to the console)
Map.add(legend);
Map.add(makeLegend(0,5,9, palettes.matplotlib.viridis[7], 'Uncertainty'));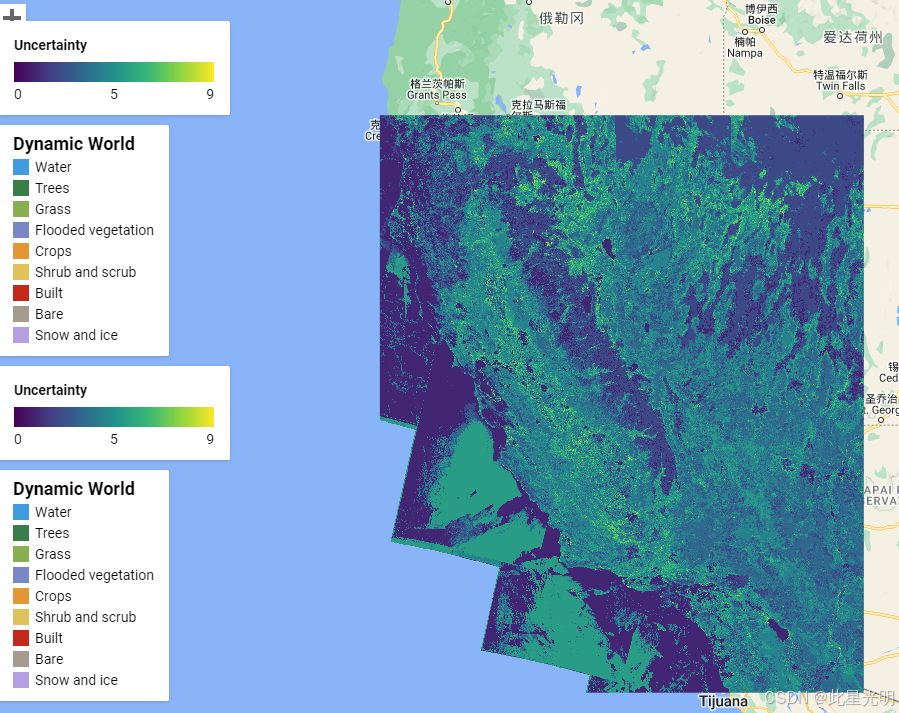
Python
GEE-Python 适应性分类器可以以类似于 JavaScript 模块的方式使用,必须通过克隆 GitHub 仓库来加载(如下所示)
参考代码
# 安装和导入安装包
%pip install watermark geemap geeml -q

!git clone https://github.com/Geethen/Invasive_Species_Mapping.git

import sys
sys.path.insert(0,'/content/Invasive_Species_Mapping/code')

# GEE授权
ee.Authenticate()
# 初始化 GEE
ee.Initialize(opt_url='https://earthengine-highvolume.googleapis.com')
更多示例代码
https://github.com/Geethen/GEEConformal/tree/main/example_usuage