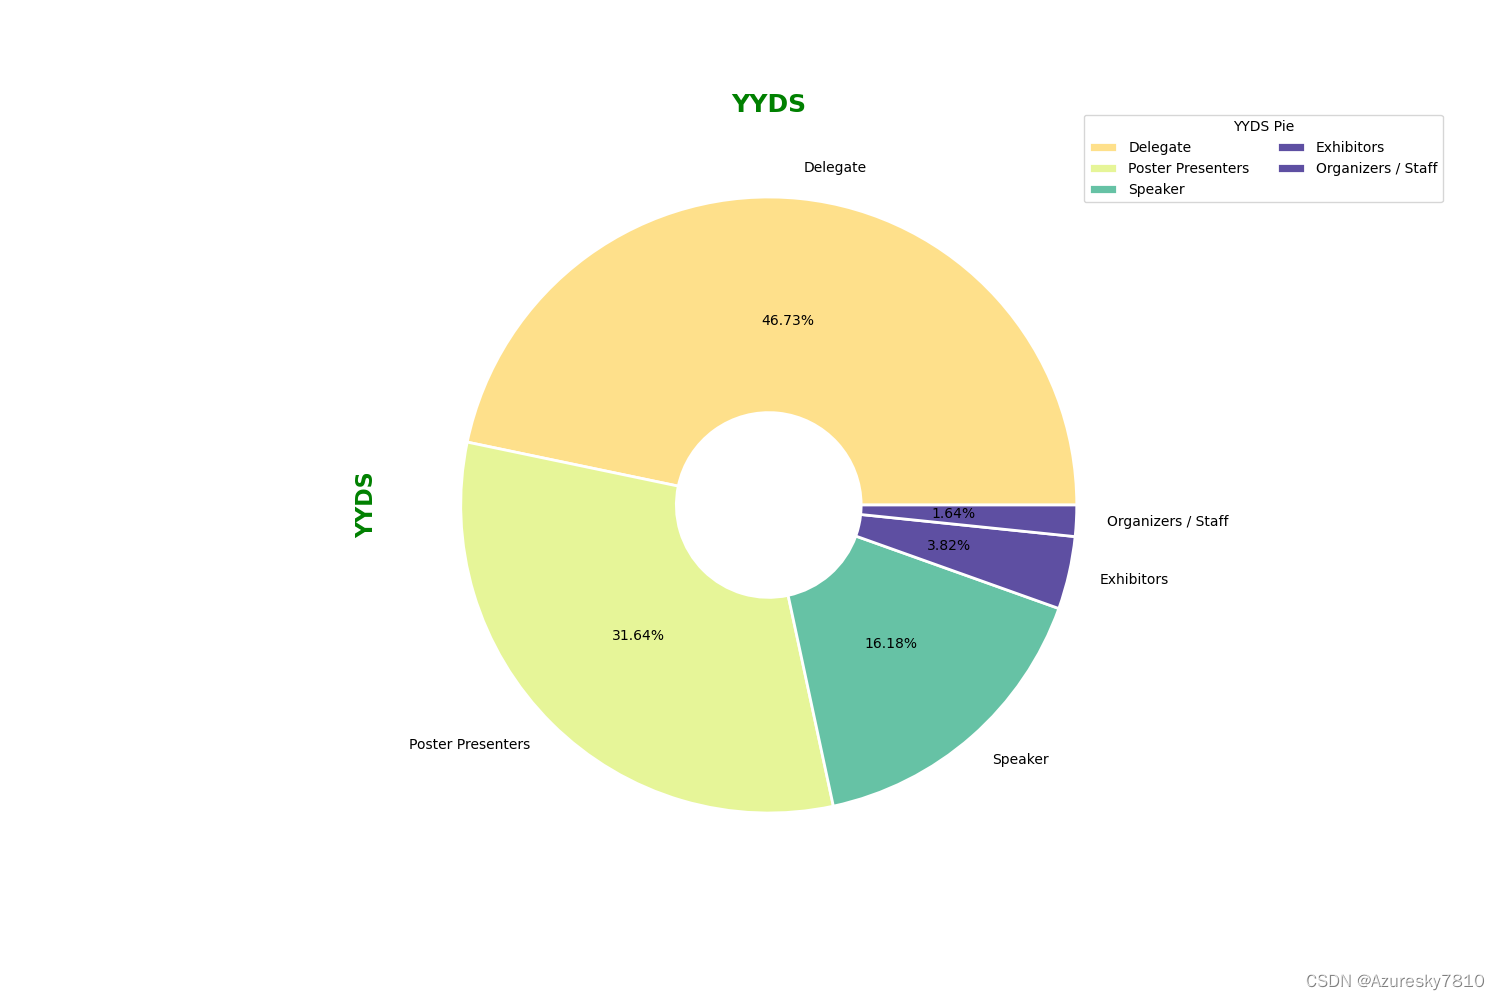
饼图示例
效果图

"""
Created on Mon Oct 18 15:34:53 2021
@author: luoha
"""
import pandas as pd
import matplotlib.pyplot as plt
import numpy as np
import pandas as pd
import matplotlib.pyplot as plt
users = pd.read_excel('E:\SXFEL\others\绘图\人数分类(1).xlsx')
print(users)
users.sort_values(by="number",inplace=True,ascending=False)
print(users)
df = users
labels = []
allpeople = sum(df['number'])
for i , k in zip(df['people'],df['number']):
j = i + "(" + str('{:.2%}'.format(k/allpeople)) + ")"
labels.append(j)
sizes = df['number']
rangestart = 2
colors = [plt.cm.Spectral(i/float(len(labels))) for i in range(rangestart,rangestart+len(labels))]
x=0; y=0
width = 2; height = 1
fig, ax = plt.subplots(1, figsize=(15, 15 * height / width))
ax.set_xlim(x, width)
ax.set_ylim(y, height)
patches, texts = plt.pie(x=sizes,labels=labels,colors=colors,startangle=0,rotatelabels=False, wedgeprops={'edgecolor':'w','width':0.7, 'linewidth':2})
plt.title('YYDS',fontweight='bold',fontsize='18',color='green')
plt.ylabel('YYDS',fontweight='bold',fontsize='16',color='green')
plt.legend(patches, labels,
title="YYDS Pie",
loc="center left",
bbox_to_anchor=(0.9, 0.7, 0.5, 0.5),
ncol=2,
)
plt.show()
plt.savefig("E:\SXFEL\others\绘图\PieChart7.png")
plt.savefig("E:\SXFEL\others\绘图\PieChart7.svg",format = 'svg')
表格内容
| people | number |
|---|
| Speaker | 89 |
| Poster Presenters | 174 |
| Delegate | 257 |
| Exhibitors | 21 |
| Organizers / Staff | 9 |
