本文是https://towardsdatascience.com/how-to-do-deep-learning-on-graphs-with-graph-convolutional-networks-7d2250723780第一部分A High-Level Introduction to Graph Convolutional Networks的翻译和总结,介绍了简单的Graph Convolutional Network,并以空手道俱乐部数据集为示例进行实现分析,部分添加修改。
What is a Graph Convolutional Network?
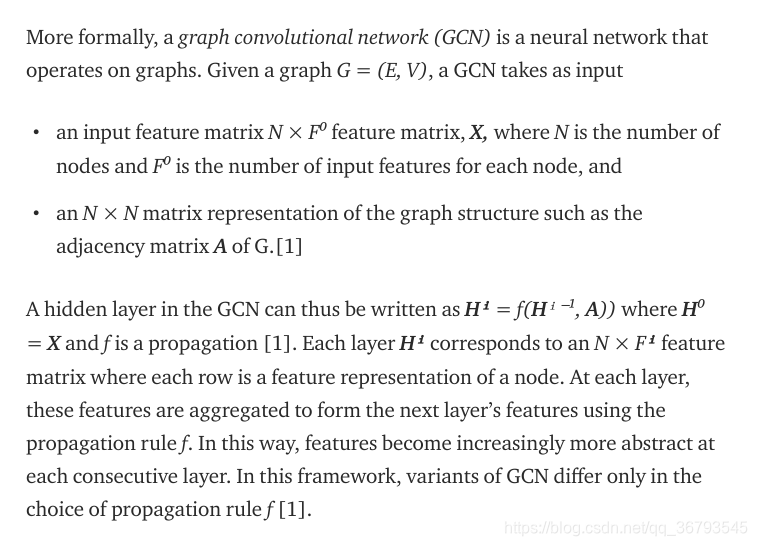
可以简单表示为
H
i
+
1
=
f
(
H
i
,
A
)
=
σ
(
A
H
i
W
i
)
H^{i+1} = f(H^i ,A) = \sigma(AH^{i}W^{i})
Hi+1=f(Hi,A)=σ(AHiWi)
A
:
(
N
,
N
)
邻
接
矩
阵
A: (N,N) 邻接矩阵
A:(N,N)邻接矩阵
F
i
:
一
维
数
值
,
第
i
层
的
特
征
树
目
F^{i}: 一维数值 ,第i层的特征树目
Fi:一维数值,第i层的特征树目
H
i
:
(
N
,
F
i
)
,
每
一
行
都
是
一
个
结
点
的
特
征
表
示
H^{i}: (N ,F^{i}) ,每一行都是一个结点的特征表示
Hi:(N,Fi),每一行都是一个结点的特征表示
X
=
H
0
:
(
N
,
F
0
)
,
输
入
向
量
X = H^{0} :(N,F^{0}),输入向量
X=H0:(N,F0),输入向量
W
i
:
(
F
i
,
F
i
+
1
)
第
i
层
的
权
值
矩
阵
W^{i}:(F^{i} ,F^{i+1})第i层的权值矩阵
Wi:(Fi,Fi+1)第i层的权值矩阵
A Simple Graph Example
以下图为例
A为该图的邻接矩阵
import numpy as np
A = np.matrix([  ##邻接矩阵
    [0, 1, 0, 0],
    [0, 0, 1, 1],
    [0, 1, 0, 0],
    [1, 0, 1, 0]],
    dtype=float
)
X为输入的特征向量,我们直接取值,维度为 ( N , F 0 ) (N ,F^0) (N,F0),其中N为结点个数, F 0 F^0 F0为输入向量的特征维数
X = np.matrix([
            [i, -i]
            for i in range(A.shape[0])
        ], dtype=float)
X
matrix([[ 0.,  0.],
        [ 1., -1.],
        [ 2., -2.],
        [ 3., -3.]])
A*X
matrix([[ 1., -1.],
        [ 5., -5.],
        [ 1., -1.],
        [ 2., -2.]])
我们可以发现,每行,就是每个结点的特征是它周围结点的特征和
比如,结点1和结点2,3邻接,所以A*X第2行 5 = [0, 0, 1, 1] *[0 ,1 ,2 ,3]T
但是有两点问题
- A*X的结点表示中,并没有加自己的特征值。只有有self-loop 的结构才会把自己特征值包含在内
- 邻接结点多的结点的特征值会大,少的特征值就小
第一个问题可以通过加Self-Loops来解决
I = np.matrix(np.eye(A.shape[0]))
I
matrix([[1., 0., 0., 0.],
        [0., 1., 0., 0.],
        [0., 0., 1., 0.],
        [0., 0., 0., 1.]])
A_hat = A + I
A_hat * X
matrix([[ 1., -1.],
        [ 6., -6.],
        [ 3., -3.],
        [ 5., -5.]])
第二个问题可以通过归一化特征表示来解决
原因见https://tkipf.github.io/graph-convolutional-networks/
D = np.array(np.sum(A, axis=0))[0]
D = np.matrix(np.diag(D))
D
matrix([[1., 0., 0., 0.],
        [0., 2., 0., 0.],
        [0., 0., 2., 0.],
        [0., 0., 0., 1.]])
归一化前
A
matrix([[0., 1., 0., 0.],
        [0., 0., 1., 1.],
        [0., 1., 0., 0.],
        [1., 0., 1., 0.]])
归一化后
D**-1 * A
matrix([[0. , 1. , 0. , 0. ],
        [0. , 0. , 0.5, 0.5],
        [0. , 0.5, 0. , 0. ],
        [1. , 0. , 1. , 0. ]])
D**-1 * A * X
matrix([[ 1. , -1. ],
        [ 2.5, -2.5],
        [ 0.5, -0.5],
        [ 2. , -2. ]])
Putting it All Together
接下来我们把两个改进方案都运用起来
A_hat  = A + I
D_hat = np.array(np.sum(A_hat, axis=0))[0]
D_hat = np.matrix(np.diag(D_hat))
D_hat
matrix([[2., 0., 0., 0.],
        [0., 3., 0., 0.],
        [0., 0., 3., 0.],
        [0., 0., 0., 2.]])
W = np.matrix([
             [1, -1],
             [-1, 1]
         ])
X
matrix([[ 0.,  0.],
        [ 1., -1.],
        [ 2., -2.],
        [ 3., -3.]])
D_hat**-1 * A_hat*X*W
matrix([[ 1., -1.],
        [ 4., -4.],
        [ 2., -2.],
        [ 5., -5.]])
Back to Reality
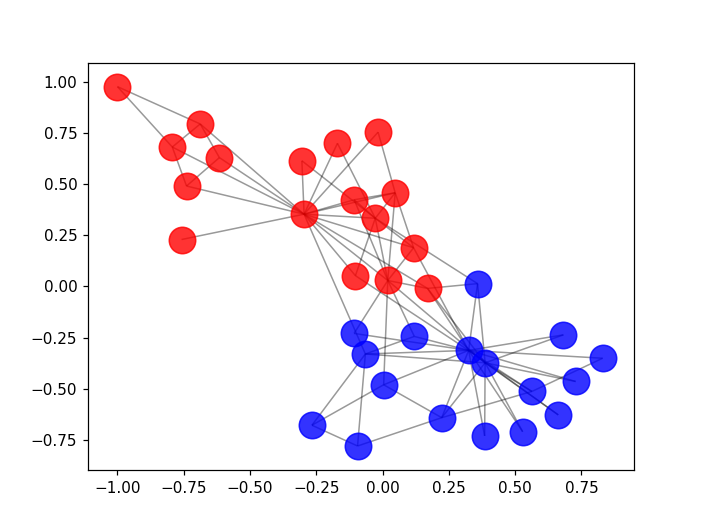
现在我们在现实中的网络中运用图卷集网络(graph convolutional network技术。选取的网络为空手道俱乐部数据集(karate_club_graph)。
from networkx import to_numpy_matrix
import networkx as nx
zkc = nx.karate_club_graph()
order = sorted(list(zkc.nodes()))
A = to_numpy_matrix(zkc, nodelist=order)
I = np.eye(zkc.number_of_nodes())
A_hat = A + I
D_hat = np.array(np.sum(A_hat, axis=0))[0]
D_hat = np.matrix(np.diag(D_hat))
def plot_graph(G, weight_name=None):
    '''
    G: a networkx G
    weight_name: name of the attribute for plotting edge weights (if G is weighted)
    '''
    %matplotlib notebook
    import matplotlib.pyplot as plt

    plt.figure()
    pos = nx.spring_layout(G)
    edges = G.edges()
    weights = None

    if weight_name:
        weights = [int(G[u][v][weight_name]) for u,v in edges]
        labels = nx.get_edge_attributes(G,weight_name)
        nx.draw_networkx_edge_labels(G,pos,edge_labels=labels)
        nx.draw_networkx(G, pos, edges=edges, width=weights);
    else:
        nodelist1 = []
        nodelist2 = []
        for i in range (34):
            if zkc.nodes[i]['club'] == 'Mr. Hi':
                nodelist1.append(i)
            else:
                nodelist2.append(i)
        #nx.draw_networkx(G, pos, edges=edges);
        nx.draw_networkx_nodes(G, pos, nodelist=nodelist1, node_size=300, node_color='r',alpha = 0.8)
        nx.draw_networkx_nodes(G, pos, nodelist=nodelist2, node_size=300, node_color='b',alpha = 0.8)
        nx.draw_networkx_edges(G, pos, edgelist=edges,alpha =0.4)
plot_graph(zkc)
<IPython.core.display.Javascript object>

W_1 = np.random.normal(
    loc=0, scale=1, size=(zkc.number_of_nodes(), 4))
W_2 = np.random.normal(
    loc=0, size=(W_1.shape[1], 2))
def relu(x):
    return (abs(x) + x) / 2
def gcn_layer(A_hat, D_hat, X, W):
    return relu(D_hat**-1 * A_hat * X * W)
H_1 = gcn_layer(A_hat, D_hat, I, W_1)
H_2 = gcn_layer(A_hat, D_hat, H_1, W_2)
output = H_2
feature_representations = {
    node: np.array(output)[node]
    for node in zkc.nodes()}
feature_representations
{0: array([0.88602091, 0.34237275]),
 1: array([0.40862582, 0.        ]),
 2: array([0.38693926, 0.        ]),
 3: array([0.19478099, 0.10516756]),
 4: array([0.82815959, 0.41738152]),
 5: array([1.1971192 , 0.46978126]),
 6: array([1.2271154 , 0.63378424]),
 7: array([0., 0.]),
 8: array([0.11110005, 0.        ]),
 9: array([0., 0.]),
 10: array([0.6209274 , 0.26495055]),
 11: array([1.60869786, 0.79829349]),
 12: array([0.35029305, 0.56226336]),
 13: array([0.02171053, 0.        ]),
 14: array([0.        , 0.02638456]),
 15: array([0.06979159, 0.68002892]),
 16: array([1.7675629 , 0.82039984]),
 17: array([0.50286326, 0.        ]),
 18: array([0.31509428, 0.29327311]),
 19: array([0.37260057, 0.        ]),
 20: array([0., 0.]),
 21: array([0.70826438, 0.10767323]),
 22: array([0.15022781, 0.25590783]),
 23: array([0.17645064, 0.16650816]),
 24: array([0.29110197, 0.20382017]),
 25: array([0.18688296, 0.14564473]),
 26: array([0.02367803, 0.17550985]),
 27: array([0., 0.]),
 28: array([0.51547931, 0.        ]),
 29: array([0.05318727, 0.16647217]),
 30: array([0.31639705, 0.        ]),
 31: array([0.24761528, 0.03619812]),
 32: array([0.48872535, 0.31039692]),
 33: array([0.62804696, 0.26496685])}
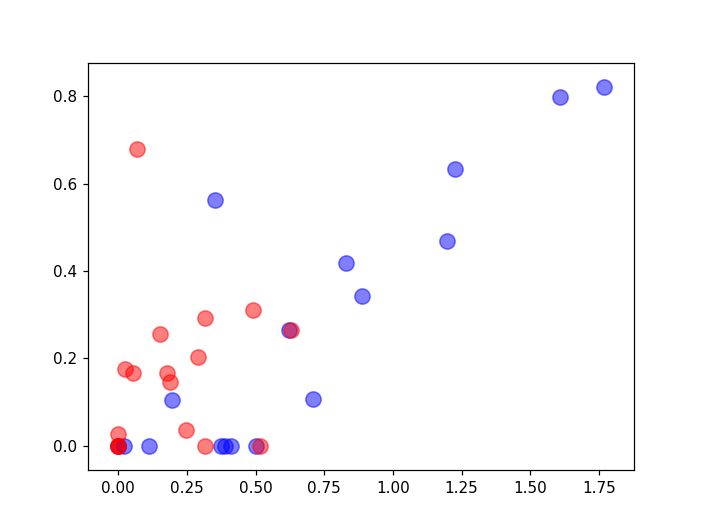
import matplotlib.pyplot as plt
%matplotlib notebook
for i in range (34):
    if zkc.nodes[i]['club'] == 'Mr. Hi':
        plt.scatter(np.array(output)[i,0],np.array(output)[i,1] ,color = 'b',alpha=0.5,s = 100)
    else:
        plt.scatter(np.array(output)[i,0],np.array(output)[i,1] ,color = 'r',alpha=0.5,s = 100)
#plt.scatter(np.array(output)[:,0],np.array(output)[:,1])
<IPython.core.display.Javascript object>

目前来看,这个映射分类效果并不好,待我后续分析补充吧。


