使用决策树,预测贷款申请
import pandas as pd
#  忽略弹出的warnings
import warnings
warnings.filterwarnings('ignore')
text=pd.read_excel('data/LoanStats_securev1_2019Q4.xlsx')
text.head()
| id | loan_amnt | funded_amnt | funded_amnt_inv | term | int_rate | installment | grade | sub_grade | emp_title | ... | num_tl_90g_dpd_24m | num_tl_op_past_12m | pct_tl_nvr_dlq | percent_bc_gt_75 | pub_rec_bankruptcies | tax_liens | tot_hi_cred_lim | total_bal_ex_mort | total_bc_limit | total_il_high_credit_limit | |
|---|---|---|---|---|---|---|---|---|---|---|---|---|---|---|---|---|---|---|---|---|---|
| 0 | 164027473 | 20000 | 20000 | 20000 | 36 months | 0.1240 | 668.12 | B | B4 | NaN | ... | 0 | 2 | 100.0 | 50.0 | 1 | 0 | 60800 | 42566 | 5200 | 40000.0 |
| 1 | 163984413 | 16500 | 16500 | 16500 | 60 months | 0.1033 | 353.27 | B | B1 | NaN | ... | 0 | 0 | 100.0 | 0.0 | 0 | 0 | 223390 | 40913 | 40500 | 39890.0 |
| 2 | 164193225 | 7500 | 7500 | 7500 | 36 months | 0.1240 | 250.55 | B | B4 | Rn | ... | 0 | 7 | 54.5 | 16.7 | 0 | 0 | 138468 | 102122 | 47700 | 90768.0 |
| 3 | 162948736 | 19000 | 19000 | 18975 | 36 months | 0.0646 | 581.99 | A | A1 | Tech Ops Analyst | ... | 0 | 0 | 100.0 | 40.0 | 0 | 0 | 184034 | 28461 | 38400 | 35000.0 |
| 4 | 164161686 | 10000 | 10000 | 10000 | 36 months | 0.2055 | 374.45 | D | D2 | Planner | ... | 0 | 2 | 100.0 | 16.7 | 0 | 0 | 639373 | 161516 | 24600 | 172818.0 |
5 rows × 114 columns
目标变量
text['loan_status'].value_counts()
Current               122625
Fully Paid              3539
In Grace Period         1079
Late (31-120 days)       509
Late (16-30 days)        304
Charged Off               80
n                          1
Name: loan_status, dtype: int64
#0为已经完成的
def function(x):
    if 'Current' in x:
        return 0
    elif 'Fully Paid' in x:
        return 0
    else:
        return 1
text['loan_status']=text.apply(lambda x:function(x['loan_status']),axis=1)
text['loan_status'].value_counts()
0    126164
1      1973
Name: loan_status, dtype: int64
pos_trainDf = text[text['loan_status'] == 1]
neg_trainDf = text[text['loan_status'] == 0].sample(n=4000, random_state=2018)
text = pd.concat([pos_trainDf, neg_trainDf], axis=0).sample(frac=1.0,random_state=2018)
text.info()
<class 'pandas.core.frame.DataFrame'>
Int64Index: 5973 entries, 18821 to 92872
Columns: 114 entries, id to total_il_high_credit_limit
dtypes: datetime64[ns](1), float64(36), int64(50), object(27)
memory usage: 5.2+ MB
缺失值查看
check_null = text.isnull().sum(axis=0).sort_values(ascending=False)/float(len(text)) #查看缺失值比例
print(check_null[check_null >0.2]) # 查看缺失比例大于20%的属性。
desc                              0.999833
mths_since_last_record            0.899046
verification_status_joint         0.880629
annual_inc_joint                  0.864055
dti_joint                         0.864055
mths_since_recent_bc_dlq          0.794408
mths_since_last_major_derog       0.769965
mths_since_recent_revol_delinq    0.703164
mths_since_last_delinq            0.548468
dtype: float64
thresh_count = len(text)*0.4 # 设定阀值
data = text.dropna(thresh=thresh_count, axis=1 ) #若某一列数据缺失的数量超过阀值就会被删除
data.info()
<class 'pandas.core.frame.DataFrame'>
Int64Index: 5973 entries, 18821 to 92872
Columns: 106 entries, id to total_il_high_credit_limit
dtypes: datetime64[ns](1), float64(30), int64(50), object(25)
memory usage: 4.9+ MB
删除无意义的列
sub_grade:与Grade的信息重复
emp_title :缺失值较多,同时不能反映借款人收入或资产的真实情况
zip_code:地址邮编,邮编显示不全,没有意义
addr_state:申请地址所属州,不能反映借款人的偿债能力
last_credit_pull_d :LendingClub平台最近一个提供贷款的时间,没有意义
policy_code : 变量信息全为1
pymnt_plan 基本是n
title: title与purpose的信息重复,同时title的分类信息更加离散
next_pymnt_d : 下一个付款时间,没有意义
policy_code : 没有意义
collection_recovery_fee: 全为0,没有意义
earliest_cr_line : 记录的是借款人发生第一笔借款的时间
issue_d : 贷款发行时间,这里提前向模型泄露了信息
last_pymnt_d、collection_recovery_fee、last_pymnt_amnt: 预测贷款违约模型是贷款前的风险控制手段,这些贷后信息都会影响我们训练模型的效果,在此将这些信息删除
drop_list = ['sub_grade', 'emp_title',  'title', 'zip_code', 'addr_state',
             'mths_since_last_delinq' ,'initial_list_status','title','issue_d','last_pymnt_d','last_pymnt_amnt',
             'next_pymnt_d','last_credit_pull_d','policy_code','collection_recovery_fee', 'earliest_cr_line']
data.drop(drop_list, axis=1, inplace = True)
data.head()
| id | loan_amnt | funded_amnt | funded_amnt_inv | term | int_rate | installment | grade | emp_length | home_ownership | ... | num_tl_90g_dpd_24m | num_tl_op_past_12m | pct_tl_nvr_dlq | percent_bc_gt_75 | pub_rec_bankruptcies | tax_liens | tot_hi_cred_lim | total_bal_ex_mort | total_bc_limit | total_il_high_credit_limit | |
|---|---|---|---|---|---|---|---|---|---|---|---|---|---|---|---|---|---|---|---|---|---|
| 18821 | 163425898 | 4500 | 4500 | 4500 | 36 months | 0.1612 | 158.48 | C | NaN | RENT | ... | 0 | 2 | 100.0 | 28.6 | 0 | 0 | 44700 | 10872 | 32800 | 0.0 |
| 61234 | 161908366 | 20000 | 20000 | 20000 | 60 months | 0.2305 | 564.39 | D | NaN | OWN | ... | 0 | 0 | 100.0 | 33.3 | 0 | 0 | 54349 | 19572 | 10400 | 22349.0 |
| 119781 | 159901427 | 10000 | 10000 | 10000 | 60 months | 0.1862 | 257.32 | D | 6 years | OWN | ... | 0 | 3 | 100.0 | 0.0 | 0 | 0 | 69077 | 48184 | 9600 | 49477.0 |
| 49201 | 162292591 | 21000 | 21000 | 21000 | 60 months | 0.1430 | 491.91 | C | < 1 year | RENT | ... | 0 | 0 | 100.0 | 0.0 | 0 | 0 | 109894 | 66662 | 33800 | 67194.0 |
| 53727 | 162154208 | 40000 | 40000 | 40000 | 60 months | 0.0819 | 814.70 | A | 10+ years | RENT | ... | 0 | 0 | 100.0 | 50.0 | 0 | 0 | 207370 | 160985 | 98000 | 61725.0 |
5 rows × 91 columns
分类变量
objectColumns = data.select_dtypes(include=["object"]).columns
data[objectColumns].isnull().sum().sort_values(ascending=False)
emp_length             572
application_type         1
url                      1
total_acc                0
delinq_2yrs              0
purpose                  0
pymnt_plan               0
verification_status      0
annual_inc               0
home_ownership           0
grade                    0
term                     0
dtype: int64
# data['int_rate'] = data['int_rate'].str.rstrip('%').astype('float')
# data['revol_util'] = data['revol_util'].str.rstrip('%').astype('float')
# data['annual_inc'] = data['annual_inc'].str.replace(",","").astype('float')
import numpy as np
objectColumns = data.select_dtypes(include=["object"]).columns # 筛选数据类型为object的数据
data[objectColumns] = data[objectColumns].fillna("Unknown") #以分类“Unknown”填充缺失值
import missingno as msno
import matplotlib as mpl
mpl.rcParams['font.sans-serif']=[u'simHei']
mpl.rcParams['axes.unicode_minus']=False
%matplotlib inline
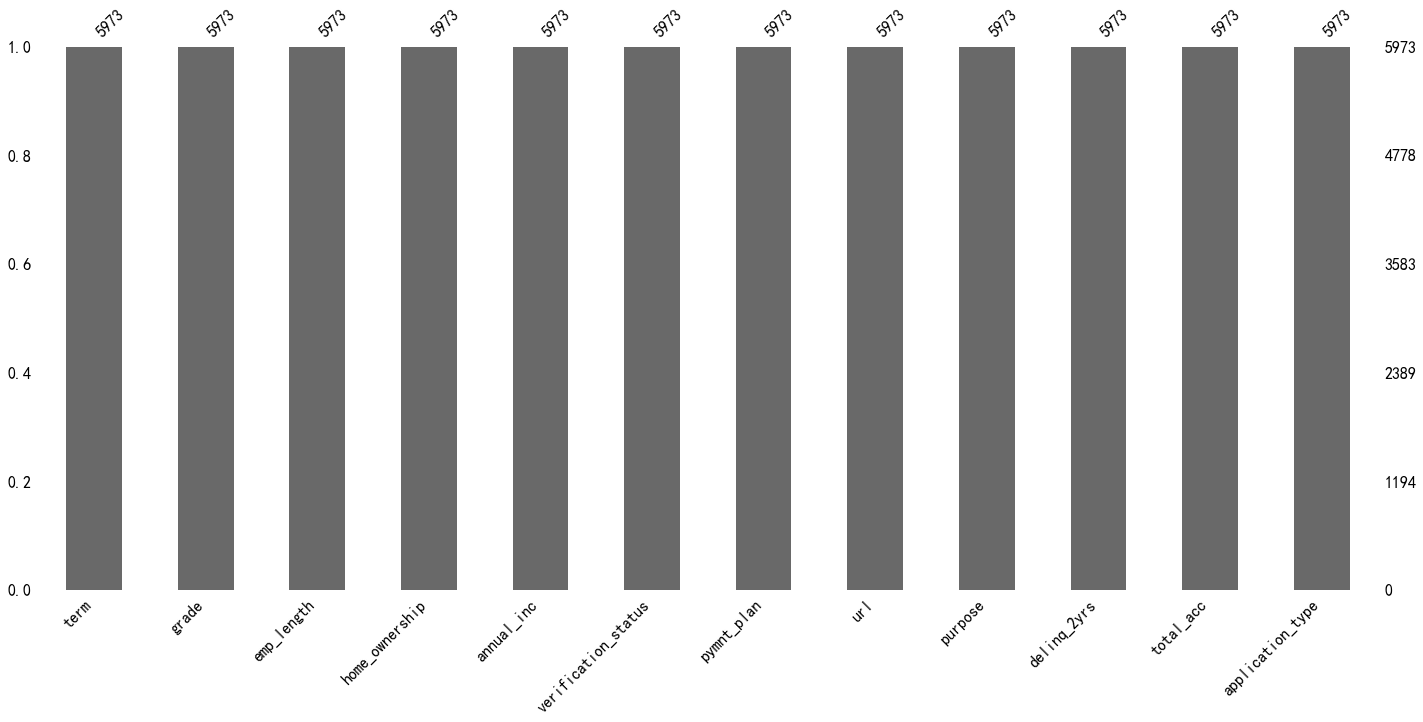
msno.bar(data[objectColumns]) #可视化
<matplotlib.axes._subplots.AxesSubplot at 0x2cacc08aa20>
mapping_dict = {
    "emp_length": {
        "10+ years": 10,
        "9 years": 9,
        "8 years": 8,
        "7 years": 7,
        "6 years": 6,
        "5 years": 5,
        "4 years": 4,
        "3 years": 3,
        "2 years": 2,
        "1 year": 1,
        "< 1 year": 0,
        "n/a": 0
    },
    "grade":{
        "A": 1,
        "B": 2,
        "C": 3,
        "D": 4,
        "E": 5,
        "F": 6,
        "G": 7
    }
}
data = data.replace(mapping_dict) #变量映射
数值类型缺失值
data.select_dtypes(include=[np.number]).isnull().sum().sort_values(ascending=False)
il_util                  883
mths_since_recent_inq    655
mo_sin_old_il_acct       203
mths_since_rcnt_il       203
bc_util                  109
                        ...
total_cu_tl                0
inq_fi                     0
total_rev_hi_lim           0
total_bc_limit             0
id                         0
Length: 80, dtype: int64
numColumns = data.select_dtypes(include=[np.number]).columns
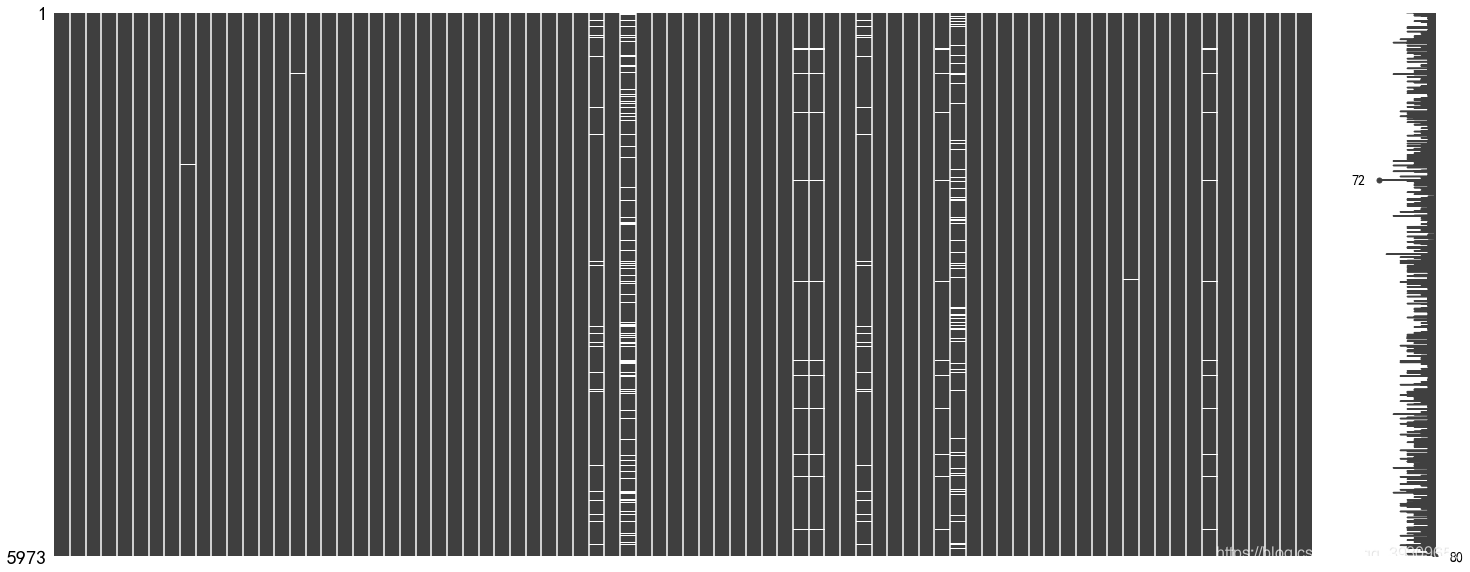
msno.matrix(data[numColumns]) #缺失值可视化
<matplotlib.axes._subplots.AxesSubplot at 0x2caecfe1160>
data.select_dtypes(include=[np.number])
| id | loan_amnt | funded_amnt | funded_amnt_inv | int_rate | installment | grade | loan_status | dti | fico_range_low | ... | num_tl_90g_dpd_24m | num_tl_op_past_12m | pct_tl_nvr_dlq | percent_bc_gt_75 | pub_rec_bankruptcies | tax_liens | tot_hi_cred_lim | total_bal_ex_mort | total_bc_limit | total_il_high_credit_limit | |
|---|---|---|---|---|---|---|---|---|---|---|---|---|---|---|---|---|---|---|---|---|---|
| 18821 | 163425898 | 4500 | 4500 | 4500 | 0.1612 | 158.48 | 3 | 1 | 16.13 | 705 | ... | 0 | 2 | 100.0 | 28.6 | 0 | 0 | 44700 | 10872 | 32800 | 0.0 |
| 61234 | 161908366 | 20000 | 20000 | 20000 | 0.2305 | 564.39 | 4 | 0 | 34.14 | 735 | ... | 0 | 0 | 100.0 | 33.3 | 0 | 0 | 54349 | 19572 | 10400 | 22349.0 |
| 119781 | 159901427 | 10000 | 10000 | 10000 | 0.1862 | 257.32 | 4 | 0 | 27.84 | 680 | ... | 0 | 3 | 100.0 | 0.0 | 0 | 0 | 69077 | 48184 | 9600 | 49477.0 |
| 49201 | 162292591 | 21000 | 21000 | 21000 | 0.1430 | 491.91 | 3 | 1 | 21.82 | 740 | ... | 0 | 0 | 100.0 | 0.0 | 0 | 0 | 109894 | 66662 | 33800 | 67194.0 |
| 53727 | 162154208 | 40000 | 40000 | 40000 | 0.0819 | 814.70 | 1 | 0 | 27.52 | 700 | ... | 0 | 0 | 100.0 | 50.0 | 0 | 0 | 207370 | 160985 | 98000 | 61725.0 |
| ... | ... | ... | ... | ... | ... | ... | ... | ... | ... | ... | ... | ... | ... | ... | ... | ... | ... | ... | ... | ... | ... |
| 86547 | 160719957 | 30000 | 30000 | 30000 | 0.0819 | 611.03 | 1 | 0 | 5.68 | 740 | ... | 0 | 2 | 100.0 | 40.0 | 0 | 0 | 361548 | 46148 | 94500 | 0.0 |
| 69734 | 161401437 | 16000 | 16000 | 16000 | 0.1430 | 549.18 | 3 | 1 | 13.73 | 660 | ... | 0 | 0 | 90.9 | 66.7 | 0 | 0 | 21300 | 15022 | 7800 | 6000.0 |
| 30947 | 162968064 | 1600 | 1600 | 1600 | 0.1102 | 52.40 | 2 | 0 | 17.32 | 715 | ... | 0 | 1 | 100.0 | 50.0 | 0 | 0 | 63659 | 41808 | 27200 | 30259.0 |
| 29039 | 163064608 | 10000 | 10000 | 10000 | 0.1240 | 334.06 | 2 | 0 | 22.91 | 680 | ... | 0 | 2 | 66.7 | 0.0 | 0 | 0 | 230024 | 36479 | 2900 | 60846.0 |
| 92872 | 160838177 | 23000 | 23000 | 23000 | 0.1774 | 580.81 | 3 | 1 | 0.00 | 800 | ... | 0 | 0 | 100.0 | 0.0 | 0 | 0 | 85255 | 0 | 600 | 0.0 |
5973 rows × 80 columns
data.isnull().sum().sum()
mean_cols=data.mean()
data= data.fillna(mean_cols)
目标变量
y=data['loan_status']
x=data.drop(['loan_status'],axis=1)
#使用pandas库将类别变量编码
x =pd.get_dummies(x)
n_sample = y.shape[0]
n_pos_sample = y[y == 0].shape[0]
n_neg_sample = y[y == 1].shape[0]
print('样本个数:{}; 正样本占{:.2%}; 负样本占{:.2%}'.format(n_sample,
                                                   n_pos_sample / n_sample,
                                                   n_neg_sample / n_sample))
print('特征维数:', x.shape[1])
样本个数:5973; 正样本占66.97%; 负样本占33.03%
特征维数: 7167
特征工程
#数据进行分割(训练数据和测试数据)
from sklearn.model_selection  import train_test_split#测试集和训练集
x_train1, x_test1, y_train1, y_test1 = train_test_split(x, y, train_size=0.8, random_state=14)
x_train, x_test, y_train, y_test = x_train1, x_test1, y_train1, y_test1
print ("训练数据集样本数目:%d, 测试数据集样本数目:%d" % (x_train.shape[0], x_test.shape[0]))
y_train = y_train.astype(np.int)
y_test = y_test.astype(np.int)
训练数据集样本数目:4778, 测试数据集样本数目:1195
#参数优化
from sklearn.pipeline import Pipeline #管道
from sklearn.model_selection import GridSearchCV #网格搜索交叉验证,用于选择最优的参数
from sklearn.preprocessing import MinMaxScaler
from sklearn.decomposition import PCA
pipes =Pipeline([
            ('mms', MinMaxScaler()), ## 归一化操作
            ('pca', PCA()), ## 降纬
            ('RandomForestClassifier', RandomForestClassifier(criterion='gini'))
        ])
# 参数
#
# estimators = [1,50,100,500]
# depth = [1,2,3,7,15]
parameters = [
    {
    "pca__n_components": [1,2,3,4],
    "RandomForestClassifier__n_estimators":[1,50,100,500],
    "RandomForestClassifier__max_depth":[1,2,3,7,15]
    }
]
#获取数据
x_train2, x_test2, y_train2, y_test2 = x_train1, x_test1, y_train1, y_test1
gscv = GridSearchCV(pipes, param_grid=parameters)
gscv.fit(x_train2, y_train2)
print ("score值:",gscv.best_score_,"最优参数列表:", gscv.best_params_)
score值: 0.6720405704396591 最优参数列表: {'RandomForestClassifier__max_depth': 7, 'RandomForestClassifier__n_estimators': 500, 'pca__n_components': 4}
#标准化
ss = MinMaxScaler()#分类模型,经常使用的是minmaxscaler归一化,回归模型经常用standardscaler
x_train = ss.fit_transform(x_train, y_train)
x_test = ss.transform(x_test)
x_train.shape
(4778, 7167)
#降维
from sklearn.decomposition import PCA
pca = PCA(n_components=4)
x_train = pca.fit_transform(x_train)
x_test = pca.transform(x_test)
x_train.shape
print(pca.explained_variance_ratio_)
[0.08187674 0.05705152 0.05380546 0.04683824]
#随机森林模型
from sklearn.ensemble import RandomForestClassifier
forest = RandomForestClassifier(n_estimators=2000, criterion='gini', max_depth=7, random_state=0)
forest.fit(x_train, y_train)#max_depth一般不宜设置过大,把每个模型作为一个弱分类器
RandomForestClassifier(bootstrap=True, ccp_alpha=0.0, class_weight=None,
                       criterion='gini', max_depth=7, max_features='auto',
                       max_leaf_nodes=None, max_samples=None,
                       min_impurity_decrease=0.0, min_impurity_split=None,
                       min_samples_leaf=1, min_samples_split=2,
                       min_weight_fraction_leaf=0.0, n_estimators=2000,
                       n_jobs=None, oob_score=False, random_state=0, verbose=0,
                       warm_start=False)
#模型效果评估
from sklearn import metrics
from sklearn.metrics import roc_curve, auc
score = forest.score(x_test, y_test)
print ("准确率:%.2f%%" % (score * 100))
#模型预测
y_score = forest.predict(x_test)# prodict_proba输出概率
准确率:66.78%
# Compute ROC curve and ROC area for each class
import matplotlib.pyplot as plt
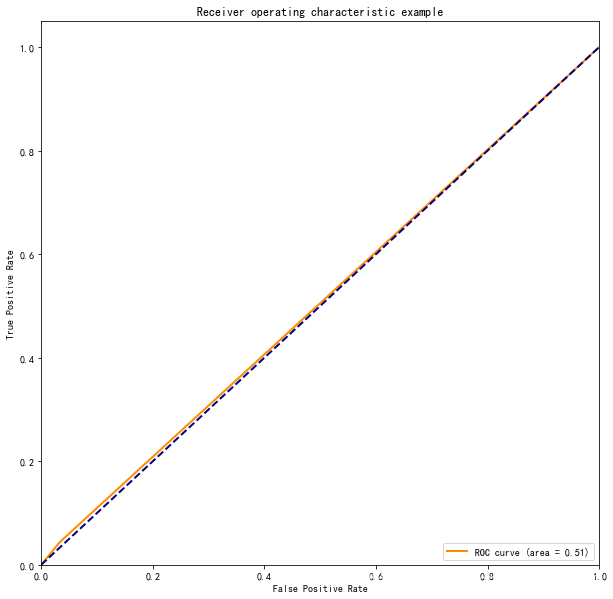
fpr,tpr,threshold = roc_curve(y_test, y_score) ###计算真正率和假正率
roc_auc = auc(fpr,tpr) ###计算auc的值
print('auc:%.2f'%(roc_auc))
auc:0.51
plt.figure()
lw = 2
plt.figure(figsize=(10,10))
plt.plot(fpr, tpr, color='darkorange',
         lw=lw, label='ROC curve (area = %0.2f)' % roc_auc) ###假正率为横坐标,真正率为纵坐标做曲线
plt.plot([0, 1], [0, 1], color='navy', lw=lw, linestyle='--')
plt.xlim([0.0, 1.0])
plt.ylim([0.0, 1.05])
plt.xlabel('False Positive Rate')
plt.ylabel('True Positive Rate')
plt.title('Receiver operating characteristic example')
plt.legend(loc="lower right")
plt.show()
<Figure size 432x288 with 0 Axes>
决策树
#参数优化
from sklearn.tree import DecisionTreeClassifier
pipe = Pipeline([
            ('mms', MinMaxScaler()),
            ('pca', PCA()),
            ('decision', DecisionTreeClassifier(random_state=0))
        ])

# 参数
parameters = {
    "pca__n_components": [0.5,0.99],#设置为浮点数代表主成分方差所占最小比例的阈值
    "decision__criterion": ["gini", "entropy"],
    "decision__max_depth": [1,2,3,4,5,6,7,8,9,10]
}
#数据
x_train2, x_test2, y_train2, y_test2 = x_train1, x_test1, y_train1, y_test1
#模型构建:通过网格交叉验证,寻找最优参数列表, param_grid可选参数列表,cv:进行几折交叉验证
gscv = GridSearchCV(pipe, param_grid=parameters,cv=3)
#模型训练
gscv.fit(x_train2, y_train2)
#算法的最优解
print("最优参数列表:", gscv.best_params_)
print("score值:",gscv.best_score_)
最优参数列表: {'decision__criterion': 'gini', 'decision__max_depth': 4, 'pca__n_components': 0.99}
score值: 0.6917121178186392
#降维
from sklearn.decomposition import PCA
pca = PCA(n_components= 0.99)
x_train = pca.fit_transform(x_train)
x_test = pca.transform(x_test)
x_train.shape
print(pca.explained_variance_ratio_)
[0.34176263 0.23813938 0.22458996 0.19550803]
tree = DecisionTreeClassifier(criterion='gini', max_depth=4)
tree.fit(x_train, y_train) # fit模型训练
# 模型相关的指标输出
# print("训练集上的准确率:%.3f" % tree.score(x_train, y_train))
y_hat = tree.predict(x_test) # 获取预测值
print("准确率:%.3f" % (np.mean(y_hat == y_test)))
准确率:0.671
# Compute ROC curve and ROC area for each class
import matplotlib.pyplot as plt
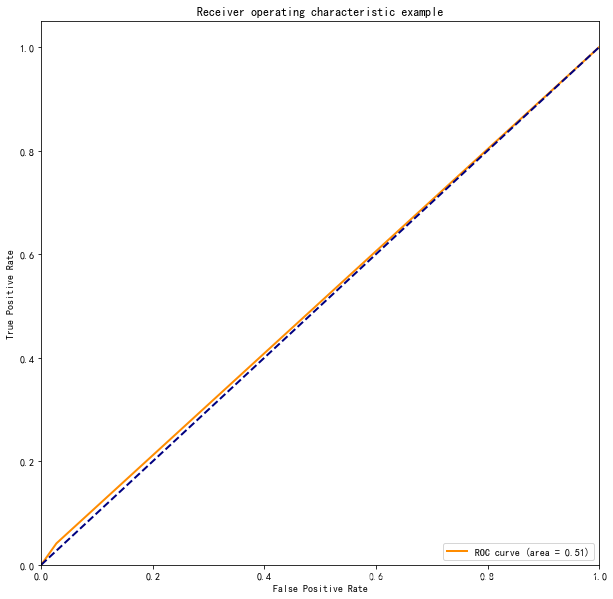
fpr,tpr,threshold = roc_curve(y_test, y_hat) ###计算真正率和假正率
roc_auc = auc(fpr,tpr) ###计算auc的值
print('auc:%.2f'%(roc_auc))
auc:0.51
plt.figure()
lw = 2
plt.figure(figsize=(10,10))
plt.plot(fpr, tpr, color='darkorange',
         lw=lw, label='ROC curve (area = %0.2f)' % roc_auc) ###假正率为横坐标,真正率为纵坐标做曲线
plt.plot([0, 1], [0, 1], color='navy', lw=lw, linestyle='--')
plt.xlim([0.0, 1.0])
plt.ylim([0.0, 1.05])
plt.xlabel('False Positive Rate')
plt.ylabel('True Positive Rate')
plt.title('Receiver operating characteristic example')
plt.legend(loc="lower right")
plt.show()
<Figure size 432x288 with 0 Axes>


