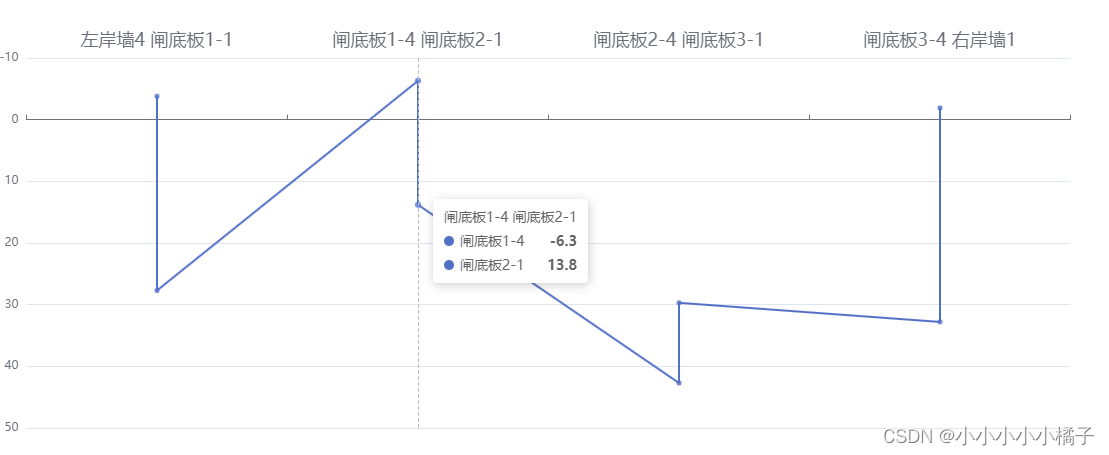
应业务要求,需要制作如上图样式的图表,做下记录
数据格式如下
const arr = [
    {
        "number": "1-4",
        "cumulativeDisplacement": "-6.3",
        "part": "闸底板"
    },
     {
        "number": "2-1",
        "cumulativeDisplacement": "13.8",
        "part": "闸底板"
    }
]
数据处理方法
chartDataFun(arr) {
      const routeData = []
      const newSeriesData = []
      const xData = []
      arr.forEach((obj, index) => {
        const even = index % 2 === 0
        const newObj = {
          name: obj.part + obj.number,
          symbolSize: 5,
          data: [
            [
              // 如果true  ? 当前 + 下一个  : 当前 + 上一个
              even
                ? obj.part + obj.number + ' ' + arr[index + 1].part + arr[index + 1].number
                : arr[index - 1].part + arr[index - 1].number + ' ' + obj.part + obj.number,
              obj.cumulativeDisplacement] ],
          type: 'scatter'
        }
        newSeriesData.push(newObj)
        routeData.push([even
          ? obj.part + obj.number + ' ' + arr[index + 1].part + arr[index + 1].number
          : arr[index - 1].part + arr[index - 1].number + ' ' + obj.part + obj.number,
        obj.cumulativeDisplacement])
        if (even) { xData.push(obj.part + obj.number + ' ' + arr[index + 1].part + arr[index + 1].number) }
      })

      const routeLineData = []
      routeData.forEach((item, index) => {
        if (index !== routeData.length - 1) {
          const newLineArr = [
            {
              coord: [item[0], item[1]],
              lineStyle: {
                width: 2,
                type: 'solid',
                color: '#5470c6'
              }
            },
            {
              coord: [routeData[index + 1][0], routeData[index + 1][1]],
              lineStyle: {
                width: 2,
                type: 'solid',
                color: '#5470c6'
              }
            }
          ]
          routeLineData.push(newLineArr)
        }

      })
      newSeriesData.length ? newSeriesData[ newSeriesData.length - 1 ].markLine = {
        silent: false,
        symbol: 'none',
        data: routeLineData
      } : {}
      return {
        xAxis: {
          type: 'category',
          data: xData,
          position: 'top',
          axisLabel: {
            textStyle: {
              fontSize: 18
            }
          }
        },
        tooltip: {
          trigger: 'axis'
        },
        yAxis: {
          name: '累计位移量(mm)',
          nameRotate: -90,
          nameLocation: 'middle',
          nameGap: 30,
          nameTextStyle: {
            fontSize: 18
          },
          inverse: true
        },
        color: [ '#5470c6' ],
        series: newSeriesData
      }
    }
