作者Toby,来源公众号:Python风控模型,非平衡数据处理-Tomek link算法
概述
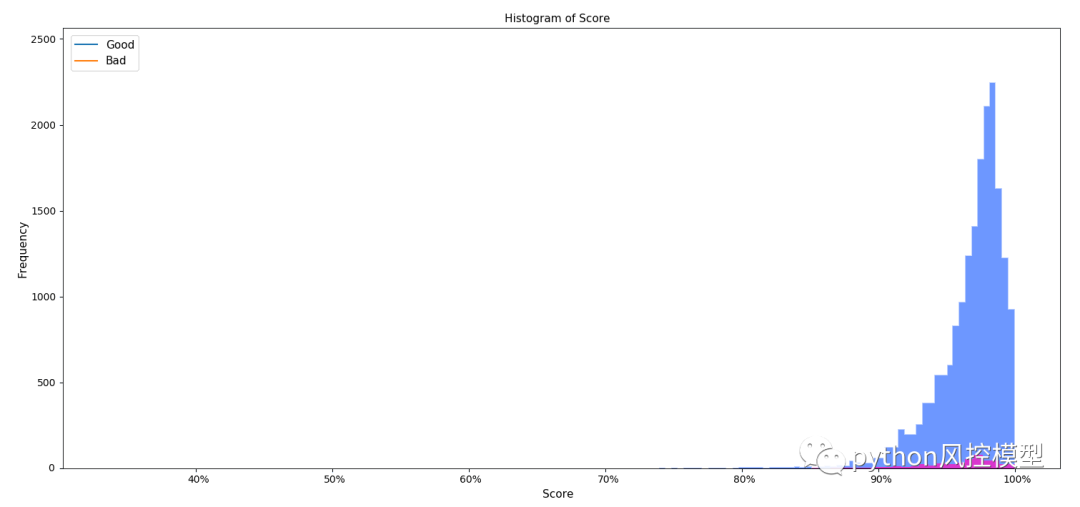
非平衡数据在金融风控领域、反欺诈客户识别、广告智能推荐和生物医疗中普遍存在。一般而言,不平衡数据正负样本的比例差异极大,如在Kaggle竞赛中的桑坦德银行交易预测和IEEE-CIS欺诈检测数据。对模型而言,不均衡数据构建的模型会更愿意偏向于多类别样本的标签。非平衡数据情况下,模型的准确率指标accuracy不具有太大参考价值,模型实际应用价值降低。如下图所示,为在不均衡数据下模型预测的概率分布。
历史背景
20 世纪 90 年代末,当时南佛罗里达大学的研究生 Niesh V Chawla(SMOTE 背后的主要大脑)正在研究二元分类问题。他正在处理乳房 X 光检查图像,他的任务是构建一个分类器,该分类器将像素作为输入,并将其分类为正常像素或癌变像素。当他达到 97% 的分类准确率时,他非常高兴。当他看到 97.6% 的像素都是正常的时,他的快乐是短暂的。
您可能会想,问题出在哪里?有两个问题
-
假设在 100 个像素的样本中,98 个像素是正常的,2 个是癌变的,如果我们编写一个程序,它可以预测任何情况都是正常的。分类准确率是多少?高达98%。程序学会了吗?一点也不。
-
还有一个问题。分类器努力在训练数据中获得良好的性能,并且随着正常观察的增多,它们将更多地专注于学习“正常”类的模式。这就像任何学生知道 98% 的问题来自代数而 2% 来自三角学时会做的那样。他们会安全地忽略三角函数
那么,为什么会出现这个问题,是因为类别的频率或数量之间存在很大的差异。我们称这样的数据集为表现类别不平衡的数据集。正常类称为多数类,稀有类称为少数类。
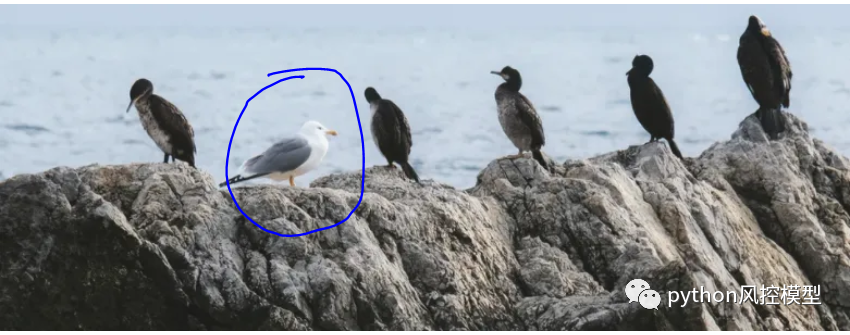
白色海鸥作为少数群体
这在现实生活中的应用中存在吗?以垃圾邮件检测、假新闻检测、欺诈检测、可疑活动检测、入侵检测等为例,类别不平衡问题就表现出来了。
带来一些平衡的解决方案:
基本方法称为重采样技术。有两种基本方法。
欠采样:-
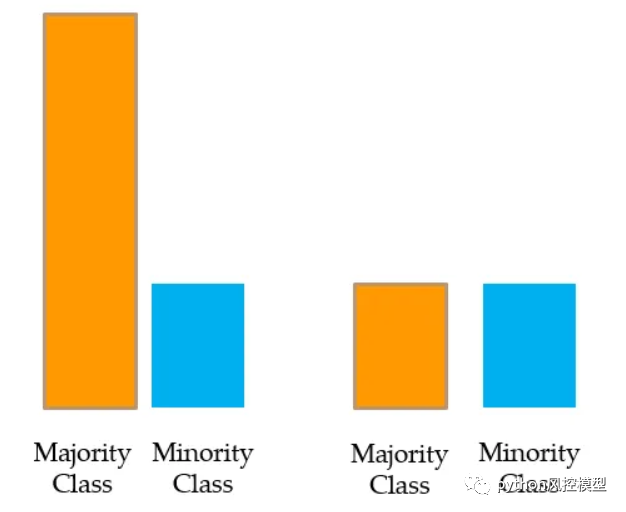
对多数类进行欠采样或下采样
我们从多数类中随机抽取样本,并使其等于少数类的数量。这称为多数类的欠采样或下采样。
问题:忽略或放弃如此多的原始数据并不是一个好主意。
过采样:-
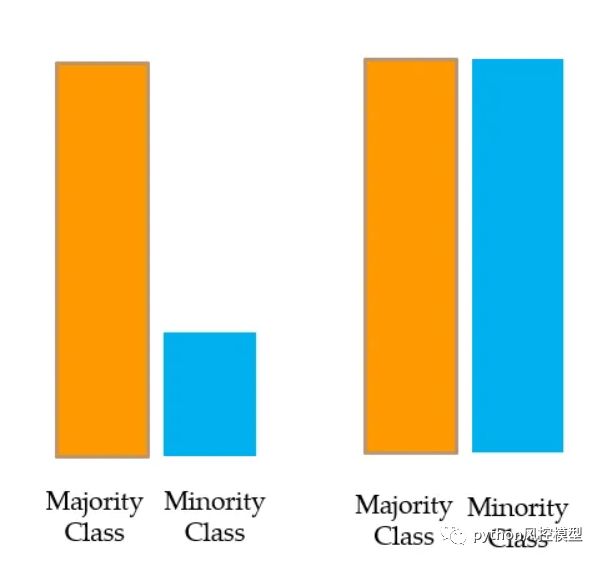
对少数类进行过采样或上采样
在这里,对少数类应用放回抽样,以创建与多数类中一样多的观测值,并且两个类是平衡的。这称为少数类的过采样或上采样。
问题:重复相同的少数类数据会导致过度拟合。
Tomek's link
今天Toby老师介绍的是Tomek's link。Tomek's link是一种用于处理类不平衡数据集的欠采样方法,通过移除近邻的反例样本来改善模型的性能。这种方法可以有效地解决类别不平衡问题,提高分类器的准确性。
Tomek Links是一种欠采样技术,由Ivan Tomek于1976年开发。它是从Condensed Nearest Neighbors (CNN)中修改而来的一种技术。它可以用于找到与少数类数据具有最低欧几里得距离的多数类数据的所需样本,然后将其删除。
Tomek's link支持多分类器模型。下面是英文原释义:
Tomek's link supports multi-class resampling. A one-vs.-rest scheme is used as originally proposed in.
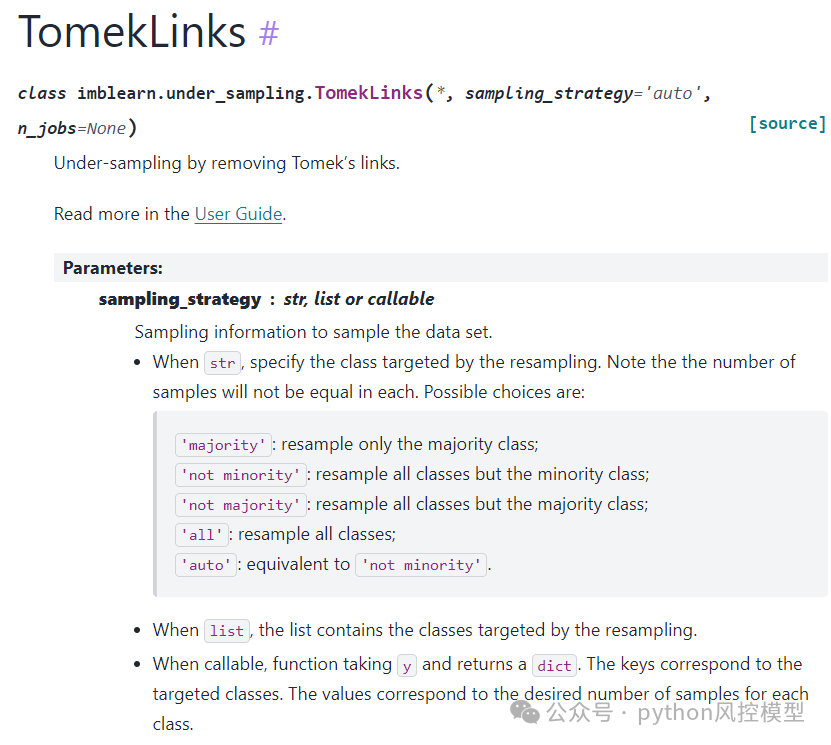
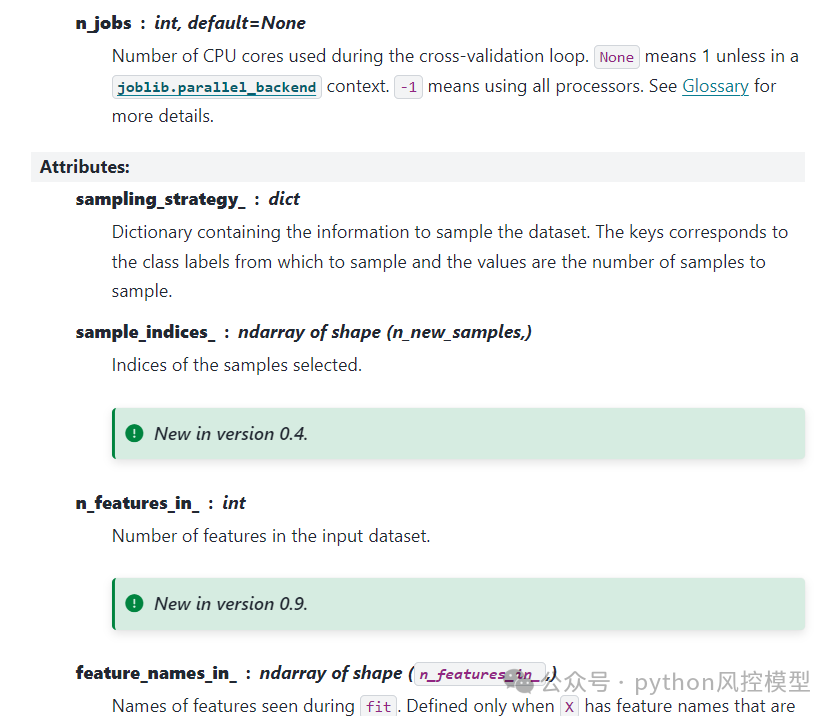
Tomek'slink的参数如下,具体参考链接:https://imbalanced-learn.org/stable/references/generated/imblearn.under_sampling.TomekLinks.html
下面用示例代码展示一下Tomek's link原理。
# -*- coding: utf-8 -*-
"""
Created on Sun Apr 28 17:30:04 2024
论文和企业建模商务咨询QQ:231469242,微信:drug666123
从0到1Python数据科学之旅
https://study.163.com/series/1202883601.htm?share=2&shareId=400000000398149
"""

import matplotlib.pyplot as plt
import seaborn as sns

sns.set_context("poster")

#绘图函数
def make_plot_despine(ax):
    sns.despine(ax=ax, offset=10)
    ax.set_xlim([0, 3])
    ax.set_ylim([0, 3])
    ax.set_xlabel(r"$X_1$")
    ax.set_ylabel(r"$X_2$")
    ax.legend(loc="lower right")

#生成少量样本数据和多类样本数据
import numpy as np
rng = np.random.RandomState(18)
X_minority = np.transpose(
    [[1.1, 1.3, 1.15, 0.8, 0.55, 2.1], [1.0, 1.5, 1.7, 2.5, 0.55, 1.9]]
)
X_majority = np.transpose(
    [
        [2.1, 2.12, 2.13, 2.14, 2.2, 2.3, 2.5, 2.45],
        [1.5, 2.1, 2.7, 0.9, 1.0, 1.4, 2.4, 2.9],
    ]
)
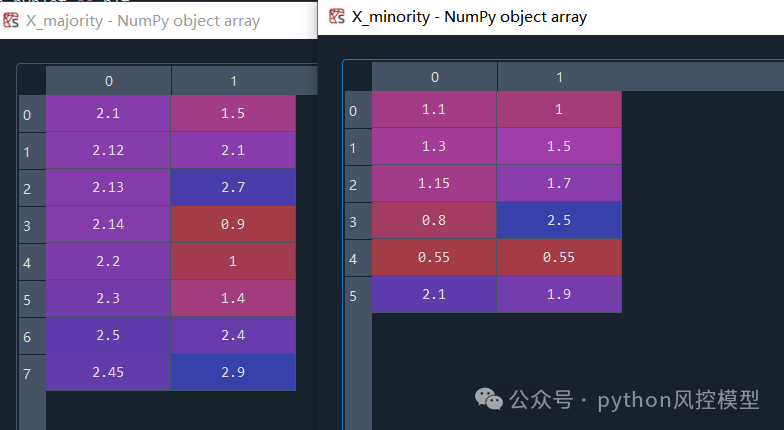
如下图展示,X_majority代表多数类数据,X_minority 代表少数类数据。
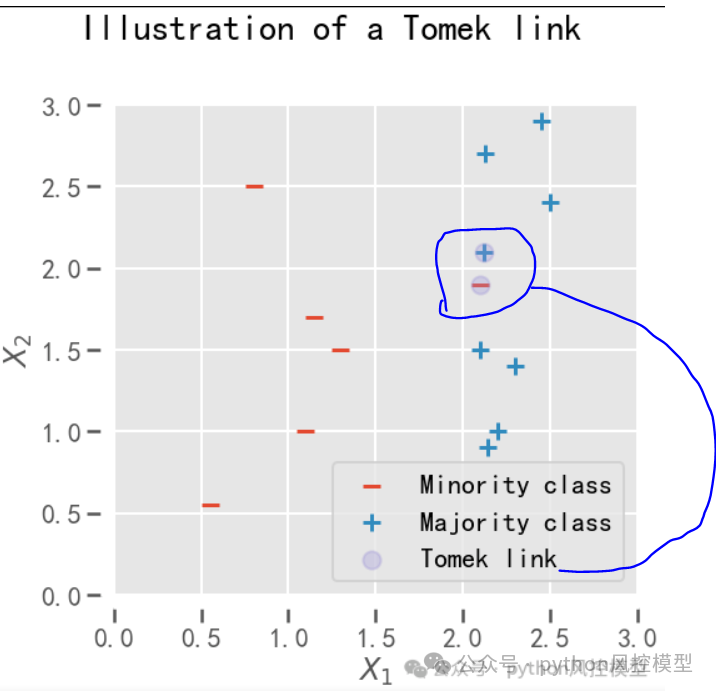
在上图中,以灰色圆圈突出显示的样本形成了Tomek link,因为它们属于不同的类别,并且彼此是最近的邻居。红色减号代表少数类数据,蓝色加号代表多数类数据。
下面是实现代码:
# -*- coding: utf-8 -*-
"""
Created on Sun Apr 28 17:30:04 2024
论文和企业建模商务咨询QQ:231469242,微信:drug666123
从0到1Python数据科学之旅
https://study.163.com/series/1202883601.htm?share=2&shareId=400000000398149
"""

import matplotlib.pyplot as plt
import seaborn as sns

sns.set_context("poster")

#绘图函数
def make_plot_despine(ax):
    sns.despine(ax=ax, offset=10)
    ax.set_xlim([0, 3])
    ax.set_ylim([0, 3])
    ax.set_xlabel(r"$X_1$")
    ax.set_ylabel(r"$X_2$")
    ax.legend(loc="lower right")

#生成少量样本数据和多类样本数据
import numpy as np
rng = np.random.RandomState(18)
X_minority = np.transpose(
    [[1.1, 1.3, 1.15, 0.8, 0.55, 2.1], [1.0, 1.5, 1.7, 2.5, 0.55, 1.9]]
)
X_majority = np.transpose(
    [
        [2.1, 2.12, 2.13, 2.14, 2.2, 2.3, 2.5, 2.45],
        [1.5, 2.1, 2.7, 0.9, 1.0, 1.4, 2.4, 2.9],
    ]
)
#
fig, ax = plt.subplots(figsize=(8, 8))
ax.scatter(
    X_minority[:, 0],
    X_minority[:, 1],
    label="Minority class",
    s=200,
    marker="_",
)
ax.scatter(
    X_majority[:, 0],
    X_majority[:, 1],
    label="Majority class",
    s=200,
    marker="+",
)

# highlight the samples of interest
ax.scatter(
    [X_minority[-1, 0], X_majority[1, 0]],
    [X_minority[-1, 1], X_majority[1, 1]],
    label="Tomek link",
    s=200,
    alpha=0.3,
)
make_plot_despine(ax)
fig.suptitle("Illustration of a Tomek link")
fig.tight_layout()

fig, ax = plt.subplots(figsize=(8, 8))
ax.scatter(
    X_minority[:, 0],
    X_minority[:, 1],
    label="Minority class",
    s=200,
    marker="_",
)
ax.scatter(
    X_majority[:, 0],
    X_majority[:, 1],
    label="Majority class",
    s=200,
    marker="+",
)

# highlight the samples of interest
ax.scatter(
    [X_minority[-1, 0], X_majority[1, 0]],
    [X_minority[-1, 1], X_majority[1, 1]],
    label="Tomek link",
    s=200,
    alpha=0.3,
)
make_plot_despine(ax)
fig.suptitle("Illustration of a Tomek link")
fig.tight_layout()
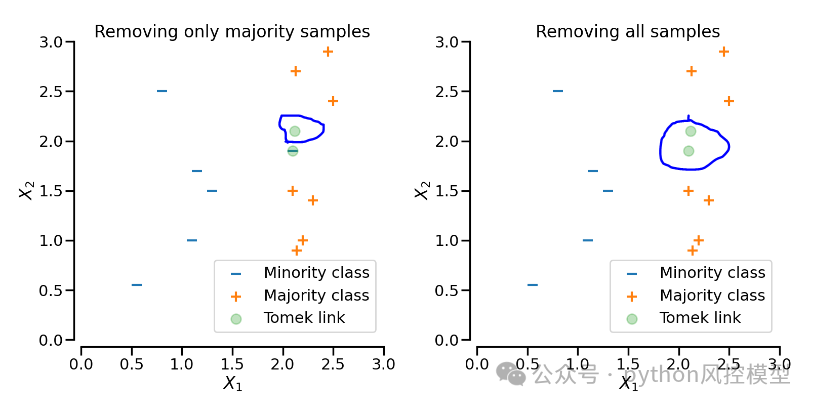
我们可以运行TomekLinks采样来删除相应的样本。如果sampling_strategy=“auto”,则只删除多数类中的样本,如下图左图。如果sampling_strategy=“所有”两个样本都将被删除,如下图右图。
下面是实现代码
from imblearn.under_sampling import TomekLinks

fig, axs = plt.subplots(nrows=1, ncols=2, figsize=(16, 8))

samplers = {
    "Removing only majority samples": TomekLinks(sampling_strategy="auto"),
    "Removing all samples": TomekLinks(sampling_strategy="all"),
}

for ax, (title, sampler) in zip(axs, samplers.items()):
    X_res, y_res = sampler.fit_resample(
        np.vstack((X_minority, X_majority)),
        np.array([0] * X_minority.shape[0] + [1] * X_majority.shape[0]),
    )
    ax.scatter(
        X_res[y_res == 0][:, 0],
        X_res[y_res == 0][:, 1],
        label="Minority class",
        s=200,
        marker="_",
    )
    ax.scatter(
        X_res[y_res == 1][:, 0],
        X_res[y_res == 1][:, 1],
        label="Majority class",
        s=200,
        marker="+",
    )

    # highlight the samples of interest
    ax.scatter(
        [X_minority[-1, 0], X_majority[1, 0]],
        [X_minority[-1, 1], X_majority[1, 1]],
        label="Tomek link",
        s=200,
        alpha=0.3,
    )

    ax.set_title(title)
    make_plot_despine(ax)
fig.tight_layout()

plt.show()
lendingclub实验TomekLinks
Toby老师用12万大样本的lendingclub数据集来实验TomekLinks欠采样算法,观察是否真的能够提升模型性能。
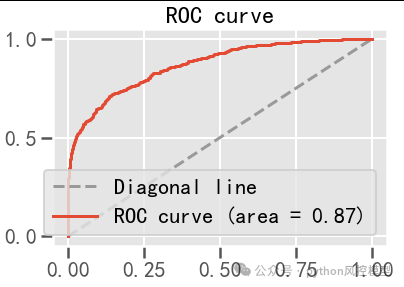
在模型竞赛中,TomekLinks的确可以提升模型AUC,但f1_score性能会被牺牲掉。
如下图TomekLinks欠采样后模型AUC性能提升到0.869,而之前模型AUC只有0.856.
Tomek link就介绍到这里,如果您们对人工智能预测模型项目感兴趣,欢迎各大科研机构,研究生博士生论文定制服务联系。
项目联系人:重庆未来之智信息技术咨询服务有限公司,Toby老师,文章末尾有联系方式。
