Kaggle实战(泰坦尼克号海难生死预测)
1、背景介绍
泰坦尼克号于1909年3月31日在爱尔兰动工建造,1911年5月31日下水,次年4月2日完工试航。她是当时世界上体积最庞大、内部设施最豪华的客运轮船,有“永不沉没”的美誉。然而讽刺的是,泰坦尼克号首航便遭遇厄运:1912年4月10日她从英国南安普顿出发,途径法国瑟堡和爱尔兰昆士敦,驶向美国纽约。在14日晚23时40分左右,泰坦尼克号与一座冰山相撞,导致船体裂缝进水。次日凌晨2时20分左右,泰坦尼克号断为两截后沉入大西洋,其搭载的2224名船员及乘客,在本次海难中逾1500人丧生。
在学习机器学习相关项目时,Titanic生存率预测项目也通常是入门练习的经典案例。Kaggle平台为我们提供了一个竞赛案例“Titanic: Machine Learning from Disaster”,在该案例中,我们将探究什么样的人在此次海难中幸存的几率更高,并通过构建预测模型来预测乘客生存率。
本项目通过数据可视化理解数据,并利用特征工程等方法挖掘更多有价值的特征,然后利用同组效应找出共性较强的群体并对其数据进行修正,在选择模型时分别比较了Gradient Boosting Classifier、
Logistic Regression等多种方法,最终利用Gradient Boosting Classifier对乘客的生存率进行预测。
2、加载数据
#导入相关包
import warnings
warnings.filterwarnings('ignore')
import numpy as np
import pandas as pd
import seaborn as sns

#设置sns样式
sns.set(style='white',context='notebook',palette='muted')
import matplotlib.pyplot as plt

#导入数据
train=pd.read_csv('./train.csv')
test=pd.read_csv('./test.csv')
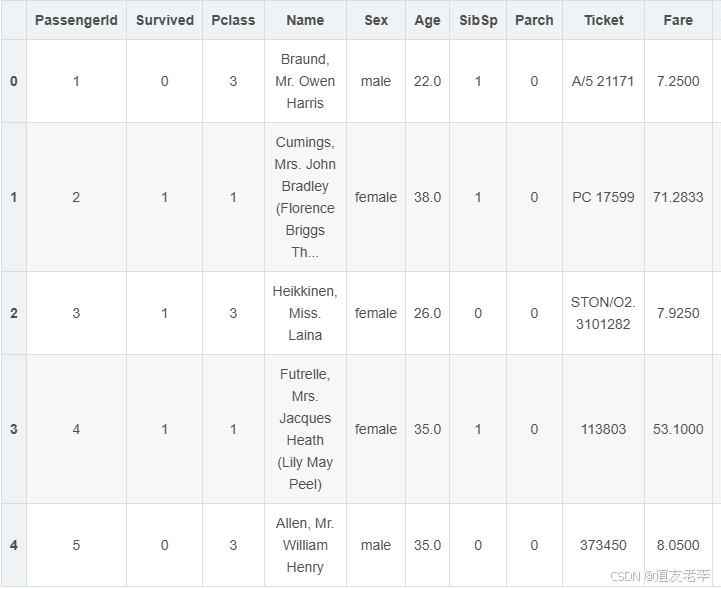
display(train.head())
特征字段
- Survived 是否存活(label):
- 0 - 用户死亡;
- 1- 用户存活;
- Pclass(用户阶级):
- 1 - 1st class,高等用户;
- 2 - 2nd class,中等用户;
- 3 - 3rd class,低等用户;
- SibSp:描述了泰坦尼克号上与乘客同行的兄弟姐妹(Siblings)和配偶(Spouse)数目;
- Parch:描述了泰坦尼克号上与乘客同行的家长(Parents)和孩子(Children)数目;
- Cabin(船舱):描述用户所住的船舱编号。由两部分组成,仓位号和房间编号,如C88中,C和
88分别对应C仓位和88号房间; - Embarked(港口):
描述乘客上船时的港口,包含三种类型:- S:Southampton(南安普顿,英国);
- C:Cherbourg(瑟堡,法国);
- Q:Queenstown(昆士敦,英国);
3、数据探索
3.1、数据查看
#分别查看实验数据集和预测数据集数据
print('训练数据大小:',train.shape)
print('预测数据大小:',test.shape)
训练数据大小: (891, 12)
预测数据大小: (418, 11)
该数据集共1309条数据,其中训练数据891条,预测数据418条;训练数据比预测数据多了一列:即标签"result"。
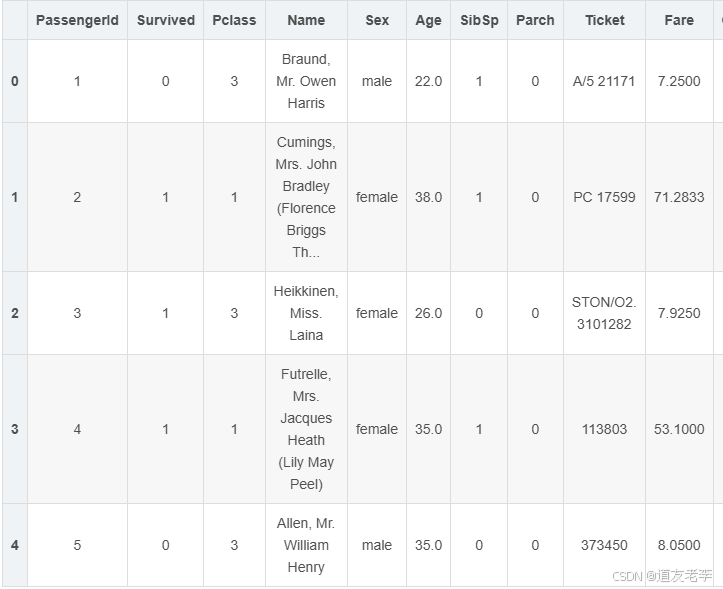
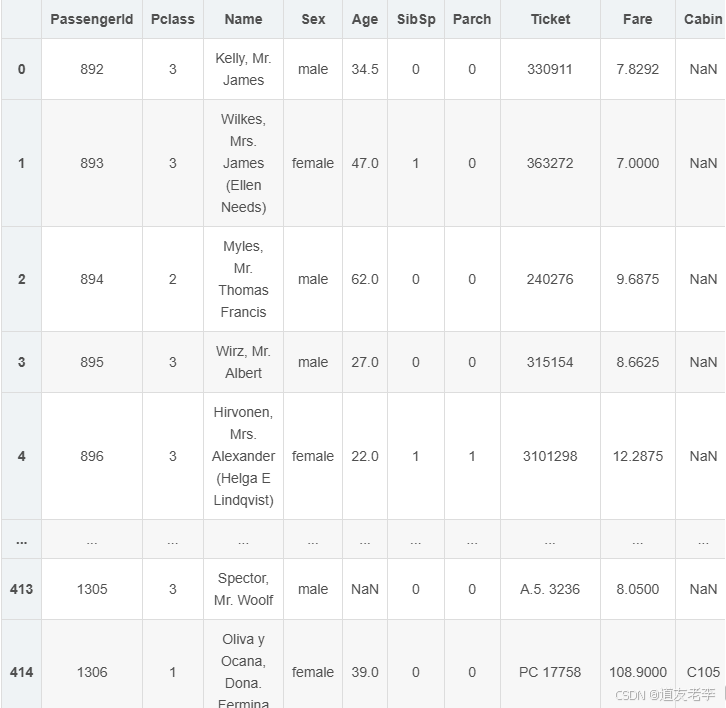
display(train.head(),test.head())
#将训练数据和预测数据合并,这样便于一起处理
full=train.append(test,ignore_index=True)
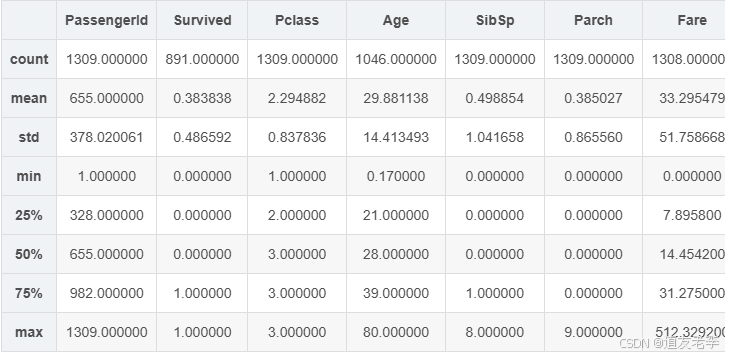
full.describe()
无明显的异常值,几乎所有数据均在正常范围内。
查看info()详情
full.info()
<class 'pandas.core.frame.DataFrame'>
RangeIndex: 1309 entries, 0 to 1308
Data columns (total 12 columns):
 #   Column       Non-Null Count  Dtype
---  ------       --------------  -----
 0   PassengerId  1309 non-null   int64
 1   Survived     891 non-null    float64
 2   Pclass       1309 non-null   int64
 3   Name         1309 non-null   object
 4   Sex          1309 non-null   object
 5   Age          1046 non-null   float64
 6   SibSp        1309 non-null   int64
 7   Parch        1309 non-null   int64
 8   Ticket       1309 non-null   object
 9   Fare         1308 non-null   float64
 10  Cabin        295 non-null    object
 11  Embarked     1307 non-null   object
dtypes: float64(3), int64(4), object(5)
memory usage: 122.8+ KB
Age/Cabin/Embarked/Fare四项数据有缺失值,其中Cabin字段缺失近四分之三的数据。
3.2、特征与标签之间的关系
3.2.1、Embarked与Survived关系
# 港口和生死之间的关系
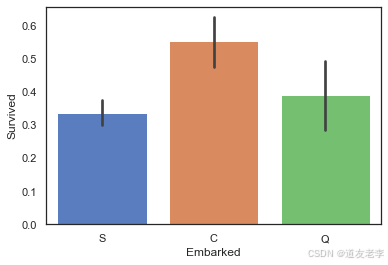
sns.barplot(data=train,x='Embarked',y='Survived')
<AxesSubplot:xlabel='Embarked', ylabel='Survived'>
#计算不同类型Embarked的乘客,其生存率为多少
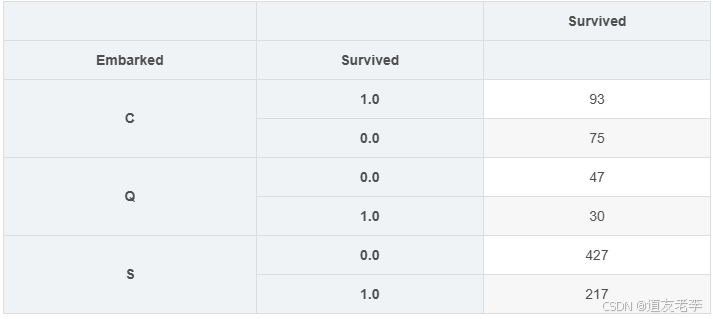
s = full.groupby('Embarked')['Survived'].value_counts().to_frame()
display(s)
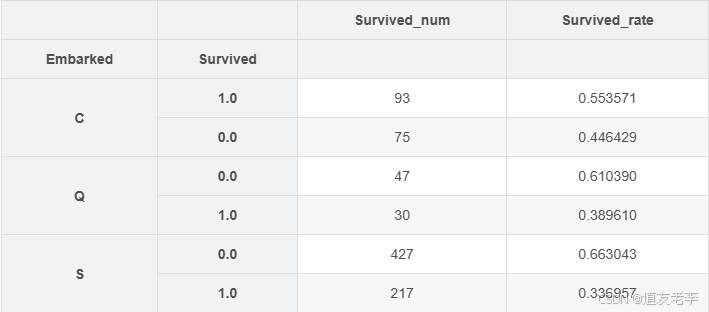
s2 = s/s.sum(level=0) # 生存率
display(s2)
pd.merge(s,s2,left_index=True,right_index=True,suffixes=['_num','_rate'])
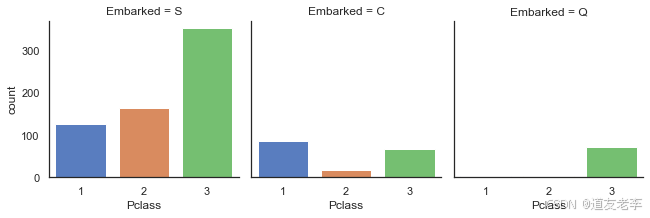
法国登船乘客生存率较高原因可能与其头等舱乘客比例较高有关,因此继续查看不同登船地点乘客各舱位乘客数量情况。
sns.catplot('Pclass',col='Embarked',data=train,kind='count',size=3)
3.2.2、Parch与Survived关系
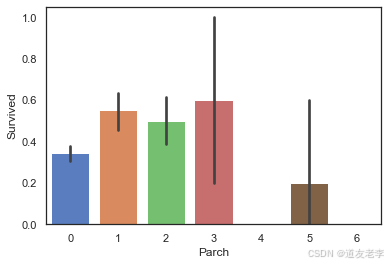
sns.barplot(data=train,x='Parch',y='Survived')
当乘客同行的父母及子女数量适中时,生存率较高
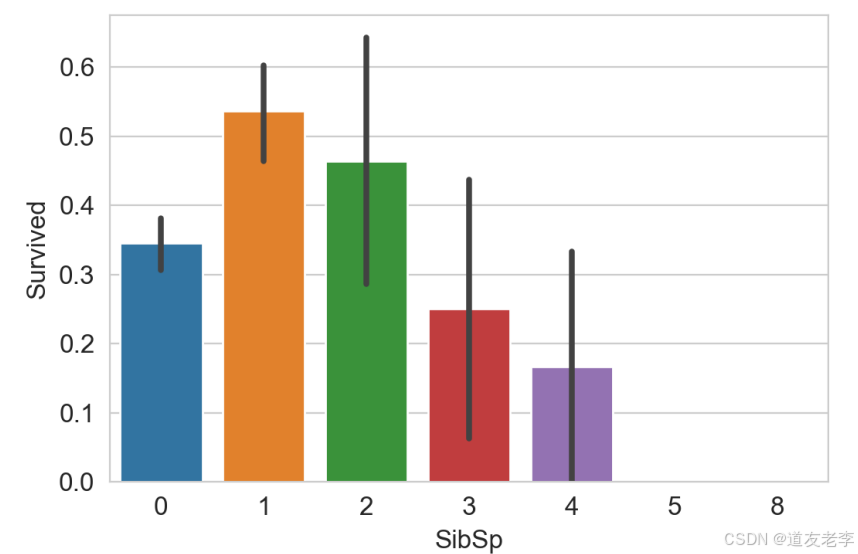
3.2.3、SibSp与Survived关系
sns.barplot(data=train,x='SibSp',y='Survived')
当乘客同行的同辈数量适中时生存率较高
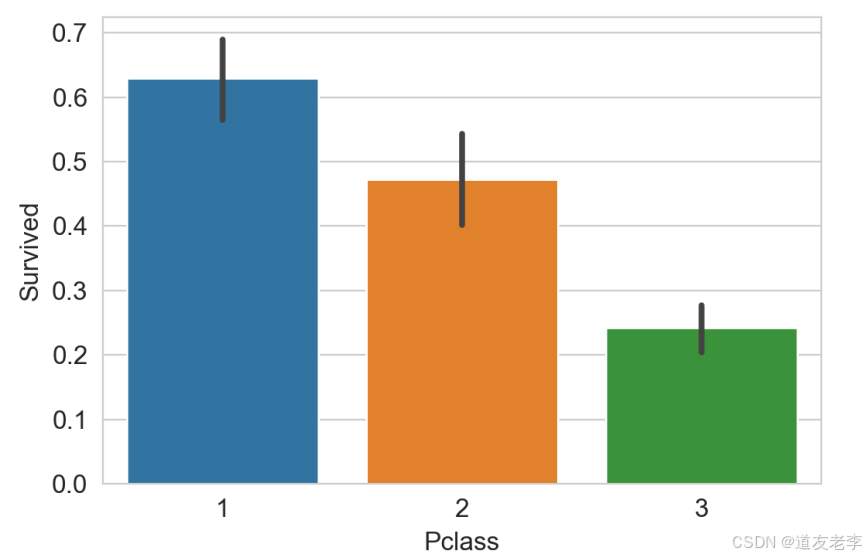
3.2.4、Pclass与Survived关系
sns.barplot(data=train,x='Pclass',y='Survived')
乘客客舱等级越高,生存率越高
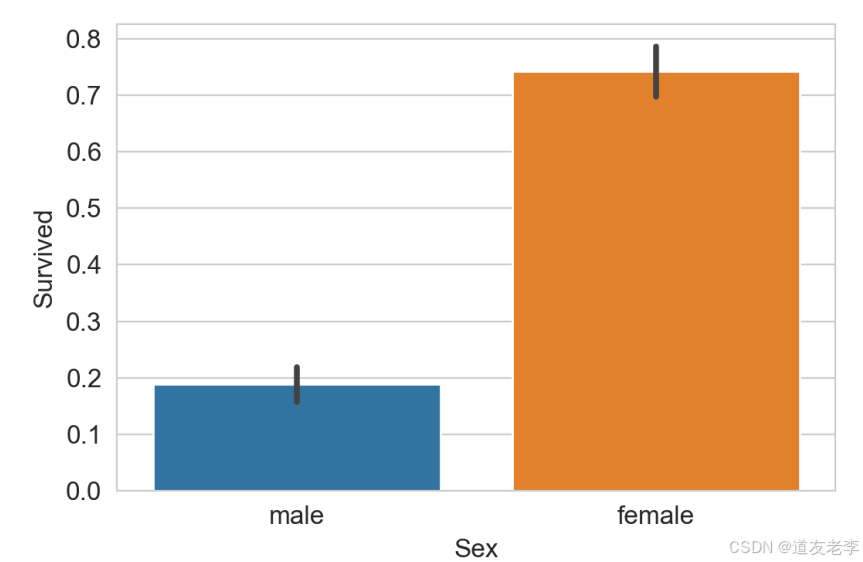
3.2.5、Sex与Survived关系
sns.barplot(data=train,x='Sex',y='Survived')
女性的生存率远高于男性
3.2.6、Age与Survived关系
#创建坐标轴
ageFacet=sns.FacetGrid(train,hue='Survived',aspect=3)
#作图,选择图形类型
ageFacet.map(sns.kdeplot,'Age',shade=True)
#其他信息:坐标轴范围、标签等
ageFacet.set(xlim=(0,train['Age'].max()))
ageFacet.add_legend()
当乘客年龄段在0-10岁期间时生存率会较高
3.2.7、Fare与Survived关系
#创建坐标轴
ageFacet=sns.FacetGrid(train,hue='Survived',aspect=3)# aspect每个图片的纵横比
ageFacet.map(sns.kdeplot,'Fare',shade=True)
ageFacet.set(xlim=(0,150))
ageFacet.add_legend()
当票价低时乘客生存率较低,票价越高生存率一般越高!
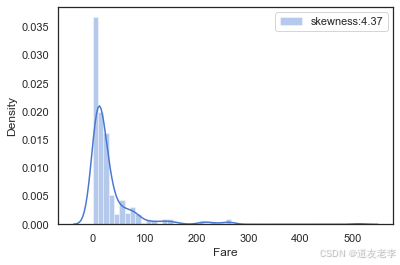
查看票价的分布
#查看fare分布
farePlot=sns.distplot(full['Fare'][full['Fare'].notnull()],
                      label='skewness:%.2f'%(full['Fare'].skew()))
farePlot.legend(loc='best')
fare的分布呈左偏的形态,其偏度skewness=4.37较大,说明数据偏移平均值较多,因此我们需要对数据进行对数化处理,防止数据权重分布不均匀。
#对数化处理fare值
full['Fare']=full['Fare'].map(lambda x: np.log(x) if x > 0 else x)

#处理之后票价Fare分布
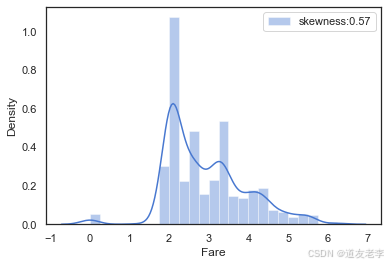
farePlot=sns.distplot(full['Fare'][full['Fare'].notnull()],
                      label='skewness:%.2f'%(full['Fare'].skew()))
farePlot.legend(loc='best')
plt.savefig('./10-Fare票价分布.png',dpi = 200)
4、数据预处理
数据预处理主要包括以下四个方面内容:
- 数据清洗(缺失值以及异常值的处理)
- 特征工程(基于对现有数据特征的理解构造的新特征,以挖掘数据的更多特点)
- 同组识别(找出具有明显同组效应且违背整体规律的数据,对其进行规整)
- 筛选子集(对数据进行降维,选择子集)
4.1、数据清洗
对数据的缺失值、异常值进行处理,便于对数据进一步分析。本数据集有四个字段的数据存在缺失情
况,即 Cabin/Embarked/Fare/Age,未发现数据存在明显异常情况。
其中Age字段缺失较多且为连续型数值,将在进行4.2特征工程章节挖取更多特征后再填充缺失值。
4.1.1、Cabin(船舱)缺失值填充
#对Cabin缺失值进行处理,利用U(Unknown)填充缺失值
full['Cabin']=full['Cabin'].fillna('U')
full['Cabin'].head()
0       U
1     C85
2       U
3    C123
4       U
Name: Cabin, dtype: object
4.1.2、Embarked(港口)缺失值填充
#对Embarked缺失值进行处理,查看缺失值情况
display(full[full['Embarked'].isnull()])
display(full['Embarked'].value_counts())
# 查看Embarked数据分布情况,可知在英国南安普顿登船可能性最大,因此以此填充缺失值。
full['Embarked']=full['Embarked'].fillna('S')
S    914
C    270
Q    123
Name: Embarked, dtype: int64
4.1.3、Fare缺失值填充(乘客费用)
#查看缺失数据情况,该乘客乘坐3等舱,登船港口为法国,舱位未知
display(full[full['Fare'].isnull()])

# 利用3等舱,登船港口为英国,舱位未知旅客的平均票价来填充缺失值。
price = full[(full['Pclass']==3)&(full['Embarked']=='S')&(full['Cabin']=='U')]['Fare'].mean()

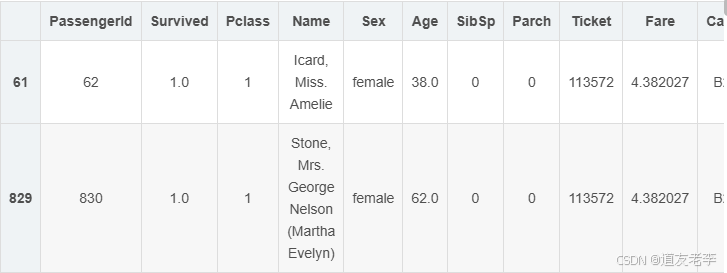
full['Fare']=full['Fare'].fillna(price)
full.info()
<class 'pandas.core.frame.DataFrame'>
RangeIndex: 1309 entries, 0 to 1308
Data columns (total 12 columns):
 #   Column       Non-Null Count  Dtype
---  ------       --------------  -----
 0   PassengerId  1309 non-null   int64
 1   Survived     891 non-null    float64
 2   Pclass       1309 non-null   int64
 3   Name         1309 non-null   object
 4   Sex          1309 non-null   object
 5   Age          1046 non-null   float64
 6   SibSp        1309 non-null   int64
 7   Parch        1309 non-null   int64
 8   Ticket       1309 non-null   object
 9   Fare         1309 non-null   float64
 10  Cabin        1309 non-null   object
 11  Embarked     1309 non-null   object
dtypes: float64(3), int64(4), object(5)
memory usage: 122.8+ KB
4.2、特征工程
在理解原数据特征的基础上,特征工程通过对原有数据进行整合处理,得到新特征以反映数据更多信
息。
4.2.1、Name中的头衔信息-Title
旅客姓名数据中包含头衔信息,不同头衔也可以反映旅客的身份,而不同身份的旅客其生存率有可能会出现较大差异。因此我们通过Name特征提取旅客头衔Title信息,并分析Title与Survived之间的关系。
#构造新特征Title
full['Title']=full['Name'].map(lambda x:x.split(',')[1].split('.')[0].strip())
#查看title数据分布
full['Title'].value_counts()
Mr              757
Miss            260
Mrs             197
Master           61
Dr                8
Rev               8
Col               4
Major             2
Ms                2
Mlle              2
Sir               1
the Countess      1
Lady              1
Don               1
Mme               1
Capt              1
Dona              1
Jonkheer          1
Name: Title, dtype: int64
将相近的Title信息整合在一起:
#将title信息进行整合
TitleDict={}
TitleDict['Mr']='Mr'
TitleDict['Mlle']='Miss'
TitleDict['Miss']='Miss'
TitleDict['Master']='Master'
TitleDict['Jonkheer']='Master'
TitleDict['Mme']='Mrs'
TitleDict['Ms']='Mrs'
TitleDict['Mrs']='Mrs'
TitleDict['Don']='Royalty'
TitleDict['Sir']='Royalty'
TitleDict['the Countess']='Royalty'
TitleDict['Dona']='Royalty'
TitleDict['Lady']='Royalty'
TitleDict['Capt']='Officer'
TitleDict['Col']='Officer'
TitleDict['Major']='Officer'
TitleDict['Dr']='Officer'
TitleDict['Rev']='Officer'

full['Title']=full['Title'].map(TitleDict)
full['Title'].value_counts()
Mr         757
Miss       262
Mrs        200
Master      62
Officer     23
Royalty      5
Name: Title, dtype: int64
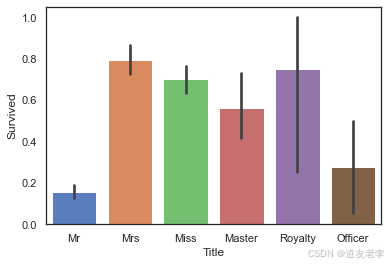
可视化观察新特征与标签间关系:
#可视化分析Title与Survived之间关系
sns.barplot(data=full,x='Title',y='Survived')
头衔为’Mr’及’Officer’的乘客,生存率明显较低。
4.2.2、FamilyNum及FamilySize信息
将Parch及SibSp字段整合得到一名乘客同行家庭成员总人数FamilyNum的字段,再根据家庭成员具体人数的多少得到家庭规模FamilySize这个新字段。
- SibSp:描述了泰坦尼克号上与乘客同行的兄弟姐妹(Siblings)和配偶(Spouse)数目;
- Parch:描述了泰坦尼克号上与乘客同行的家长(Parents)和孩子(Children)数目;
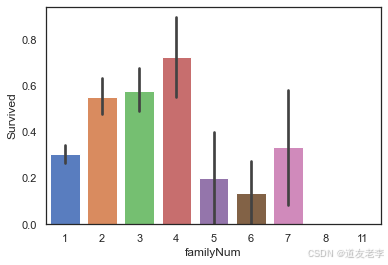
full['familyNum']=full['Parch']+full['SibSp'] + 1
#查看familyNum与Survived
sns.barplot(data=full,x='familyNum',y='Survived')
家庭成员人数在2-4人时,乘客的生存率较高,当没有家庭成员同行或家庭成员人数过多时生存率较低。
#我们按照家庭成员人数多少,将家庭规模分为小(0)、中(1)、大(2)三类:
def familysize(familyNum):
    if familyNum== 1 :
        return 0
    elif (familyNum>=2)&(familyNum<=4):
        return 1
    else:
        return 2

full['familySize']=full['familyNum'].map(familysize)
full['familySize'].value_counts()
0    790
1    437
2     82
Name: familySize, dtype: int64
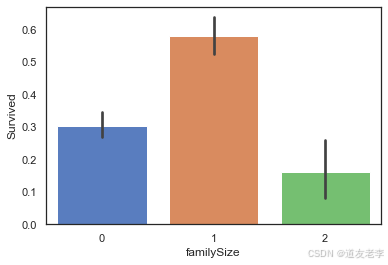
查看familySize与Survived关系:
#查看familySize与Survived
sns.barplot(data=full,x='familySize',y='Survived')
当家庭规模适中时,乘客的生存率更高。
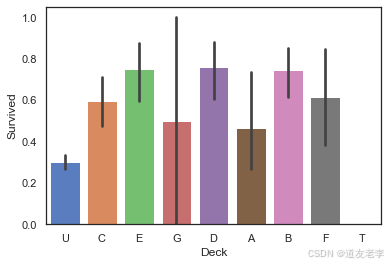
4.2.3、Cabin客舱类型信息-Deck
Cabin字段的首字母代表客舱的类型,也反映不同乘客群体的特点,可能也与乘客的生存率相关。泰坦尼克号撞击冰山时,也跟客舱位置有一定关系
#提取Cabin字段首字母
full['Deck']=full['Cabin'].map(lambda x:x[0])
#查看不同Deck类型乘客的生存率
sns.barplot(data=full,x='Deck',y='Survived')
# plt.savefig('./14-Deck与Survived关系.png',dpi = 200)
当乘客的客舱类型为B/D/E时,生存率较高;当客舱类型为U/T时,生存率较低。
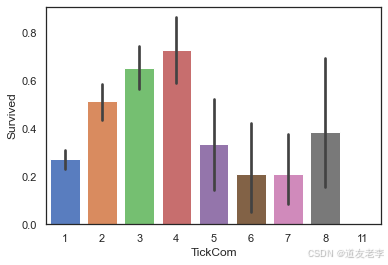
4.2.4、共票号乘客数量TickCom及TickGroup
同一票号的乘客数量可能不同,可能也与乘客生存率有关系
#提取各票号的乘客数量
TickCountDict=full['Ticket'].value_counts()
TickCountDict.head(20)
CA. 2343        11
CA 2144          8
1601             8
347082           7
S.O.C. 14879     7
347077           7
PC 17608         7
3101295          7
347088           6
382652           6
113781           6
19950            6
W./C. 6608       5
113503           5
220845           5
4133             5
16966            5
PC 17757         5
349909           5
PC 17760         4
Name: Ticket, dtype: int64
#将同票号乘客数量数据并入数据集中
full['TickCom']=full['Ticket'].map(TickCountDict)
full['TickCom'].head()
#查看TickCom与Survived之间关系
sns.barplot(data=full,x='TickCom',y='Survived')
当TickCom大小适中时,乘客生存率较高。
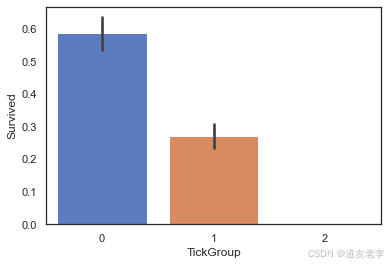
#按照TickCom大小,将TickGroup分为三类。
def TickCountGroup(num):
    if (num>=2)&(num<=4):
        return 0
    elif (num==1)|((num>=5)&(num<=8)):
        return 1
    else :
        return 2
#得到各位乘客TickGroup的类别
full['TickGroup']=full['TickCom'].map(TickCountGroup)
#查看TickGroup与Survived之间关系
sns.barplot(data=full,x='TickGroup',y='Survived')
4.2.5、Age缺失值填充-构建随机森林模型预测缺失的数据
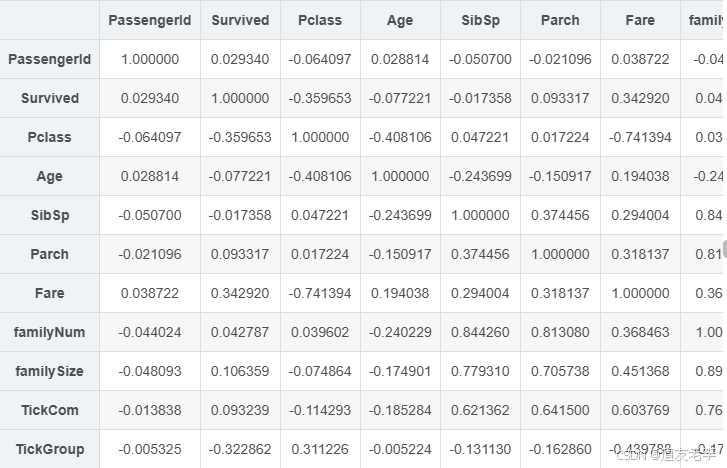
查看Age与Parch、Pclass、Sex、SibSp、Title、familyNum、familySize、Deck、TickCom、
TickGroup等变量的相关系数大小,筛选出相关性较高的变量构建预测模型。
full[full['Age'].notnull()].corr()
- 筛选数据
#筛选数据集
agePre=full[['Age','Parch','Pclass','SibSp','familyNum','TickCom','Title']]
# 进行one-hot编码
agePre=pd.get_dummies(agePre)
ageCorrDf=agePre.corr()
ageCorrDf['Age'].sort_values()
Pclass          -0.408106
Title_Master    -0.385380
Title_Miss      -0.282977
SibSp           -0.243699
familyNum       -0.240229
TickCom         -0.185284
Parch           -0.150917
Title_Royalty    0.057337
Title_Officer    0.166771
Title_Mr         0.183965
Title_Mrs        0.215091
Age              1.000000
Name: Age, dtype: float64
- 拆分数据并建立模型(利用随机森林构建模型)
#拆分实验集和预测集
ageKnown=agePre[agePre['Age'].notnull()] # 根据非空数据,规律
ageUnKnown=agePre[agePre['Age'].isnull()] # 空数据,填充

#生成实验数据的特征和标签
ageKnown_X=ageKnown.drop(['Age'],axis=1)
ageKnown_y=ageKnown['Age']

#生成预测数据的特征
ageUnKnown_X=ageUnKnown.drop(['Age'],axis=1)

#利用随机森林构建模型
from sklearn.ensemble import RandomForestRegressor
rfr=RandomForestRegressor(random_state=None,n_estimators=500,n_jobs=-1)
rfr.fit(ageKnown_X,ageKnown_y)
RandomForestRegressor(n_estimators=500, n_jobs=-1)
- 利用模型进行预测并填入原数据集中
#模型得分
score = rfr.score(ageKnown_X,ageKnown_y)
print('模型预测年龄得分是:',score)
#预测年龄
ageUnKnown_predict = rfr.predict(ageUnKnown_X)
#填充预测数据
full.loc[full['Age'].isnull(),['Age']] = ageUnKnown_predict
full.info()  #此时已无缺失值
模型预测年龄得分是: 0.5861009056104122
<class 'pandas.core.frame.DataFrame'>
RangeIndex: 1309 entries, 0 to 1308
Data columns (total 18 columns):
 #   Column       Non-Null Count  Dtype
---  ------       --------------  -----
 0   PassengerId  1309 non-null   int64
 1   Survived     891 non-null    float64
 2   Pclass       1309 non-null   int64
 3   Name         1309 non-null   object
 4   Sex          1309 non-null   object
 5   Age          1309 non-null   float64
 6   SibSp        1309 non-null   int64
 7   Parch        1309 non-null   int64
 8   Ticket       1309 non-null   object
 9   Fare         1309 non-null   float64
 10  Cabin        1309 non-null   object
 11  Embarked     1309 non-null   object
 12  Title        1309 non-null   object
 13  familyNum    1309 non-null   int64
 14  familySize   1309 non-null   int64
 15  Deck         1309 non-null   object
 16  TickCom      1309 non-null   int64
 17  TickGroup    1309 non-null   int64
dtypes: float64(3), int64(8), object(7)
memory usage: 184.2+ KB
4.3、同组识别
虽然通过分析数据已有特征与标签的关系可以构建有效的预测模型,但是部分具有明显共同特征的用户可能与整体模型逻辑并不一致。如果将这部分具有同组效应的用户识别出来并对其数据加以修正,就可以有效提高模型的准确率。在Titanic案例中,我们主要探究相同姓氏的乘客是否存在明显的同组效应。
提取两部分数据,分别查看其“姓氏”是否存在同组效应(因为性别和年龄与乘客生存率关系最为密切,因此用这两个特征作为分类条件):
- 12岁以上男性:找出男性中同姓氏均获救的部分;
- 女性以及年龄在12岁以下儿童:找出女性及儿童中同姓氏均遇难的部分。
#提取乘客的姓氏及相应的乘客数
full['Surname']=full['Name'].map(lambda x:x.split(',')[0].strip())
SurNameDict=full['Surname'].value_counts()

# display(SurNameDict)

full['SurnameNum']=full['Surname'].map(SurNameDict)

# 12岁以上男性:找出男性中同姓氏均获救的部分
MaleDf=full[(full['Sex']=='male')&(full['Age']>12)&(full['familyNum']>=2)]

#分析男性同组效应
MSurNamDf=MaleDf['Survived'].groupby(MaleDf['Surname']).mean()
MSurNamDf.head()
MSurNamDf.value_counts()
0.0    89
1.0    19
0.5     3
Name: Survived, dtype: int64
大多数同姓氏的男性存在“同生共死”的特点,因此利用该同组效应,我们对生存率为1的姓氏里的男性数据进行修正,提升其预测为“可以幸存”的概率。
女性及儿童同组效应分析
#提取乘客的姓氏及相应的乘客数
full['Surname']=full['Name'].map(lambda x:x.split(',')[0].strip())
SurNameDict=full['Surname'].value_counts()
full['SurnameNum']=full['Surname'].map(SurNameDict)

#将数据分为两组
FemChildDf=full[((full['Sex']=='female')|(full['Age']<=12))&(full['familyNum']>=2)]

FCSurNamDf=FemChildDf['Survived'].groupby(FemChildDf['Surname']).mean()
FCSurNamDf.head()
FCSurNamDf.value_counts()
1.000000    115
0.000000     27
0.750000      2
0.333333      1
0.142857      1
Name: Survived, dtype: int64
与男性组特征相似,女性及儿童也存在明显的“同生共死”的特点,因此利用同组效应,对生存率为0的姓氏里的女性及儿童数据进行修正,提升其预测为“并未幸存”的概率。
对数据集中这些姓氏的两组数据数据分别进行修正:
- 男性数据修正为:1、性别改为女;2、年龄改为5;
- 女性及儿童数据修正为:1、性别改为男;2、年龄改为60。
#获得生存率为1的姓氏
MSurNamDict=MSurNamDf[MSurNamDf.values==1].index
MSurNamDict
#获得生存率为0的姓氏
FCSurNamDict=FCSurNamDf[FCSurNamDf.values==0].index
FCSurNamDict
#对数据集中这些姓氏的男性数据进行修正:1、性别改为女;2、年龄改为5。
full.loc[(full['Survived'].isnull())&(full['Surname'].isin(MSurNamDict))&(full['Sex']=='male'),'Sex']='female'
full.loc[(full['Survived'].isnull())&(full['Surname'].isin(MSurNamDict))&(full['Sex']=='male'),'Age']=5

#对数据集中这些姓氏的女性及儿童的数据进行修正:1、性别改为男;2、年龄改为60。
full.loc[(full['Survived'].isnull())&(full['Surname'].isin(FCSurNamDict))&((full['Sex']=='female')|(full['Age']<=12)),'Sex']='male'
full.loc[(full['Survived'].isnull())&(full['Surname'].isin(FCSurNamDict))&((full['Sex']=='female')|(full['Age']<=12)),'Age']=60
4.4、条件筛选
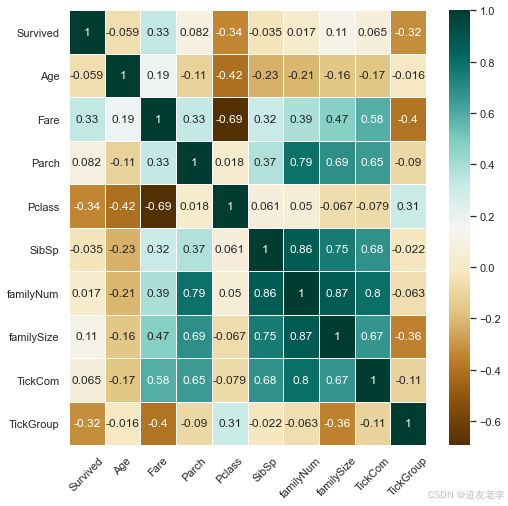
在对数据进行分析处理的过程中,数据的维度更高了,为提升数据有效性需要对数据进行降维处理。通过找出与乘客生存率“Survived”相关性更高的特征,剔除重复的且相关性较低的特征,从而实现数据降维。
#人工筛选
fullSel=full.drop(['Cabin','Name','Ticket','PassengerId','Surname','SurnameNum'],axis=1)
#查看各特征与标签的相关性
corrDf=pd.DataFrame()
corrDf=fullSel.corr()
corrDf['Survived'].sort_values(ascending=True)
Pclass       -0.338481
TickGroup    -0.319278
Age          -0.059466
SibSp        -0.035322
familyNum     0.016639
TickCom       0.064962
Parch         0.081629
familySize    0.108631
Fare          0.331805
Survived      1.000000
Name: Survived, dtype: float64
通过热力图,查看Survived与其他特征间相关性大小。
#热力图,查看Survived与其他特征间相关性大小
plt.figure(figsize=(8,8))
sns.heatmap(fullSel[['Survived','Age','Embarked','Fare','Parch','Pclass',
                    'Sex','SibSp','Title','familyNum','familySize','Deck',
                     'TickCom','TickGroup']].corr(),cmap='BrBG',annot=True,
           linewidths=.5)
_ = plt.xticks(rotation=45)
# 删除相关性系数低的属性
fullSel=fullSel.drop(['Age','Parch','SibSp','familyNum','TickCom'],axis=1)
#one-hot编码
fullSel=pd.get_dummies(fullSel)
fullSel.head()
5、构建模型
本项目比较了SCV/Decision Tree/Gradient Boosting/LDA/KNN/Logistic Regression等多种机器学习算法的结果,并对表现较好的算法做进一步的对比,最终选择Gradient Boosting对乘客生存率进行预测。
5.1、模型选择
5.1.1、建立模型
主要考虑使用以下常用的机器学习算法进行比较:
- SCV
- Decision Tree
- Extra Trees
- Gradient Boosting
- Random Forest
- KNN
- Logistic Regression
- Linear Discriminant Analysis
#拆分实验数据与预测数据
experData=fullSel[fullSel['Survived'].notnull()] # 已有数据
preData=fullSel[fullSel['Survived'].isnull()] # 预测数据

experData_X=experData.drop('Survived',axis=1)
experData_y=experData['Survived']

preData_X=preData.drop('Survived',axis=1) # 空数据

#导入机器学习算法库
from sklearn.ensemble import RandomForestClassifier,GradientBoostingClassifier,ExtraTreesClassifier
from sklearn.discriminant_analysis import LinearDiscriminantAnalysis
from sklearn.linear_model import LogisticRegression
from sklearn.neighbors import KNeighborsClassifier
from sklearn.tree import DecisionTreeClassifier
from sklearn.svm import SVC
from xgboost import XGBClassifier
from sklearn.model_selection import GridSearchCV,cross_val_score,StratifiedKFold

#设置kfold,交叉采样法拆分数据集
kfold=StratifiedKFold(n_splits=10)

#汇总不同模型算法
classifiers=[]
classifiers.append(SVC())
classifiers.append(DecisionTreeClassifier())
classifiers.append(RandomForestClassifier())
classifiers.append(ExtraTreesClassifier())
classifiers.append(GradientBoostingClassifier())
classifiers.append(KNeighborsClassifier())
classifiers.append(LogisticRegression())
classifiers.append(LinearDiscriminantAnalysis())
classifiers.append(XGBClassifier())
5.1.2、比较各种算法结果,进一步选择模型
#不同机器学习交叉验证结果汇总
cv_results=[]
for classifier in classifiers:
    cv_results.append(cross_val_score(classifier,experData_X,experData_y,
                                      scoring='accuracy',cv=kfold,n_jobs=-1))

#求出模型得分的均值和标准差
cv_means=[]
cv_std=[]
for cv_result in cv_results:
    cv_means.append(cv_result.mean())
    cv_std.append(cv_result.std())

#汇总数据
cvResDf=pd.DataFrame({'cv_mean':cv_means,
                     'cv_std':cv_std,
                     'algorithm':['SVC','DecisionTreeCla','RandomForestCla','ExtraTreesCla',
                                  'GradientBoostingCla','KNN','LR','LDA','Xgboost']})

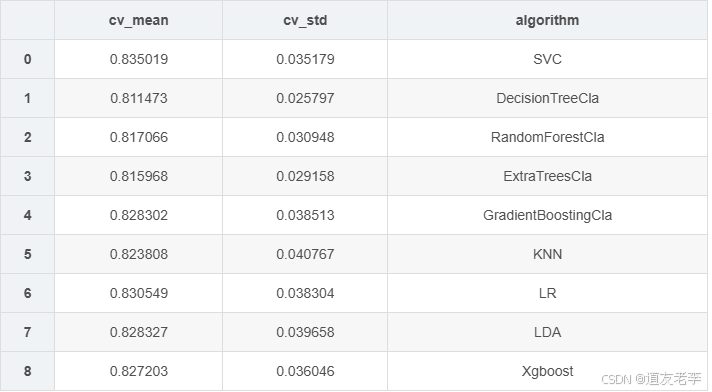
cvResDf
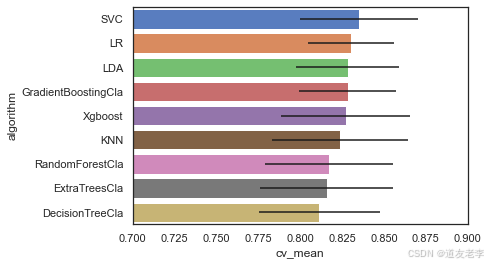
可视化查看不同算法的表现情况
bar = sns.barplot(data=cvResDf.sort_values(by='cv_mean',ascending=False),
                  x='cv_mean',y='algorithm',**{'xerr':cv_std})
bar.set(xlim = (0.7,0.9))
[(0.7, 0.9)]
SVC、LR、LDA以及GradientBoostingCla模型在该问题中表现较好。
5.1.3、模型调优
综合以上模型表现,考虑选择SVC、LDA、GradientBoostingCla、LR四种模型进一步对比。
分别建立对应模型,并进行模型调优。
#GradientBoostingClassifier模型
GBC = GradientBoostingClassifier()
gb_param_grid = {'loss' : ["deviance"],
              'n_estimators' : [100,200,300],
              'learning_rate': [0.1, 0.05, 0.01],
              'max_depth': [4, 8],
              'min_samples_leaf': [100,150],
              'max_features': [0.3, 0.1]
              }
modelgsGBC = GridSearchCV(GBC,param_grid = gb_param_grid, cv=kfold,
                                     scoring="accuracy", n_jobs= -1, verbose = 1)
modelgsGBC.fit(experData_X,experData_y)
modelgsGBC.best_score_
Fitting 10 folds for each of 72 candidates, totalling 720 fits


0.838414481897628
#LogisticRegression模型
modelLR=LogisticRegression()
LR_param_grid = {'C' : [1,2,3],
                'penalty':['l1','l2']}
modelgsLR = GridSearchCV(modelLR,param_grid = LR_param_grid, cv=kfold,
                                     scoring="accuracy", n_jobs= -1, verbose = 1)
modelgsLR.fit(experData_X,experData_y)
modelgsLR.best_score_
Fitting 10 folds for each of 6 candidates, totalling 60 fits


0.830561797752809
#SVC模型
svc = SVC()
gb_param_grid = {'C' : [0.1,0.5,1,2,3,5,10],
              'kernel':['rbf','poly','sigmoid']
              }
modelgsSVC = GridSearchCV(svc,param_grid = gb_param_grid, cv=kfold,
                                     scoring="accuracy", n_jobs= -1, verbose = 1)
modelgsSVC.fit(experData_X,experData_y)
modelgsSVC.best_score_
Fitting 10 folds for each of 21 candidates, totalling 210 fits


0.8350187265917602
#LDA模型
lda = LinearDiscriminantAnalysis()
gb_param_grid = {'solver' : ['svd', 'lsqr', 'eigen'],
              'tol':[0.000001,0.00001,0.0001,0.001,0.01]
              }
modelgsLDA = GridSearchCV(lda,param_grid = gb_param_grid, cv=kfold,
                                     scoring="accuracy", n_jobs= -1, verbose = 1)
modelgsLDA.fit(experData_X,experData_y)
modelgsLDA.best_score_
Fitting 10 folds for each of 15 candidates, totalling 150 fits


0.8283270911360798
5.2、模型评估
5.2.1、查看模型准确率
#modelgsGBC模型
print('modelgsGBC模型得分为:%.3f'%modelgsGBC.best_score_)
#modelgsLR模型
print('modelgsLR模型得分为:%.3f'%modelgsLR.best_score_)
#modelgsSVC模型
print('modelgsSVC模型得分为:%.3f'%modelgsSVC.best_score_)
#modelgsLDA模型
print('modelgsLDA模型得分为:%.3f'%modelgsLDA.best_score_)
'''
modelgsGBC模型得分为:0.840
modelgsLR模型得分为:0.831
modelgsSVC模型得分为:0.835
modelgsLDA模型得分为:0.828
''
GBC模型得分(即模型准确性)更高,继续比较其他指标的差异。
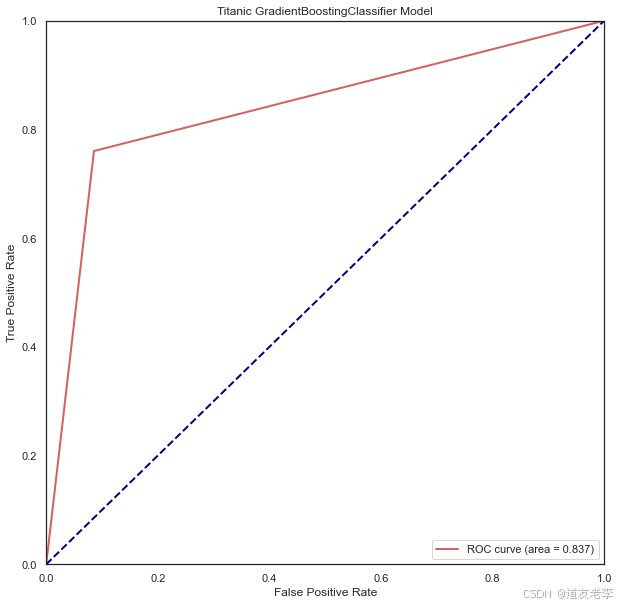
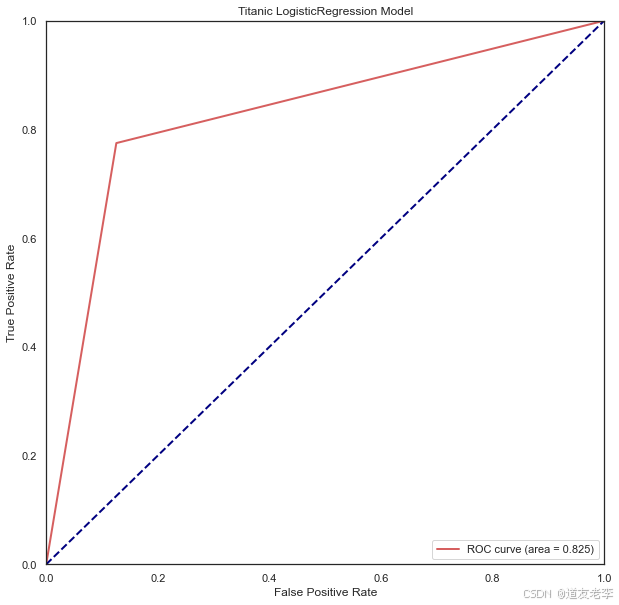
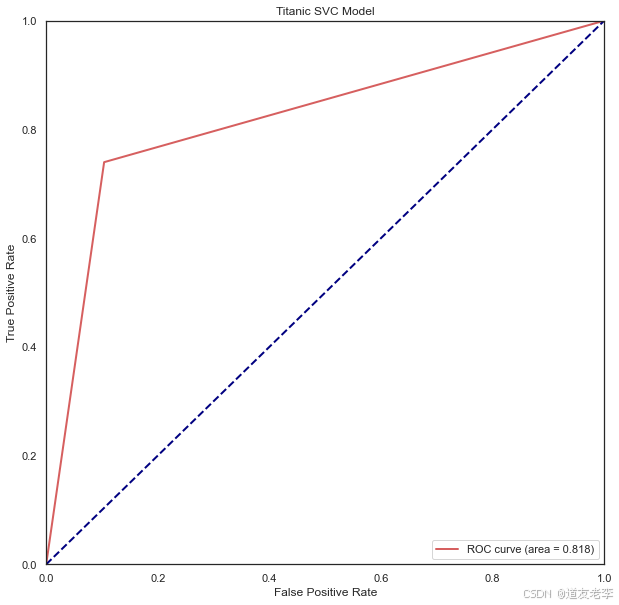
5.2.2、查看模型ROC曲线
#查看模型ROC曲线
#求出测试数据模型的预测值
modelgsGBCtestpre_y=modelgsGBC.predict(experData_X).astype(int)

#画图
from sklearn.metrics import roc_curve, auc  ###计算roc和auc
# Compute ROC curve and ROC area for each class
fpr,tpr,threshold = roc_curve(experData_y, modelgsGBCtestpre_y) ###计算真正率和假正率
roc_auc = auc(fpr,tpr) ###计算auc的值

plt.figure()
lw = 2
plt.figure(figsize=(10,10))
plt.plot(fpr, tpr, color='r',
         lw=lw, label='ROC curve (area = %0.3f)' % roc_auc) ###假正率为横坐标,真正率为纵坐标做曲线
plt.plot([0, 1], [0, 1], color='navy', lw=lw, linestyle='--')
plt.xlim([0.0, 1.0])
plt.ylim([0.0, 1.0])
plt.xlabel('False Positive Rate')
plt.ylabel('True Positive Rate')
plt.title('Titanic GradientBoostingClassifier Model')
plt.legend(loc="lower right")
plt.show()
#查看模型ROC曲线
#求出测试数据模型的预测值
modelgsLRtestpre_y=modelgsLR.predict(experData_X).astype(int)
#画图
from sklearn.metrics import roc_curve, auc  ###计算roc和auc
# Compute ROC curve and ROC area for each class
fpr,tpr,threshold = roc_curve(experData_y, modelgsLRtestpre_y) ###计算真正率和假正率
roc_auc = auc(fpr,tpr) ###计算auc的值

plt.figure()
lw = 2
plt.figure(figsize=(10,10))
plt.plot(fpr, tpr, color='r',
         lw=lw, label='ROC curve (area = %0.3f)' % roc_auc) ###假正率为横坐标,真正率为纵坐标做曲线
plt.plot([0, 1], [0, 1], color='navy', lw=lw, linestyle='--')
plt.xlim([0.0, 1.0])
plt.ylim([0.0, 1.0])
plt.xlabel('False Positive Rate')
plt.ylabel('True Positive Rate')
plt.title('Titanic LogisticRegression Model')
plt.legend(loc="lower right")
plt.show()
#查看模型ROC曲线
#求出测试数据模型的预测值
modelgsSVCtestpre_y=modelgsSVC.predict(experData_X).astype(int)
#画图
from sklearn.metrics import roc_curve, auc  ###计算roc和auc
# Compute ROC curve and ROC area for each class
fpr,tpr,threshold = roc_curve(experData_y, modelgsSVCtestpre_y) ###计算真正率和假正率
roc_auc = auc(fpr,tpr) ###计算auc的值

plt.figure()
lw = 2
plt.figure(figsize=(10,10))
plt.plot(fpr, tpr, color='r',
         lw=lw, label='ROC curve (area = %0.3f)' % roc_auc) ###假正率为横坐标,真正率为纵坐标做曲线
plt.plot([0, 1], [0, 1], color='navy', lw=lw, linestyle='--')
plt.xlim([0.0, 1.0])
plt.ylim([0.0, 1.0])
plt.xlabel('False Positive Rate')
plt.ylabel('True Positive Rate')
plt.title('Titanic SVC Model')
plt.legend(loc="lower right")
plt.show()
GBDT、LR和SVC模型ROC曲线均左上偏,AUC分别为0.838和0.825、0.818,即
GradientBoostingClassifier模型效果较好。
5.2.3、查看混淆矩阵
#混淆矩阵
from sklearn.metrics import confusion_matrix
print('GradientBoostingClassifier模型混淆矩阵为\n',confusion_matrix(experData_y,modelgsGBCtestpre_y))
print('LogisticRegression模型混淆矩阵为\n',confusion_matrix(experData_y,modelgsLRtestpre_y))
print('SVC模型混淆矩阵为\n',confusion_matrix(experData_y,modelgsSVCtestpre_y))
GradientBoostingClassifier模型混淆矩阵为
 [[502  47]
 [ 82 260]]
LogisticRegression模型混淆矩阵为
 [[480  69]
 [ 77 265]]
SVC模型混淆矩阵为
 [[492  57]
 [ 89 253]]
0表示死亡,1表示存活
通过混淆矩阵可以看出:
1、GBDT模型真正率TPR为503/(503 + 46) = 912,假正率FPR为0.236,
2、LR模型真正率TPR为0.874,假正率FPR为0.225,
3、SVC模型真正率TPR为0.896,假正率FPR为0.260
说明GBS找出正例能力很强,同时也不易将负例错判为正例。
综合考虑,本项目中将利用GBC方法进行模型预测。
综上所述,选择GBDT模型比较好
6、模型预测
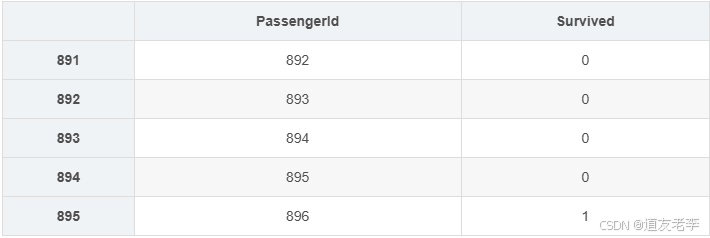
利用模型进行预测,并按规则导出预测结果
#TitanicGBSmodle
y_ =modelgsGBC.predict(preData_X)
y_ = y_.astype(int)
#导出预测结果
GBCpreResultDf=pd.DataFrame()
GBCpreResultDf['PassengerId']=full['PassengerId'][full['Survived'].isnull()]
GBCpreResultDf['Survived']= y_
GBCpreResultDf
#将预测结果导出为csv文件
GBCpreResultDf.to_csv('./lufengkun_titanic.csv',index=False)
display(GBCpreResultDf.head())
test
将结果上传至Kaggle中,最终预测得分为0.79186,排名约TOP3%。
在参与本次kaggle项目过程中,参考学习了很多其他竞赛方案的分析思路以及数据处理技巧,如:考虑同组效应、数据对数化处理、多种模型比较结果优劣等等。在项目过程中,主要从以下三个方面对模型改进来提升准确率:
- 模型选优:分别选取多种模型进行建模,根据模型评分进行初步比较,最终综合考虑多个性能指标来选择合适的预测模型;
- 特征挖掘与筛选:通过挖掘新的特征并测试选择不同特征时模型预测的准- 确性,来选择最终训练模型的特征集合;
- 数据整容:缺失值的填充方法以及“不合群”数据的处理也直接影响模型的最终预测结果。
