维基百科:https://zh.wikipedia.org/wiki/%E5%B8%83%E6%9E%97%E5%B8%A6
布林带是一个常用的股价分析方法,它立足于收盘价:
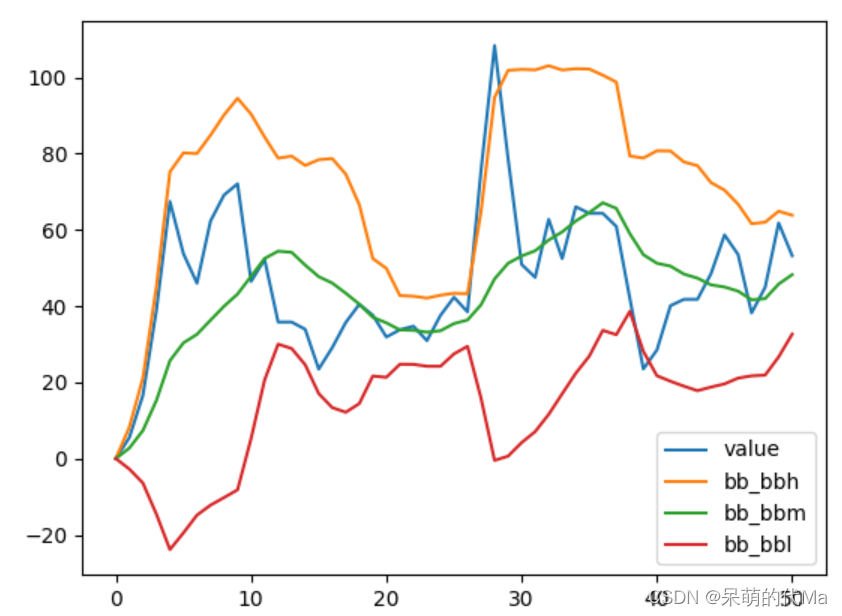
含义
- 中轨:股价的平均成本
- 上轨:压力线
- 下轨:支撑线
公式
- 中轨:N时间段的简单移动平均
- 上轨 = 中轨 + K × N时间段的标准差
- 下轨 = 中轨 − K × N时间段的标准差
示例代码
借助ta库进行计算,github项目地址:https://github.com/bukosabino/ta
from ta.volatility import BollingerBands
import matplotlib.pyplot as plt
import pandas as pd

values = [0., 5.49450549, 16.54422925, 38.89059797, 67.46202654, 53.73653634, 45.99959243, 62.31437171, 69.14364,
          72.09059481, 46.47483126, 52.23852003, 35.81339925, 35.81339925, 33.91225857, 23.47582593, 29.10962875,
          35.71963819, 40.4724899, 37.60716039, 31.89287467, 33.78681407, 34.73558067, 30.93691021, 37.55942676,
          42.32133152, 38.49358033, 75.67184534, 108.34511267, 78.66241052, 50.93298339, 47.53739765, 62.76582404,
          52.45654569, 66.06198787, 64.33784994, 64.33784994, 60.89550915, 42.02758462,
          23.5090661, 28.46774379, 40.09565076, 41.77632303, 41.77632303, 48.51032977,
          58.67982129, 53.54283499, 38.21063738, 44.92204677, 61.81393866, 53.22287337, ] # 一般是收盘价
df = pd.DataFrame(pd.Series(values), columns=['value'])
# window 就是公式中的 N,window_dev就是公式中的 K
indicator_bb = BollingerBands(close=df['value'], window=10, window_dev=2, fillna=True)
df['bb_bbh'] = indicator_bb.bollinger_hband()  # 布林带 上轨
df['bb_bbm'] = indicator_bb.bollinger_mavg()  # 布林带 中轨
df['bb_bbl'] = indicator_bb.bollinger_lband()  # 布林带 下轨
df.plot()
plt.show()
效果图: