1. 特征工程
- 专业上:30个人特征来自于临床一线专家,每个特征和都有医学内涵;
- 数据上:30个中可能有一些是冗余的。
1.1 特征筛选
- 从30个选出重要的,踢掉不重要的。
- 从数据的角度来讲,不建议进行特征筛选,做特征筛选可能只是为了解释性,给领导看看而已。因为再不重要的特征都有信息,筛选掉必然导致信息的丢失。
- 线性回归的系数代表该项特征的重要性,系数就代表权重。
- 使用协方差或皮尔逊系数判断两列特征的相关性。
1.2 特征降维 PCA
- 把原来30个特征中的核心信息中抽取出来,融合到新生成的几个特征中,新的特征不是原来的任何一个!
- PCA(Principal Component Analysis,主成分分析)
1.3 SVD奇异值分解
- SVD(奇异值分解)是一种在信号处理、统计学、机器学习等领域广泛应用的矩阵分解方法。
- 它可以将一个矩阵分解为三个特定的矩阵的乘积,这三个矩阵分别是:一个正交矩阵、一个对角矩阵(其元素为奇异值,且按从大到小排列)以及另一个正交矩阵的转置。
2. 代码
2.1 逻辑回归、二分类问题
y = F ( X ) = s i g m o i d ( x 0 w 0 + x 1 w 1 + x 2 w 2 + . . . + x 12 w 12 ) y=F(X)=sigmoid(x_0w_0+x_1w_1+x_2w_2+...+x_{12}w_{12}) y=F(X)=sigmoid(x0w0+x1w1+x2w2+...+x12w12)
from sklearn.datasets import load_breast_cancer
X,y=load_breast_cancer(return_X_y=True)
print(X.shape,y.shape)  #:(569, 30) (569,)

from sklearn.model_selection import train_test_split
X_train,X_test,y_train,y_test = train_test_split(X,y)
# 逻辑回归,实际是二分类,就是线性回归加了一个激活函数 sigmoid
from sklearn.linear_model import LogisticRegression
lr=LogisticRegression(max_iter=10000)
lr.fit(X_train,y_train)
pred=lr.predict(X_test)
acc=(pred==y_test).mean()
print(acc)
2.2 特征降维 PCA
# 特征降维 PCA(主成分分析)
from sklearn.decomposition import PCA
pca = PCA(n_components=20)
pca.fit(X_train)
X_train1 = pca.transform(X_train)
# 原始数据
lr = LogisticRegression(max_iter=10000)
lr.fit(X_train,y_train)
(lr.predict(X_test)==y_test).mean()  #:0.965034965034965
# 10个特征
lr1 = LogisticRegression(max_iter=10000)
# 特征降维
# 1. 构建
pca=PCA(n_components=10)
# 2. 拟合
pca.fit(X_train)
# 3. 转换
X_train1 = pca.transform(X_train)
X_test1 = pca.transform(X_test)

lr1.fit(X_train1,y_train)
(lr1.predict(X_test1)==y_test).mean()  #:0.958041958041958
2.3 SVD奇异值分解
import numpy as np
from matplotlib import pyplot as plt
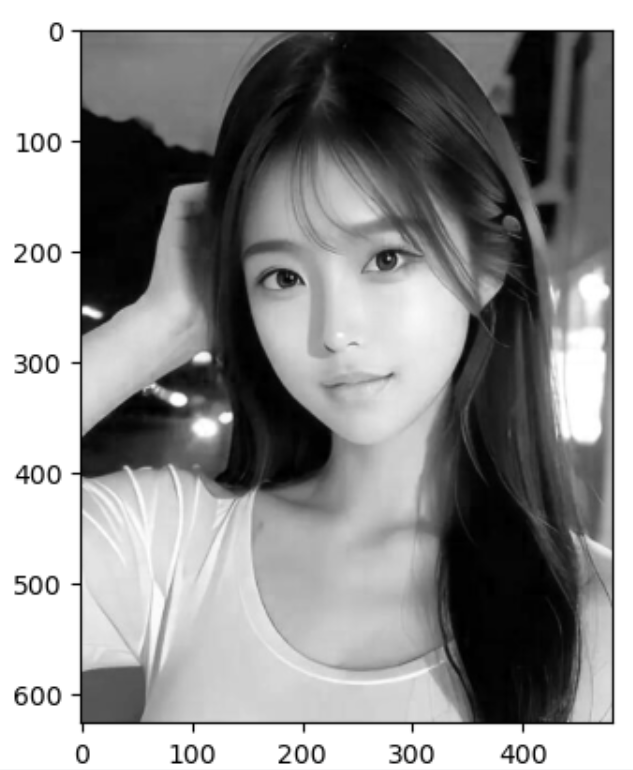
beauty = plt.imread(fname="beauty.jpg")
# [Height, Width, Channel]
print(beauty.shape)  #:(627, 481, 3)
r=beauty[:,:,0]
plt.imshow(r,cmap='gray')
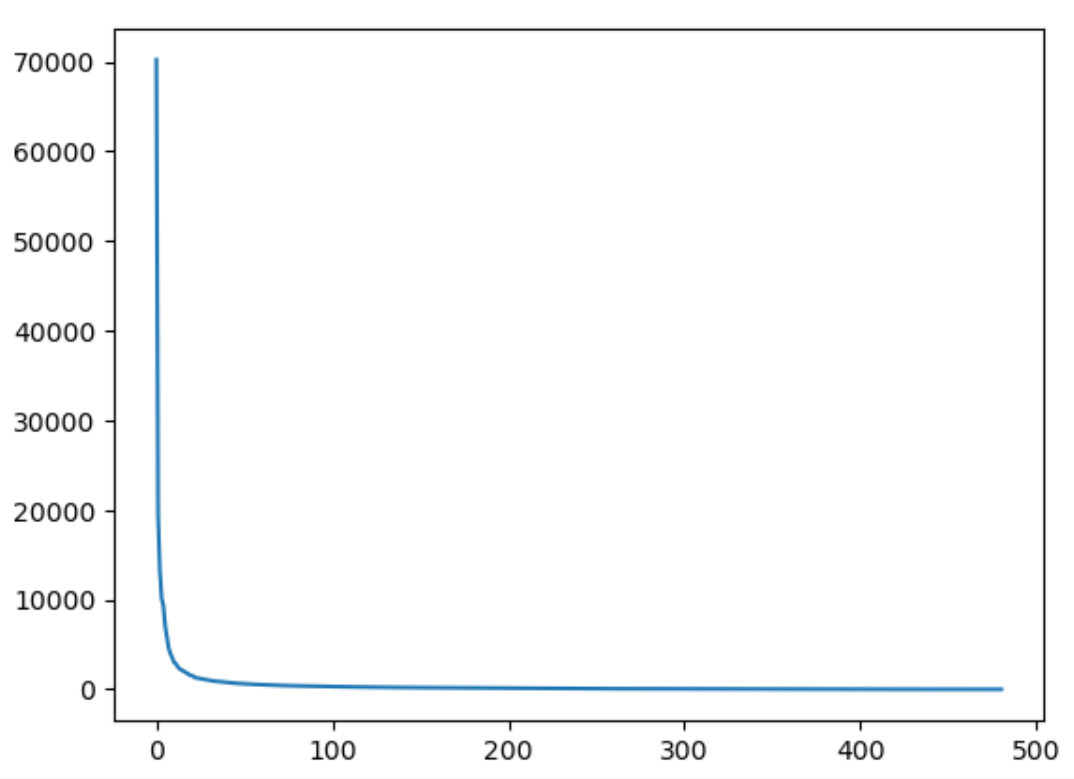
U, S, V = np.linalg.svd(a=r, full_matrices=False)
print(U.shape,S.shape, V.shape)  #: (627, 481) (481,) (481, 481)
plt.plot(S)
"""
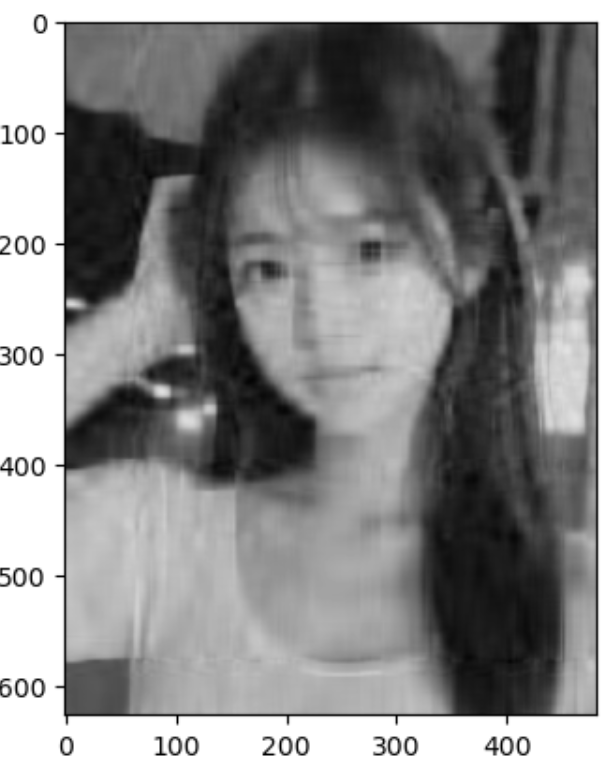
    降维之后的效果
"""
K = 20
restore = U[:,:K] @ np.diag(S[:K]) @ V[:K, :]
plt.imshow(X=restore, cmap="gray")


