算法学习、4对1辅导、论文辅导、核心期刊
项目的代码和数据下载可以通过公众号滴滴我
数据下载
算法学习、4对1辅导、论文辅导、核心期刊
项目的代码和数据下载可以通过公众号滴滴我
项目介绍
在当今的综艺市场中,《创造营 2020》无疑是一部具有相当影响力的选秀节目。而豆瓣作为一个汇聚了众多观众评价的平台,其上关于《创造营 2020》的短评数据犹如一座蕴藏丰富信息的宝藏。对这些短评数据进行深入分析,能够让我们从多个维度窥探观众对这档节目的真实看法。
数据描述
数据共500行,共7个字段。分别是:user_name、page_url、rating_num、comment_time、short_comment、votes_num、city_name。
以下是表的部分数据:
分析数据
1、数据读入和数据预处理
导入所需包
# 导入所需包
import numpy as np
import pandas as pd
import re
import jieba
import jieba.analyse

from pyecharts.charts import Pie, Bar, Map, Line, WordCloud, Page
from pyecharts import options as opts
from pyecharts.globals import SymbolType
读入数据
# 读入数据
df = pd.read_csv('创造营豆瓣短评.csv')
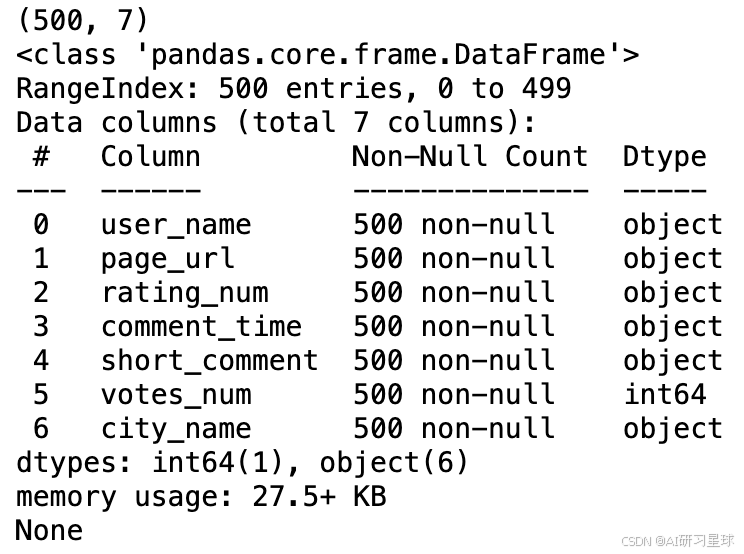
print(df.shape)
print(df.info())
查看重复值和空值
# 查看重复值和空值
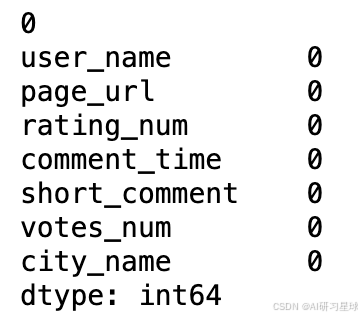
print(df.duplicated().sum())
print(df.isnull().sum())
处理评分列
# 处理评分列
df['rating_num'] = df['rating_num'].str.replace('\d+-\d+-\d+\s+\d+:\d+:\d+', '推荐')

# 定义字典
rating_dict = {
            '很差': '1星',
            '较差': '2星',
            '还行': '3星',
            '推荐': '4星',
            '力荐': '5星'
}

df['rating_num'] = df['rating_num'].map(rating_dict)
df.rating_num.value_counts()
城市数据处理
# 城市数据处理
# 国外数据
df['city_name'] = df['city_name'].map(lambda x:'国外' if re.search('[a-zA-Z]', x) else x)

# 处理国内数据
def tranform_city(x):
    if '中国' in x:
        return x[2:]
    elif '新疆' in x:
        return '新疆'
    elif '江西' in x:
        return '江西'
    elif len(x) == 4 and '中国' not in x:
        return x[:2]
    elif len(x) > 4:
        return x[:3]
    else:
        return x

df['city_name'] = df['city_name'].map(lambda x: tranform_city(x))
df.city_name.value_counts()[:5]
通过jieba库进行分词
# 分词
def get_jieba_words(txt):
    # 添加词典
    jieba.add_word('黄子韬')
    jieba.add_word('比婧好')
    jieba.add_word('一脸问号')
    jieba.add_word('舞担')
    jieba.add_word('歌担')

    # 评论字段分词处理
    word_num = jieba.lcut(txt)

    # 停用词
    stop_words = []
    with open(r"停用词汇总.txt", 'r', encoding='utf-8') as f:
        lines = f.readlines()
        for line in lines:
            stop_words.append(line.strip())

    # 添加停用词
    stop_words.extend(['一点', '一套', '2019', '2020', '一回',
                       '一秒', '几个', '每一秒', '一季', '第一季',
                       '三个', '一到', '真的', '第一集'
                      ])

    # 计数
    word_num_count = {}

    for i in word_num:
        if i not in stop_words and len(i) >= 2:
            word_num_count[i] = word_num.count(i)

    # 存储数据
    key_words = pd.Series(word_num_count).reset_index().rename({'index': 'words', 0: 'num'}, axis=1)
    key_words.head()

    return key_words[:100]
2、数据可视化
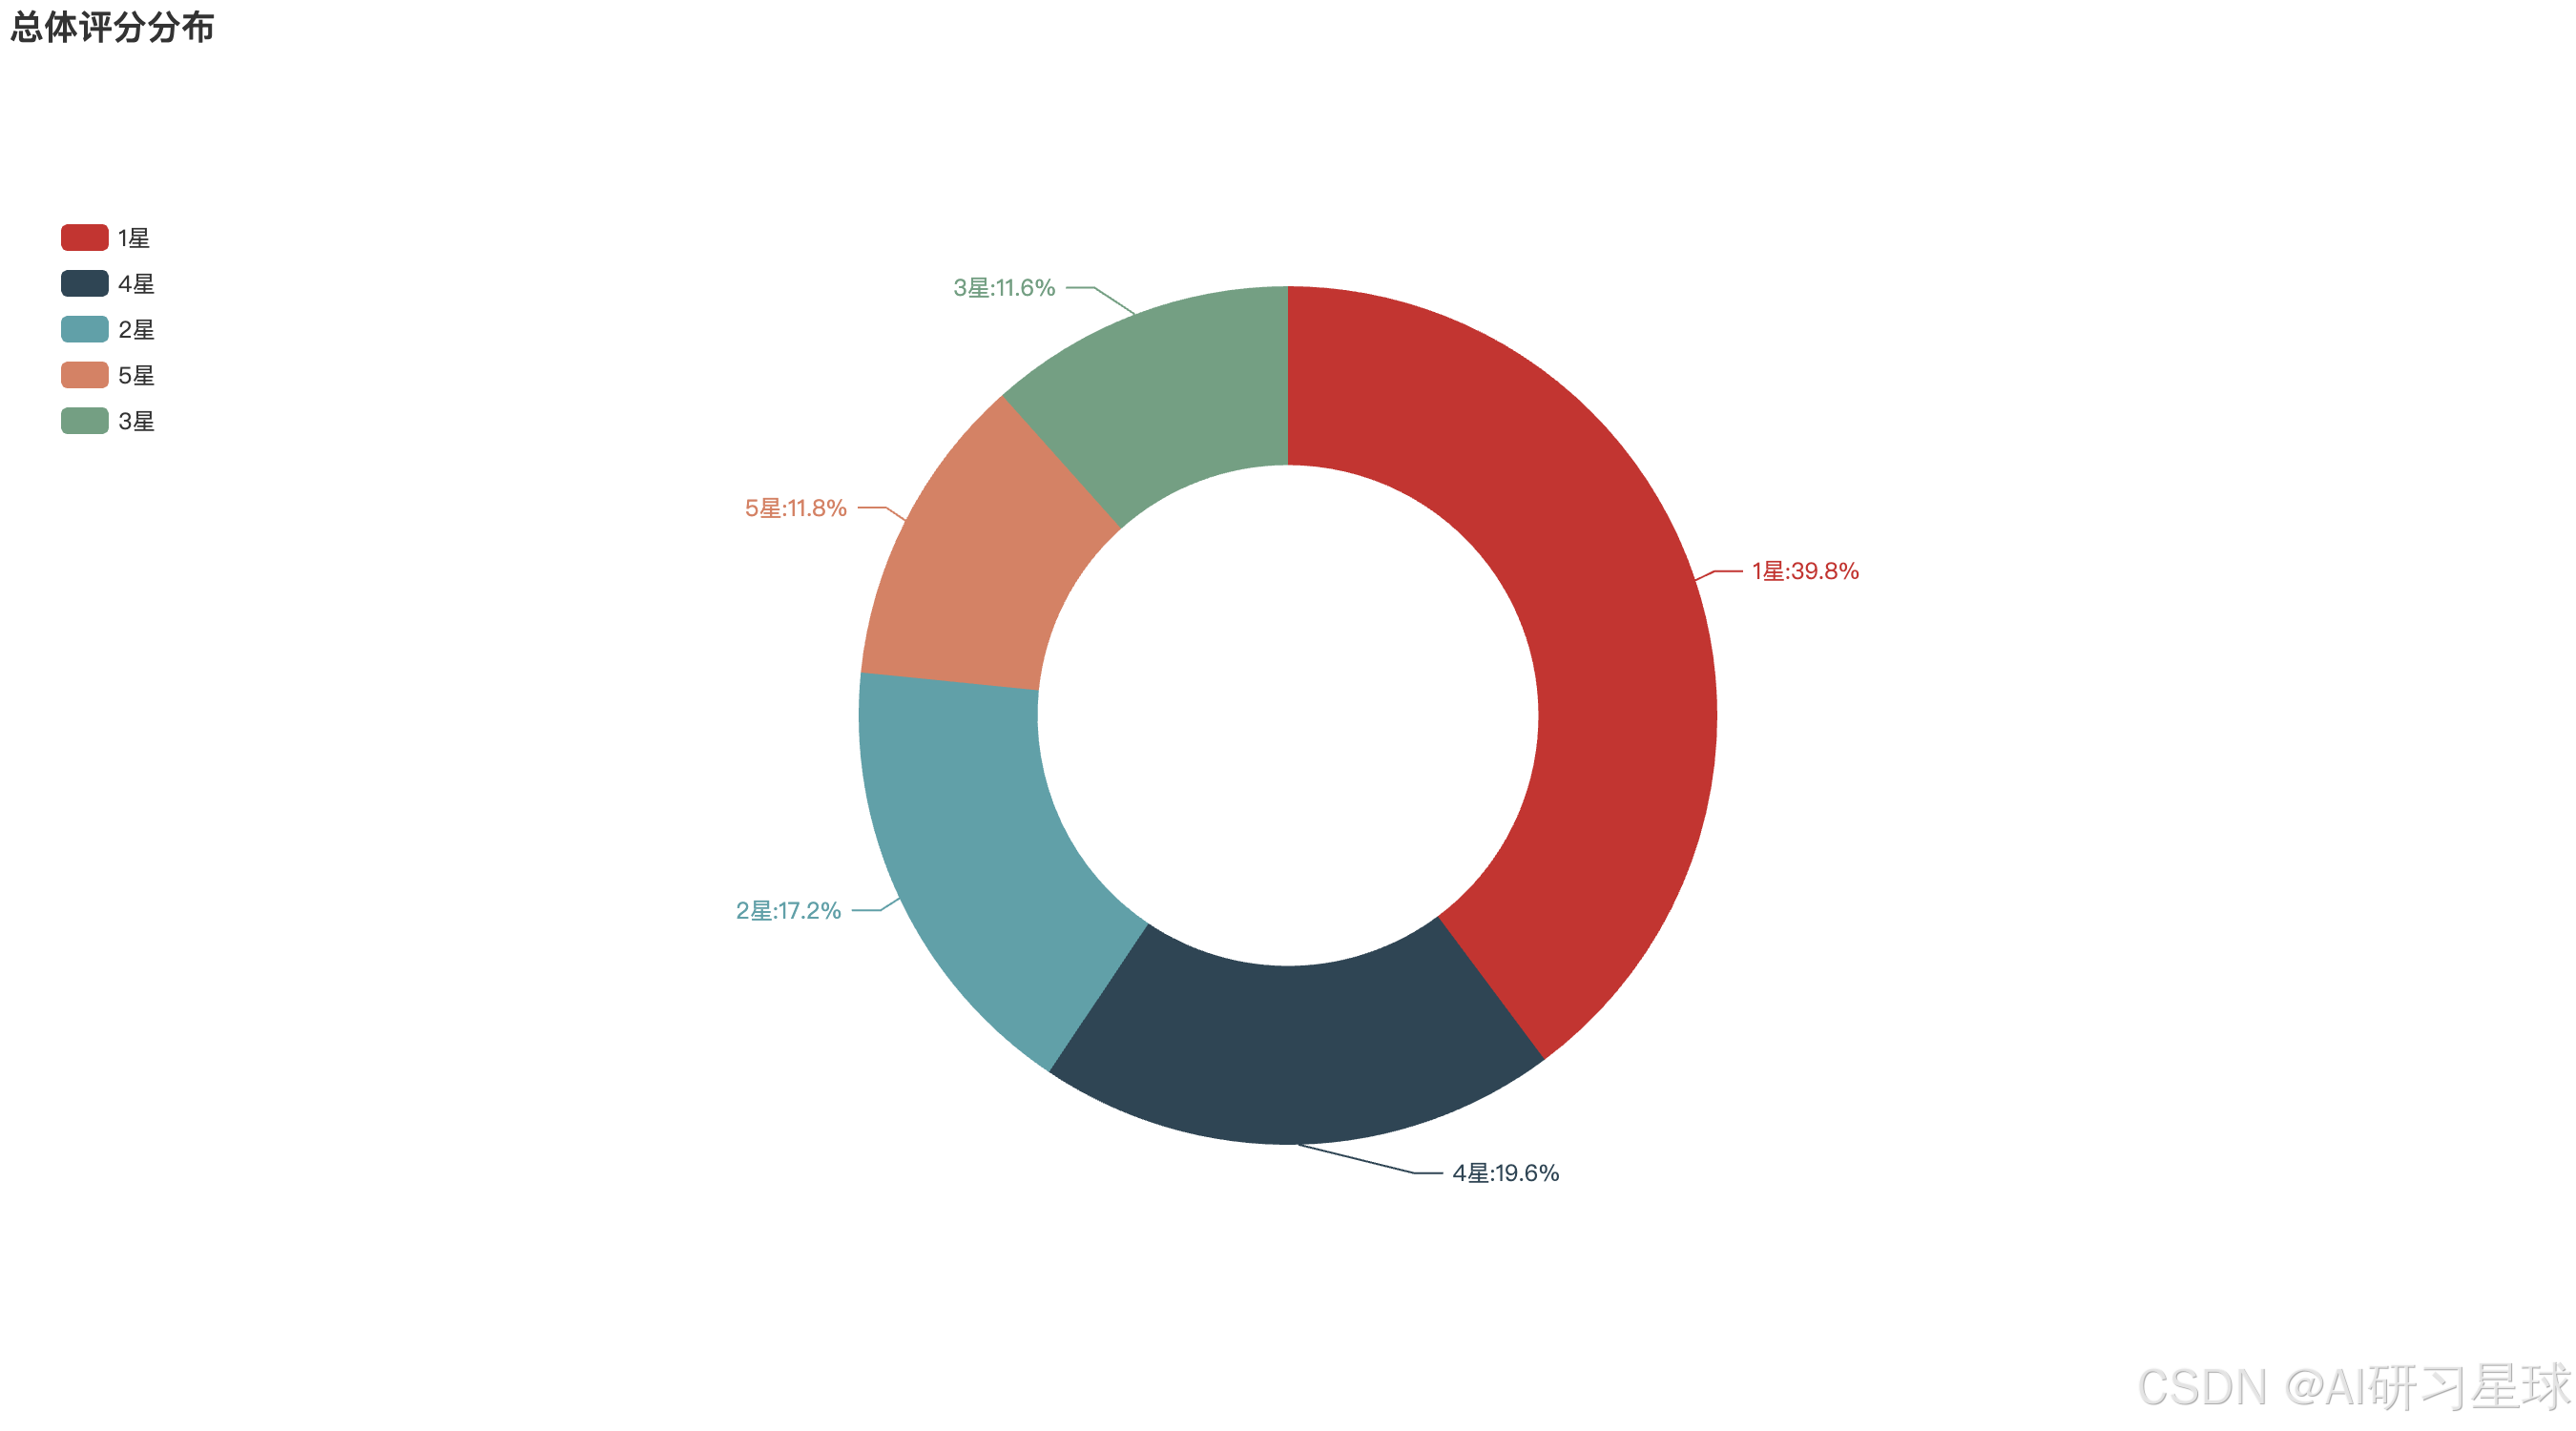
a、总体评分分布
rating_num = df.rating_num.value_counts()
rating_num
# 数据对
data_pair = [list(z) for z in zip(rating_num.index.tolist(), rating_num.values.tolist())]

# 绘制饼图
pie1 = Pie(init_opts=opts.InitOpts(width='1350px', height='750px'))
pie1.add('', data_pair=data_pair, radius=['35%', '60%'])
pie1.set_global_opts(title_opts=opts.TitleOpts(title='总体评分分布'),
#                      toolbox_opts=opts.ToolboxOpts(),
                     legend_opts=opts.LegendOpts(orient='vertical', pos_top='15%', pos_left='2%'))
pie1.set_series_opts(label_opts=opts.LabelOpts(formatter="{b}:{d}%"))
pie1.render_notebook()
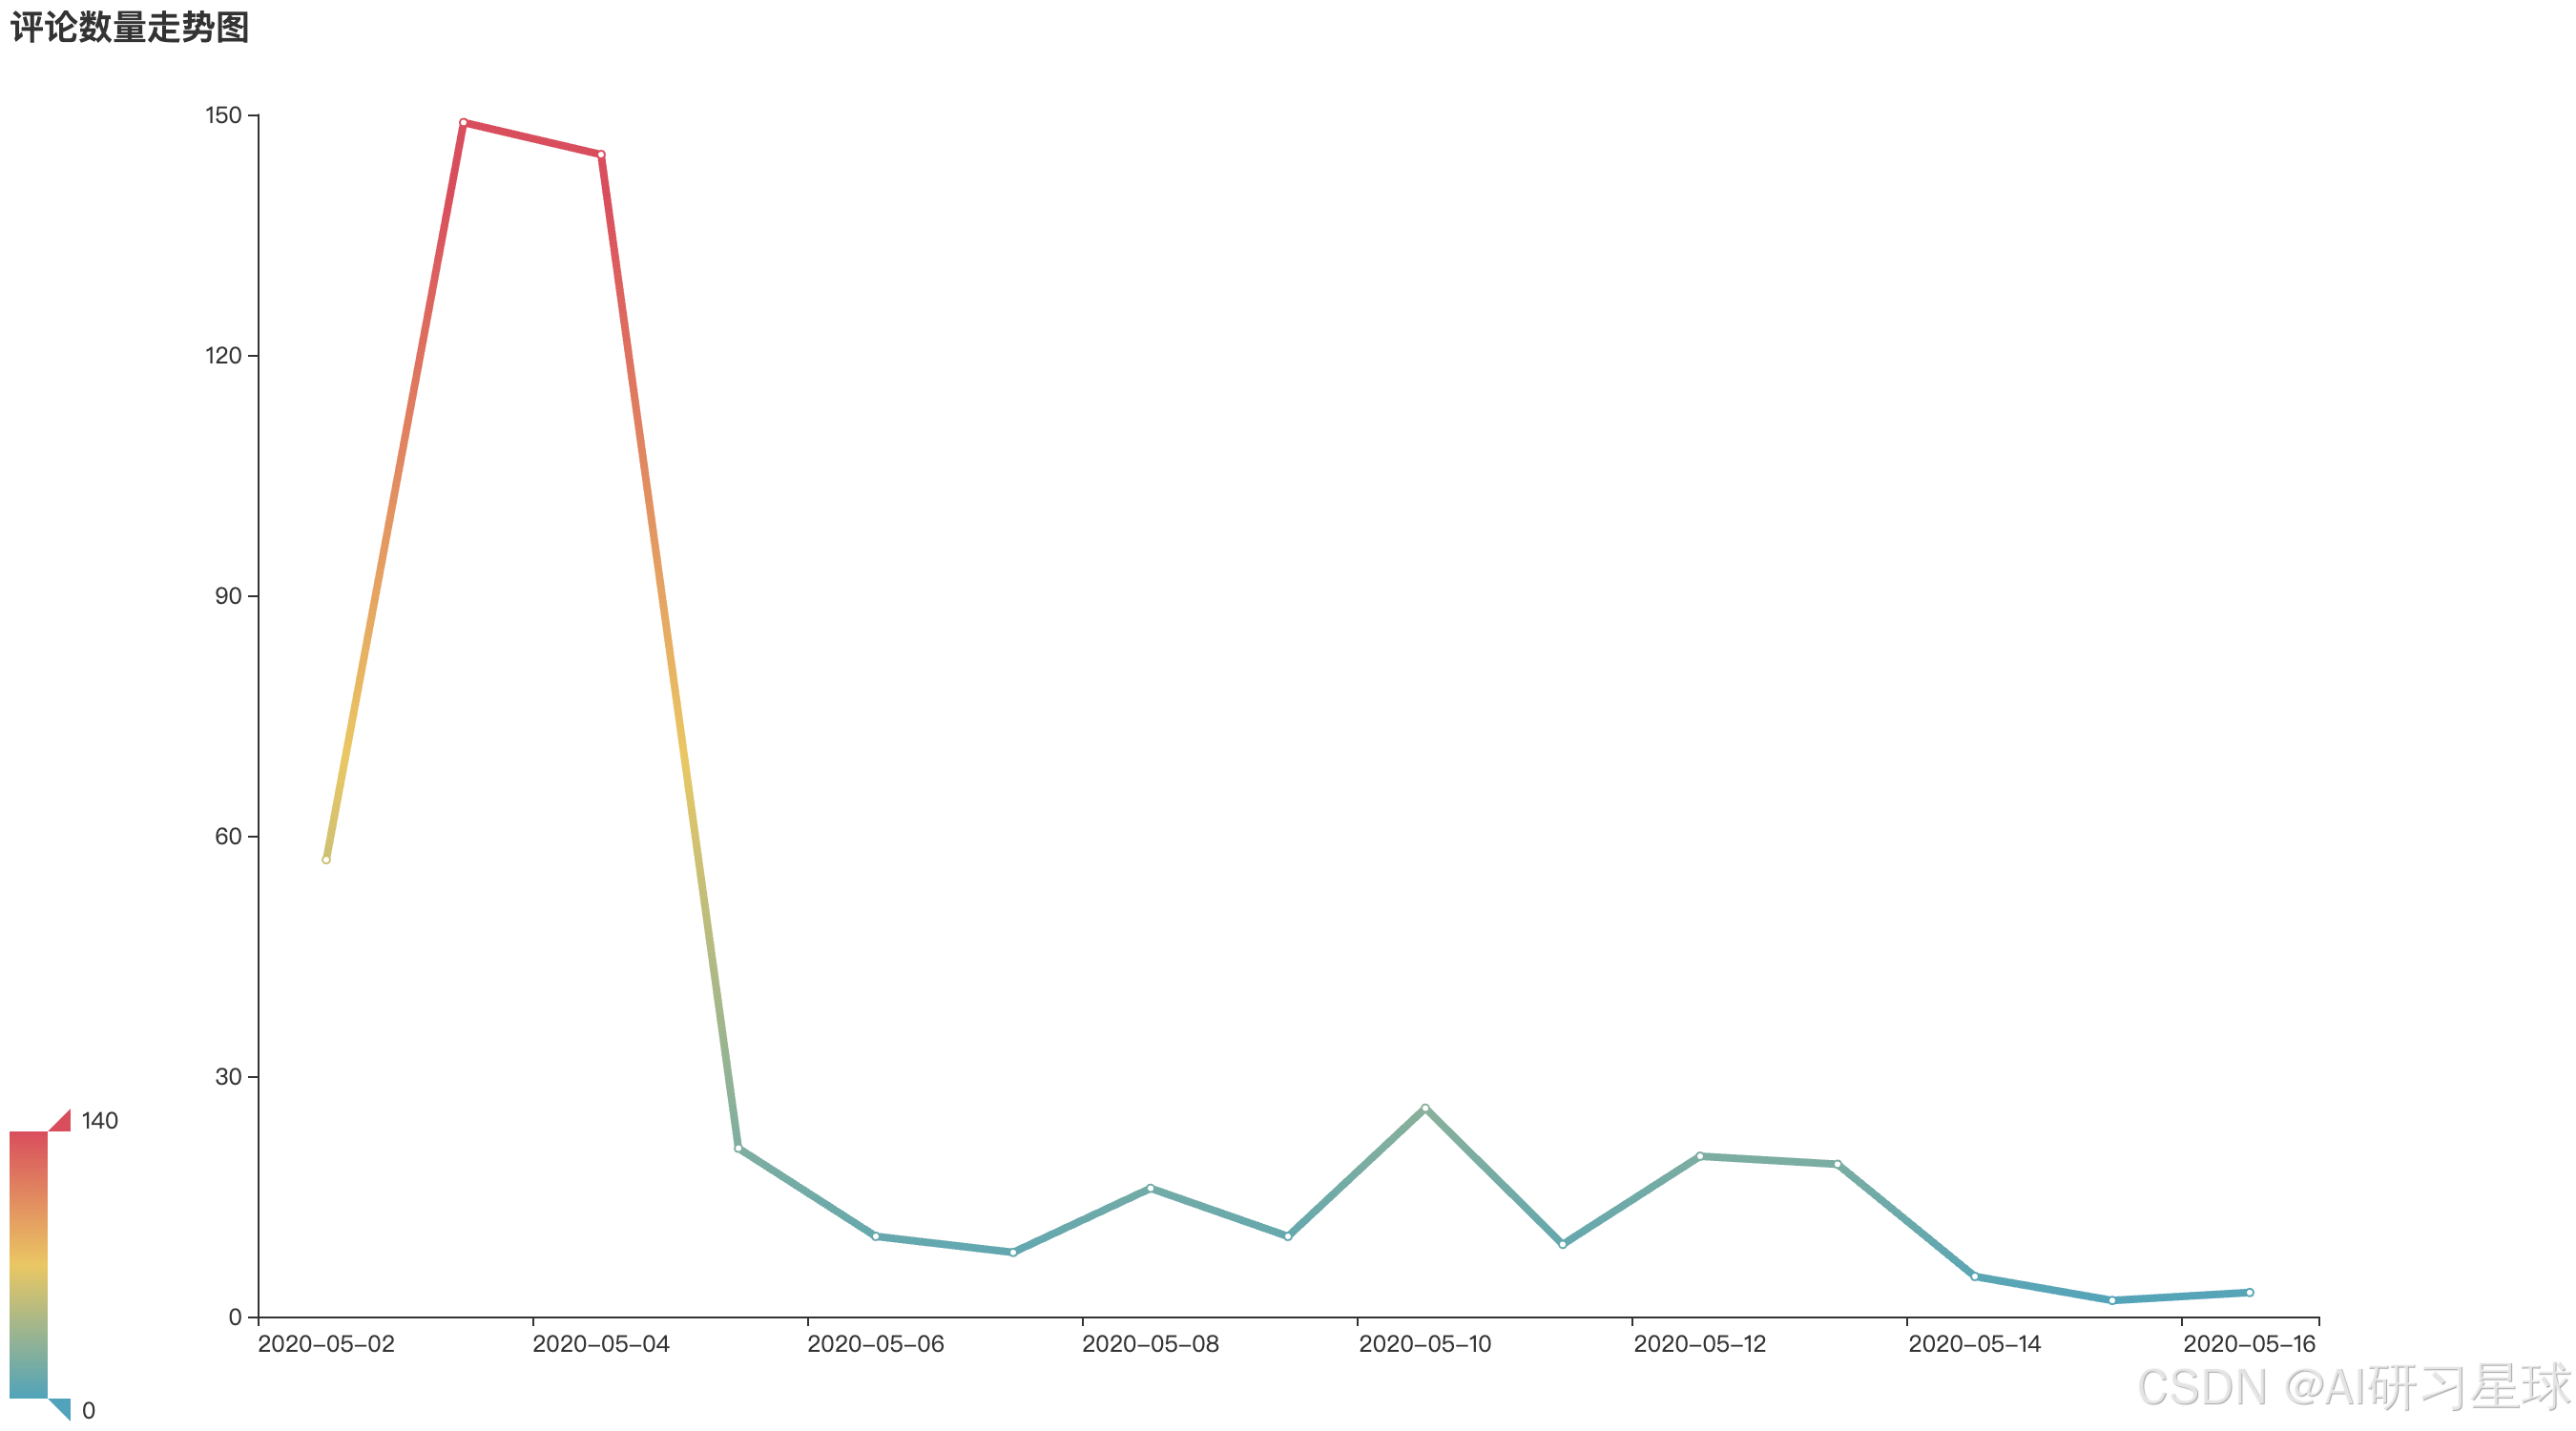
b、评论数量走势图
comment_date = pd.to_datetime(df['comment_time']).dt.date.value_counts().sort_index()
comment_date
# 折线图
line1 = Line(init_opts=opts.InitOpts(width='1350px', height='750px'))
line1.add_xaxis(comment_date.index.tolist())
line1.add_yaxis('', comment_date.values.tolist(),
                #areastyle_opts=opts.AreaStyleOpts(opacity=0.5),
                label_opts=opts.LabelOpts(is_show=False))
line1.set_global_opts(title_opts=opts.TitleOpts(title='评论数量走势图'),
#                       toolbox_opts=opts.ToolboxOpts(),
                      visualmap_opts=opts.VisualMapOpts(max_=140))
line1.set_series_opts(linestyle_opts=opts.LineStyleOpts(width=4))
line1.render_notebook()
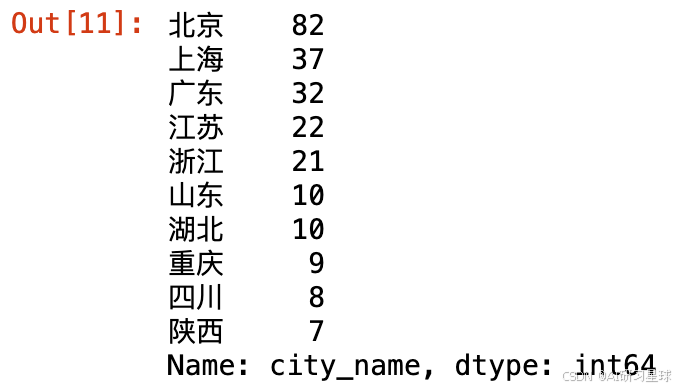
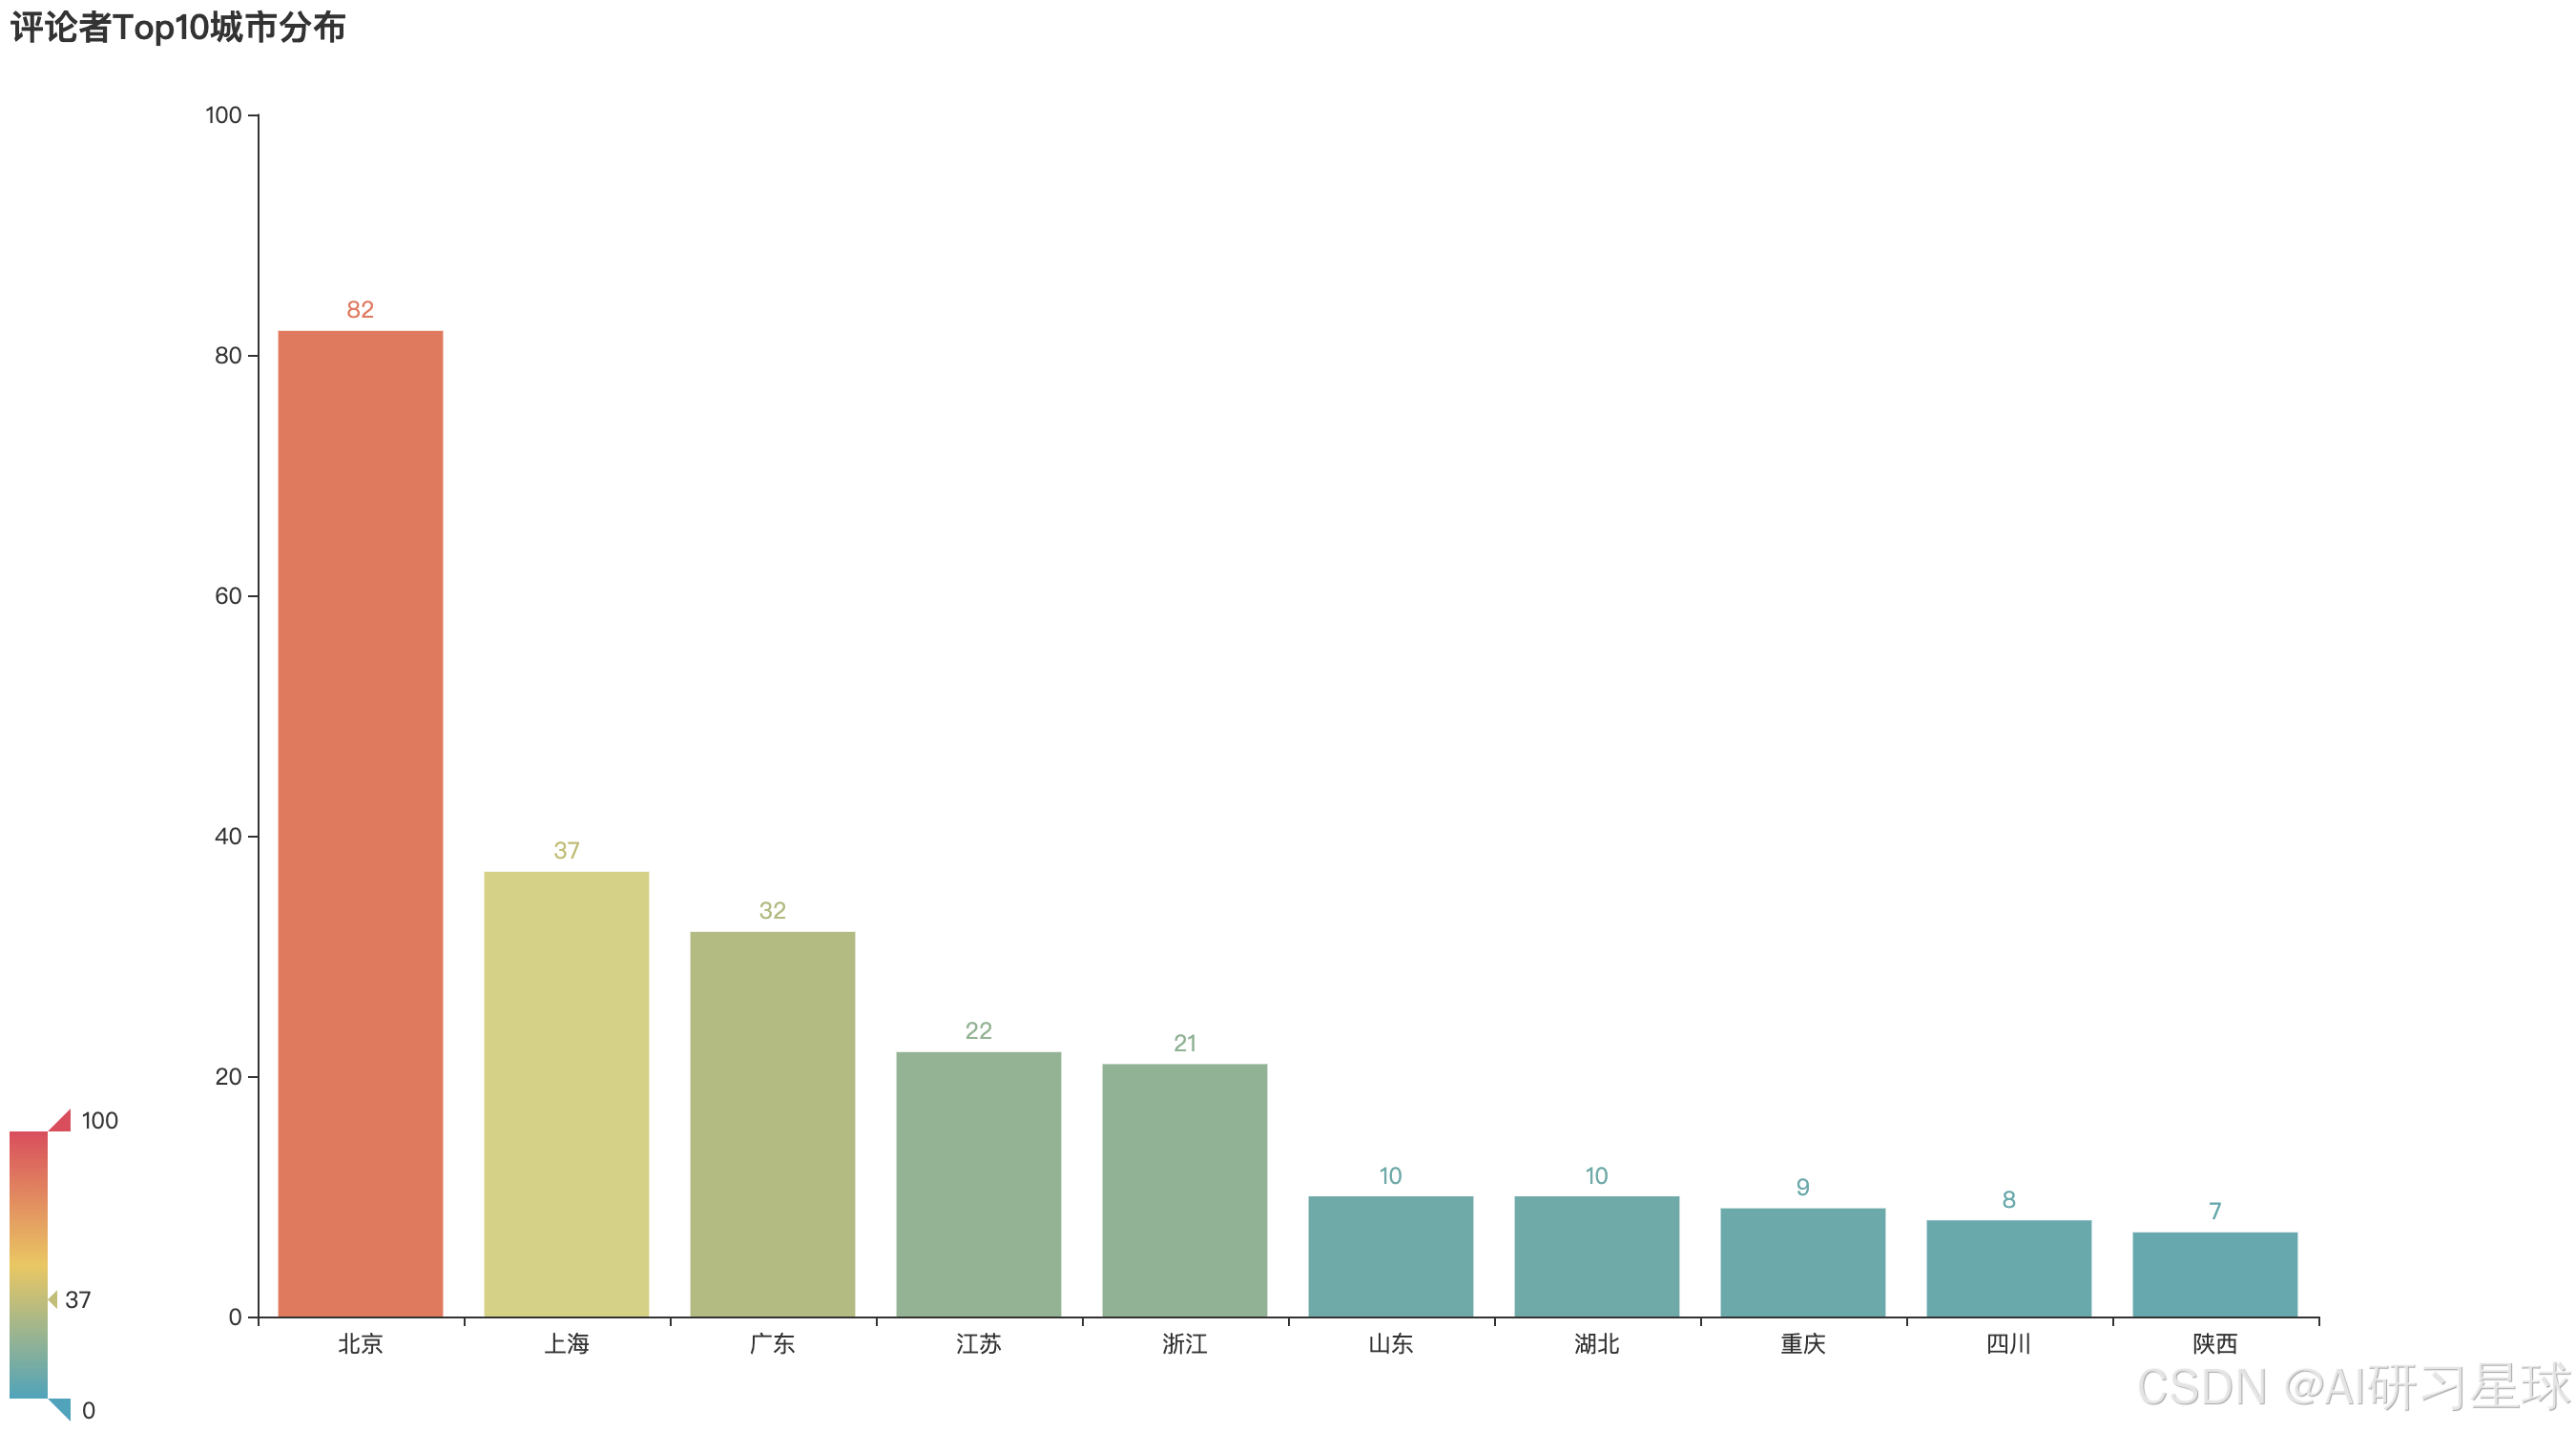
c、评论者Top10城市分布
# 国内城市top10
city_top10 = df['city_name'].value_counts()[:12]
city_top10.drop('国外', inplace=True)
city_top10.drop('未知', inplace=True)
city_top10
# 条形图
bar1 = Bar(init_opts=opts.InitOpts(width='1350px', height='750px'))
bar1.add_xaxis(city_top10.index.tolist())
bar1.add_yaxis("", city_top10.values.tolist())
bar1.set_global_opts(title_opts=opts.TitleOpts(title="评论者Top10城市分布"),
                     visualmap_opts=opts.VisualMapOpts(max_=100),
                    )
bar1.render_notebook()
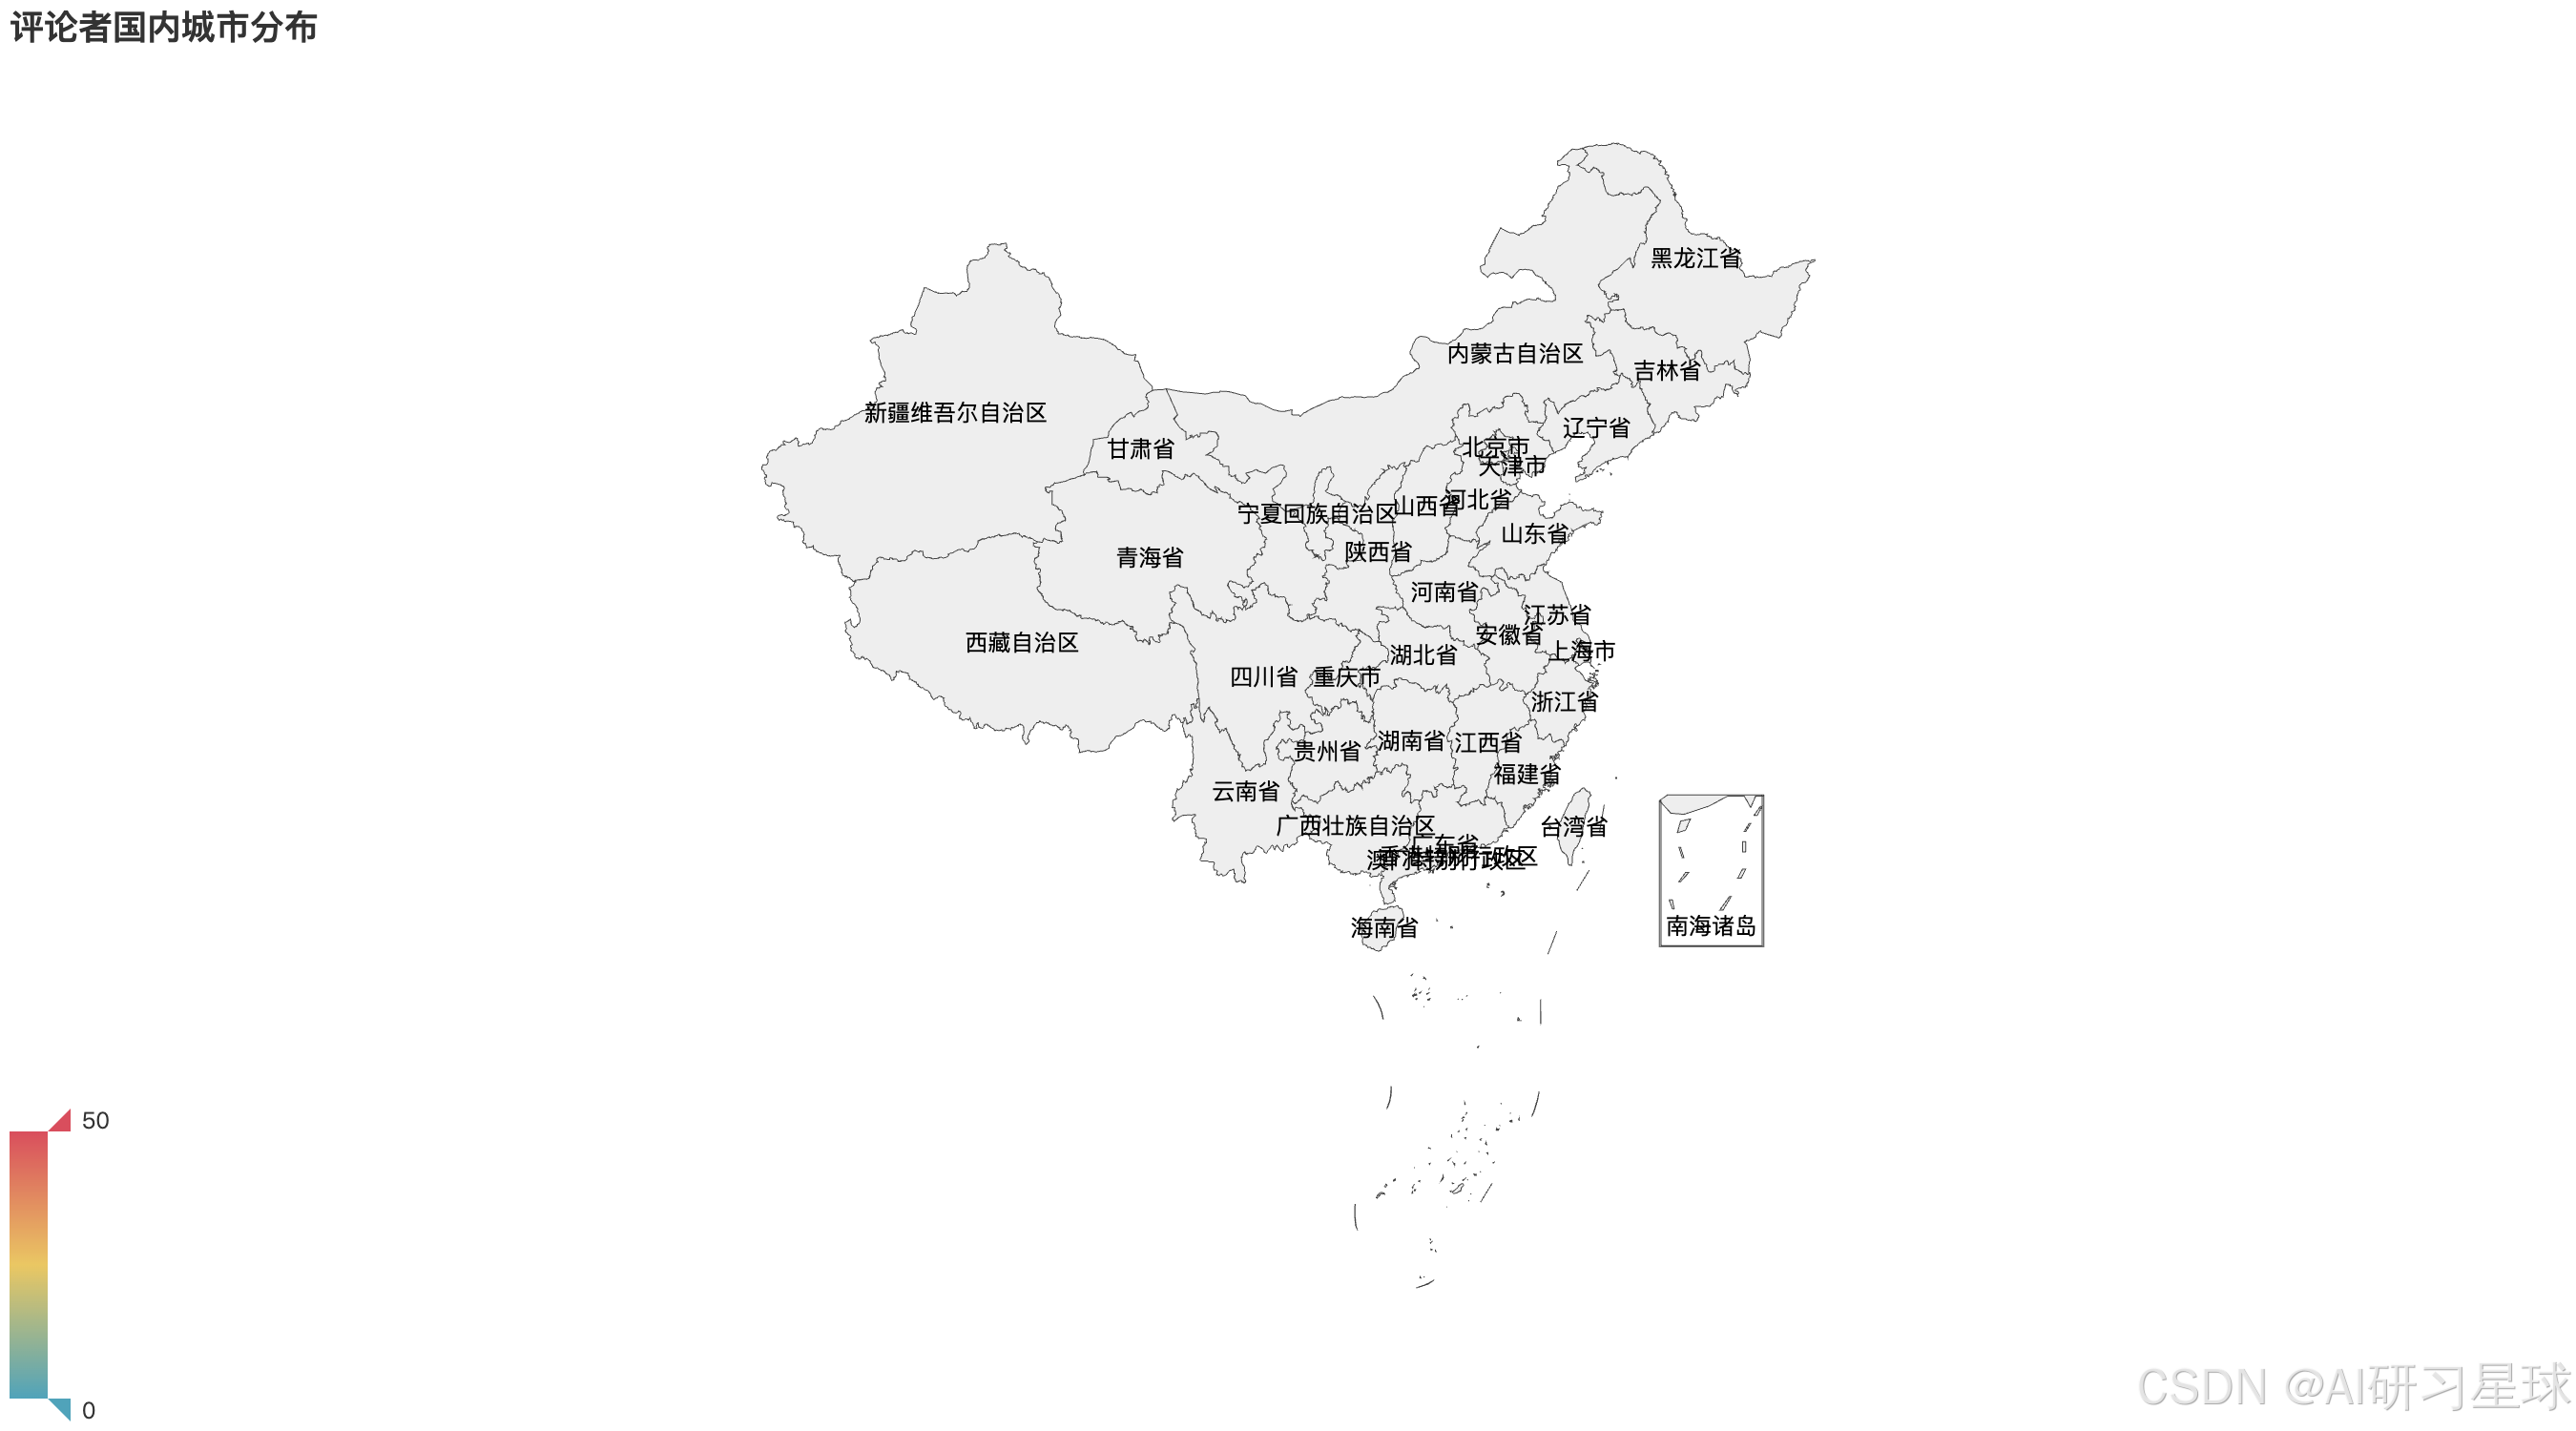
d、评论者国内城市分布
city_num = df.city_name.value_counts()
city_num[:5]
# 地图
map1 = Map(init_opts=opts.InitOpts(width='1350px', height='750px'))
map1.add("", [list(z) for z in zip(city_num.index.tolist(), city_num.values.tolist())],
         maptype='china')
map1.set_global_opts(title_opts=opts.TitleOpts(title='评论者国内城市分布'),
                     visualmap_opts=opts.VisualMapOpts(max_=50),
                    )
map1.render_notebook()
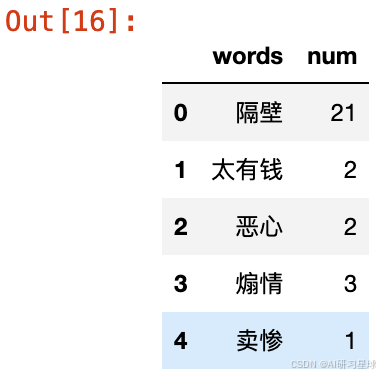
e、豆瓣评分很差/较差用户评价
# 选取子集
df1 = df[(df['rating_num']=='1星') | (df['rating_num']=='2星')]
df2 = df[(df['rating_num']=='4星') | (df['rating_num']=='5星')]

# 运行函数
key_words_1 = get_jieba_words(txt=df1['short_comment'].str.cat(sep='。'))
key_words_1.head()
key_words_2 = get_jieba_words(txt=df2['short_comment'].str.cat(sep='。'))
key_words_2.head()
算法学习、4对1辅导、论文辅导、核心期刊
项目的代码和数据下载可以通过公众号滴滴我

