上两篇文章我已经写了怎么用python在Neo4j中构造知识图谱。大家可以先看下这两篇文章。
知识图谱 之 python 操作neo4j (导入CSV操作)
知识图谱之python操作Neo4j构建复杂的知识图谱
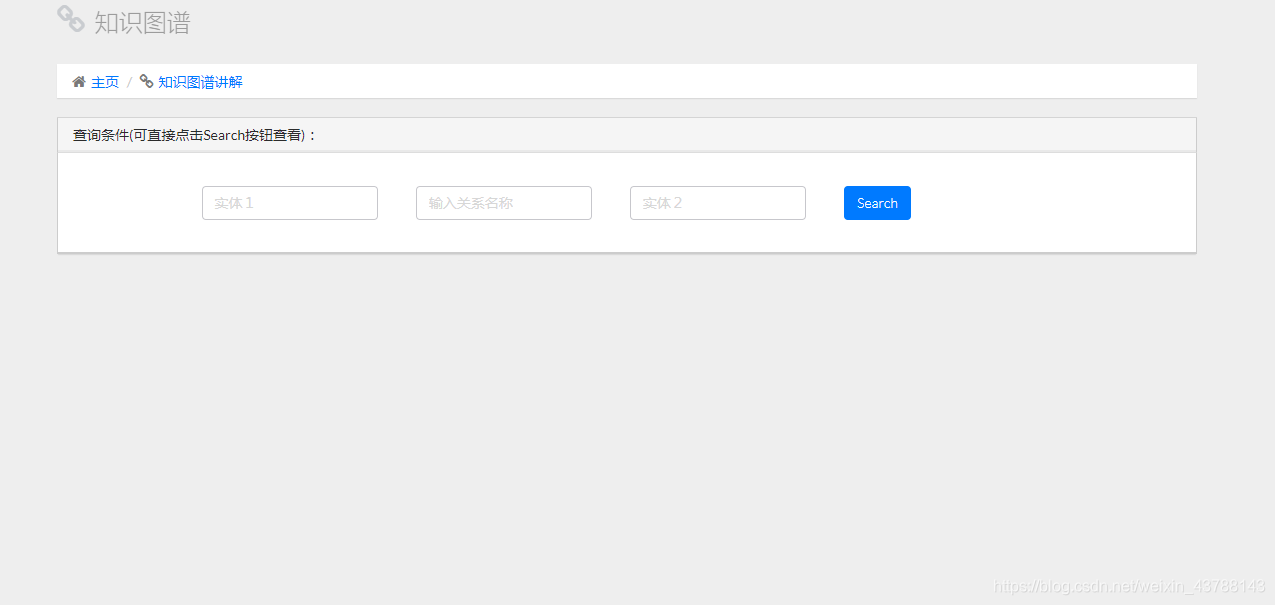
通过上面两篇文章我们已经能从pyhon中操作Neo4j图形数据库了。下面就是要想办法把Neo4j中的知识图谱显示在前端页面上。首先我们要会Django框架把前端页面显示出来。至于怎么搭建Django框架和显示网页我就不多说了,毕竟东西太多而且也不是今天的主要内容。直接展示一下搭建好的成果。
网页上面就显示了三个输入框和一个按钮。分别是实体一,实体二和关系以及一个查询按钮。
当我们输入实体或关系的的时候,系统接受到来自前端的数据,然后用python来操作Neo4j来返回我们要的图谱。
这段代码是我们根据不同实体和关系用python操作neo4j图形库从而获取不同的图谱。
#关系查询:实体1
	def findRelationByEntity1(self,entity1):
		answer = self.graph.run("MATCH (n1:person {name:\""+entity1+"\"})- [rel] -> (n2) RETURN n1,rel,n2" ).data()
		return answer

	# 关系查询:实体1+关系
	def findOtherEntities(self, entity, relation):
		answer = self.graph.run("MATCH (n1:person {name:\"" + entity + "\"})-[rel:" + relation + "]->(n2) RETURN n1,rel,n2").data()
		return answer
    #关系查询 整个知识图谱体系
	def zhishitupu(self):
		answer = self.graph.run("MATCH (n1:person)- [rel] -> (n2) RETURN n1,rel,n2 ").data()
		return answer
	#关系查询:实体2
	def findRelationByEntity2(self,entity1):
		answer = self.graph.run("MATCH (n1)- [rel] -> (n2:major {name:\""+entity1+"\"}) RETURN n1,rel,n2" ).data()
		if (len(answer)==0):
			answer = self.graph.run("MATCH (n1)- [rel] -> (n2:level {name:\"" + entity1 + "\"}) RETURN n1,rel,n2").data()
			if (len(answer) == 0):
				answer = self.graph.run("MATCH (n1)- [rel] -> (n2:univer {name:\"" + entity1 + "\"}) RETURN n1,rel,n2").data()
		return answer
这段代码是当前端数据传到后台时,我们连接Neo4j图形库,根据上面那段代码输入不同的实体和关系时调用不同的函数来返回给前端不同的知识图谱。
def search_relation(request):
	ctx = {}
	if(request.GET):
		db = neo4jconn
		entity1 = request.GET['entity1_text']
		relation = request.GET['relation_name_text']
		entity2 = request.GET['entity2_text']
		searchResult = {}
		#若只输入entity1,则输出与entity1有直接关系的实体和关系
		if(len(entity1) != 0 and len(relation) == 0 and len(entity2) == 0):
			searchResult = db.findRelationByEntity1(entity1)
			return render(request,'relation.html',{'searchResult':json.dumps(searchResult,ensure_ascii=False)})
		#若只输入entity2则,则输出与entity2有直接关系的实体和关系
		if(len(entity2) != 0 and len(relation) == 0 and len(entity1) == 0):
			searchResult = db.findRelationByEntity2(entity2)
			searchResult = sortDict(searchResult)
			if(len(searchResult)>0):
				return render(request,'relation.html',{'searchResult':json.dumps(searchResult,ensure_ascii=False)})
		#若输入entity1和relation,则输出与entity1具有relation关系的其他实体
		if(len(entity1)!=0 and len(relation)!=0 and len(entity2) == 0):
			searchResult = db.findOtherEntities(entity1,relation)
			searchResult = sortDict(searchResult)
			if(len(searchResult)>0):
				return render(request,'relation.html',{'searchResult':json.dumps(searchResult,ensure_ascii=False)})
		#若输入entity2和relation,则输出与entity2具有relation关系的其他实体
		if(len(entity2)!=0 and len(relation)!=0 and len(entity1) == 0):
			searchResult = db.findOtherEntities2(entity2,relation)
			searchResult = sortDict(searchResult)
			if(len(searchResult)>0):
				return render(request,'relation.html',{'searchResult':json.dumps(searchResult,ensure_ascii=False)})
		#全为空 则输出整个知识图谱
		if(len(entity1)==0 and len(relation)==0 and len(entity2) ==0 ):

			searchResult =db.zhishitupu()
			searchResult =sortDict(searchResult)
			#print(json.loads(json.dumps(searchResult)))
		return render(request,'relation.html',{'searchResult':json.dumps(searchResult,ensure_ascii=False)})
我们知道python从Neo4j中获取的是json格式的数据并不是图形。我们现在就是要想办法把json格式的数据用图形化的格式给显示出来。这就要用到Charts工具了, 它是JavaScript 实现的开源可视化库.至于怎么用Echarts制作大家可以看这个人写的,我觉得写得很细了。传送门
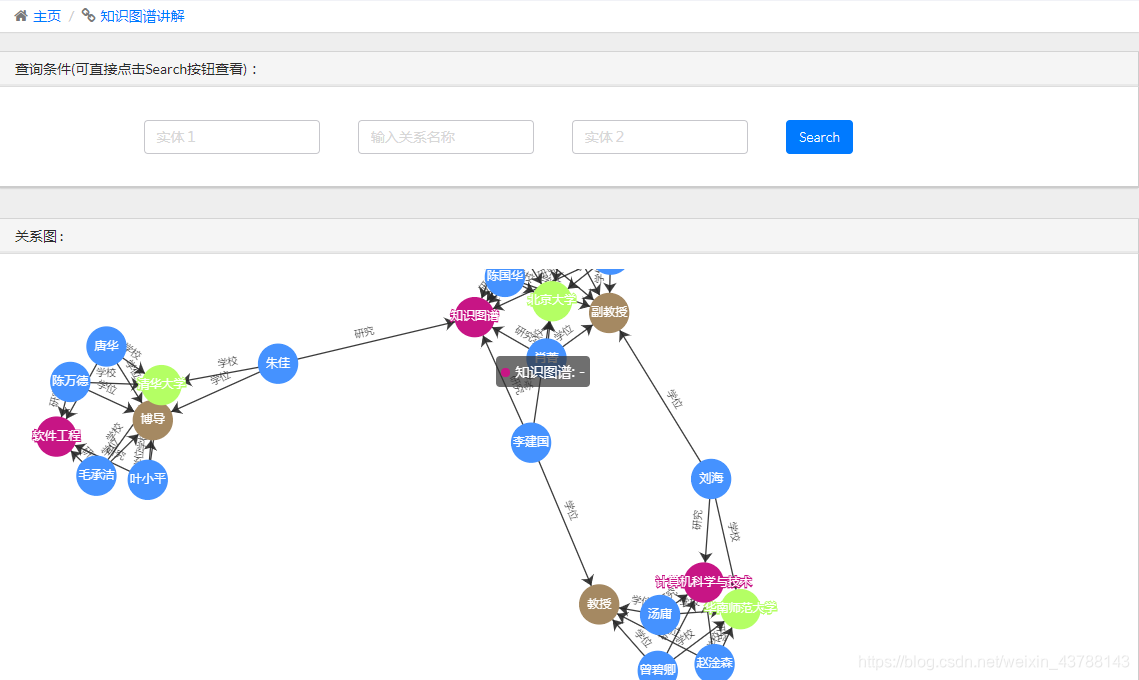
最后展示下效果:
后来买了一个阿里云服务器就把一些项目放到了网页上。这个知识图谱也在上面,大家也可以去看看。因为关系比较多有些关系没有考虑到所以还会出现错误,望大家见谅。

