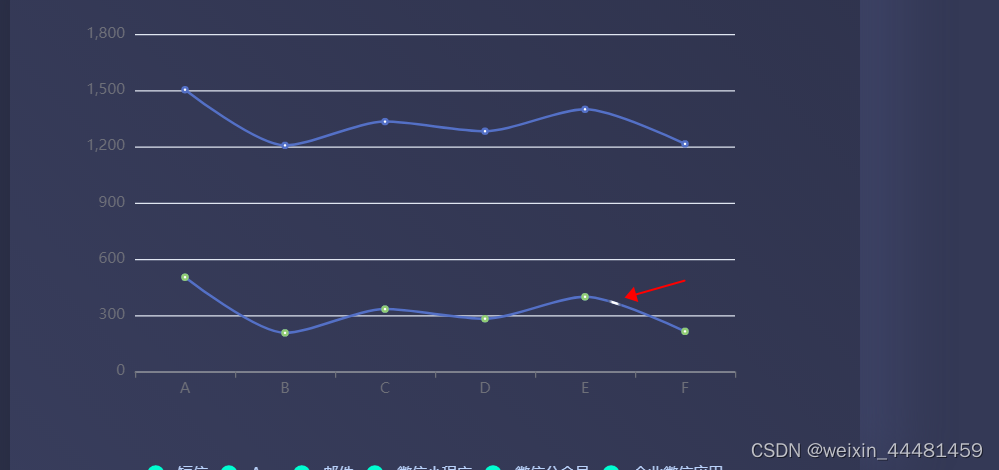
最近在做数据可视化的大屏,需要实现带有动效的echats图
效果如下:
这个小光点会一直在两条线上跑
实现思路,使用定时器画线,设置线的样式,代码如下
 const dom = document.getElementById("chart");
    const myChart = echarts.init(dom);

    let data = [
        [502.84, 205.97, 332.79, 281.55, 398.35, 214.02],
        [1502.84, 1205.97, 1332.79, 1281.55, 1398.35, 1214.02]
    ];
    let a = [{
        name: "注册总量",
        type: "line",
        smooth: 0.27,
        data: [502.84, 205.97, 332.79, 281.55, 398.35, 214.02],
        animation: false
    }, {
        name: "注册总量",
        type: "line",
        smooth: 0.27,
        data: [1502.84, 1205.97, 1332.79, 1281.55, 1398.35, 1214.02],
        animation: false
    }]
    let i = 1;
    let step = 0.01; //光点移动速度
    let dataIndex = 0;
    setInterval(() => {
        i++;
        let startPre = step * (i - 1);
        let start = step * i;
        let end = step * (i + 1);
        let endSuffix = step * (i + 2);
        if (endSuffix >= 1) {
            endSuffix = 1;
            i = 0;
        }
        let lineList = [];
        let lines = {
            type: "line",
            smooth: 0.27,
            data: data[dataIndex],
            animation: false,
            lineStyle: {
                width: 2, // 设置光点的长度
                color: {
                    type: "linear",
                    colorStops: [{
                        offset: startPre,
                        color: "transparent"
                    }, {
                        offset: start, //光点的颜色
                        color: "#fff"
                    }, {
                        offset: end, //光点的颜色
                        color: "#fff"
                    }, {
                        offset: endSuffix,
                        color: "transparent"
                    }],
                }
            }
        };


        if (endSuffix >= 1) {
            dataIndex++;
            if (dataIndex >= data.length) {
                dataIndex = 0;
            }
        }
        option = {
            xAxis: {
                type: "category",
                data: ["A", "B", "C", "D", "E", "F"]
            },
            yAxis: {
                type: "value"
            },
            legend: {
                show: true,
            },
            series: a.concat(lines)
        };
        myChart.setOption(option)
    }, 100);
记得引入echarts文件
