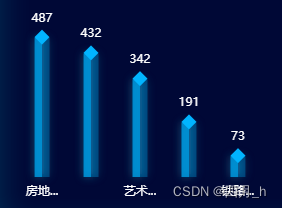
echarts柱状图模拟立体效果
// 3d柱状图
stereobar('ck_left_bottom_bar', rmhytop5n, rmhytop5v)
function stereobar(id, name, value) {
    var myChart = echarts.init(document.getElementById(id), null, { renderer: 'svg' });
    // 指定图表的配置项和数据
    var option = {
        tooltip: {
            trigger: 'axis',
            confine: true,
            axisPointer: { type: 'none' },
            textStyle: { fontSize: 12, fontWeight: 500 },
            formatter(params) {
                // 只展示柱子对应的内容,把顶部底部的 tooltip 过滤掉
                return params.reduce((pre, i) => {
                    if (i.componentSubType === 'bar') {
                        i.marker = i.marker.replace(/\[object Object\]/, i.color.colorStops[1].color);
                        i.value = `<span style="flex: 1; text-align: right; margin-left: 1rem;">${i.value}</span>`;
                        const current = `<div style="display: flex; align-items: center; height: 1.6rem;">${i.marker}${i.seriesName} ${i.value}</div>`;
                        return `${pre}${current}${i.axisValue}`;
                    }
                    return pre;
                }, '');
            },
        },
        grid: {
            left: '10%',
            right: '10%',
            bottom: '15%',
            top: '15%',
            containLabel: true
        },
        xAxis: {
            type: 'category',
            data: name,
            nameTextStyle: {
                color: "#fff"
            },
            axisLine: {
                show: false,
                lineStyle: {
                    color: "#fff",
                    opacity: 0.18
                }
            },
            axisTick: {
                show: false
            },
            axisLabel: {
                formatter: function(value, index) {
                    if (value.length > 3) {
                        return value.substr(0, 2) + '...'
                    } else {
                        return value
                    }
                }
            }
        },
        yAxis: {
            type: 'value',
            // name: "人数",
            nameTextStyle: {
                color: "#fff"
            },
            lineStyle: {
                show: false
            },
            axisLabel: {
                show: false,
                textStyle: {
                    color: '#fff',
                }
            },
            axisTick: {
                show: false
            },
            splitLine: {
                show: false,
                //  改变轴线颜色
                lineStyle: {
                    // 使用深浅的间隔色
                    color: "#41ABFF",
                    opacity: 0.18
                }
            },
            axisLine: {
                show: false
            }
        },
        series: [{
                name: '今日已反馈人数',
                type: 'bar',
                barWidth: 15,
                stack: '1',
                barCategoryGap: 12,
                data: value,
                color: '#fff',
                itemStyle: { // 柱体渐变色
                    color: {
                        type: 'linear',
                        x: 0,
                        x2: 1,
                        y: 0,
                        y2: 0,
                        colorStops: [
                            { offset: 0, color: 'rgba(1, 180, 255, 0.7)' },
                            { offset: 0.5, color: 'rgba(1, 180, 255, 0.7)' },
                            { offset: 0.5, color: 'rgba(1, 180, 255, 0.3)' },
                            { offset: 1, color: 'rgba(1, 180, 255, 0.3)' }
                        ]
                    },
                    shadowColor: 'rgba(37, 179, 208, 0.6)',
                    shadowBlur: 10
                },

            },
            {
                name: '今日已反馈人数',
                type: 'pictorialBar',
                symbolSize: [15, 15],
                symbol: 'diamond',
                // 这个属性很重要,直接决定了顶部跟柱子是否契合
                symbolOffset: [0, -8],
                z: 12,
                itemStyle: { color: 'rgba(1, 180, 255, 1)' },
                symbolPosition: 'end',
                data: value,
                label: {
                    show: true,
                    position: 'top',
                    color: '#fff'
                },
            },

        ],
    }
    myChart.setOption(option);
    window.addEventListener('resize', function() {
        myChart.resize();
    });
};
以此记录
效果图如下:
