
一、添加title
 var option = {
        title: {
          text: '在线率',
          subtext: '88%',
          left: 'center',
          top: '32%',
          textStyle: {
            fontSize: 14,
            color: '#2BCAFF',
            align: 'center'
          },
          subtextStyle: {
            fontFamily: "微软雅黑",
            fontSize: 24,
            color: '#fff',
          }
        },
}
下图是 title配置:
<template>
<div id="echarts1"></div>
</template>
<script>
import * as echarts from 'echarts';
export default {
data() {
return {
echartList: [
{
name: '在线',
value: '88',
},
{
name: '离线',
value: '12',
}
],
};
},
mounted() {
this.initChart()
},
methods: {
initChart() {
const machart = echarts.init(document.getElementById("echarts1"));
//init初始化接口,返回ECharts实例,其中dom为图表所在节点
var option = {
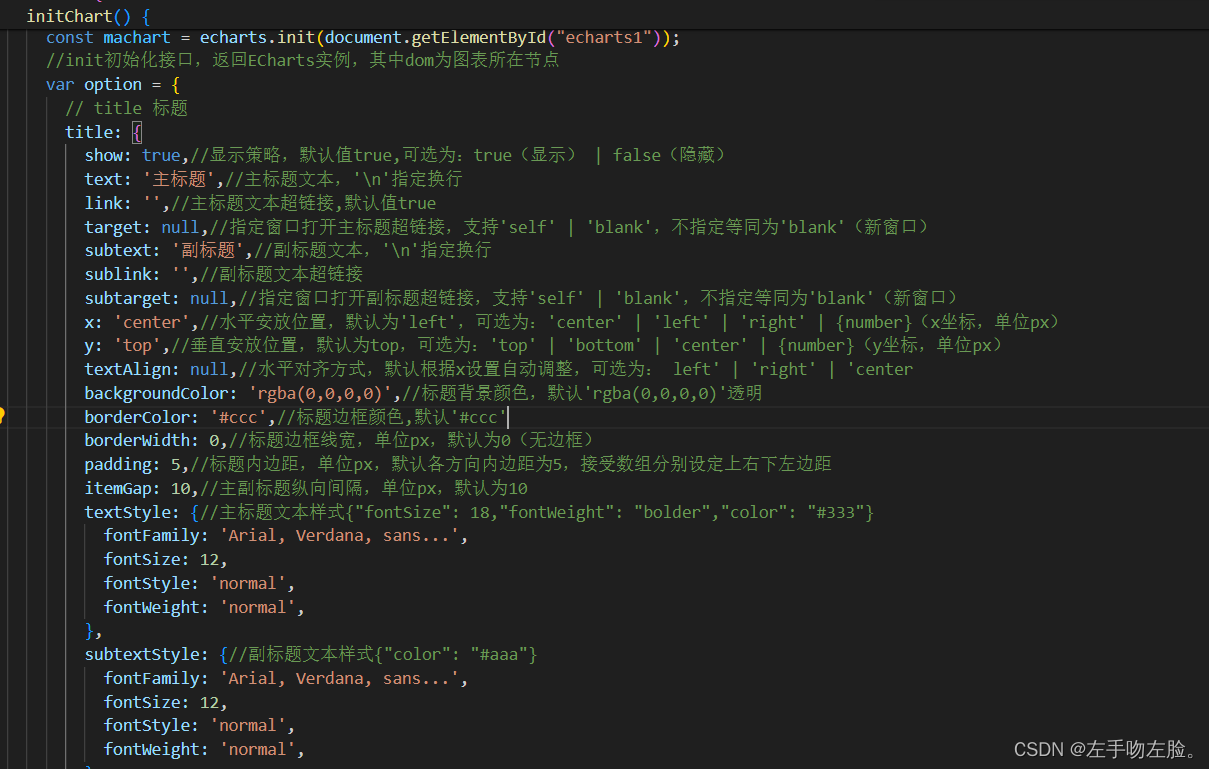
// title 标题
title: {
show: true,//显示策略,默认值true,可选为:true(显示) | false(隐藏)
text: '主标题',//主标题文本,'\n'指定换行
link: '',//主标题文本超链接,默认值true
target: null,//指定窗口打开主标题超链接,支持'self' | 'blank',不指定等同为'blank'(新窗口)
subtext: '副标题',//副标题文本,'\n'指定换行
sublink: '',//副标题文本超链接
subtarget: null,//指定窗口打开副标题超链接,支持'self' | 'blank',不指定等同为'blank'(新窗口)
x: 'center',//水平安放位置,默认为'left',可选为:'center' | 'left' | 'right' | {number}(x坐标,单位px)
y: 'top',//垂直安放位置,默认为top,可选为:'top' | 'bottom' | 'center' | {number}(y坐标,单位px)
textAlign: null,//水平对齐方式,默认根据x设置自动调整,可选为: left' | 'right' | 'center
backgroundColor: 'rgba(0,0,0,0)',//标题背景颜色,默认'rgba(0,0,0,0)'透明
borderColor: '#ccc',//标题边框颜色,默认'#ccc'
borderWidth: 0,//标题边框线宽,单位px,默认为0(无边框)
padding: 5,//标题内边距,单位px,默认各方向内边距为5,接受数组分别设定上右下左边距
itemGap: 10,//主副标题纵向间隔,单位px,默认为10
textStyle: {//主标题文本样式{"fontSize": 18,"fontWeight": "bolder","color": "#333"}
fontFamily: 'Arial, Verdana, sans...',
fontSize: 12,
fontStyle: 'normal',
fontWeight: 'normal',
},
subtextStyle: {//副标题文本样式{"color": "#aaa"}
fontFamily: 'Arial, Verdana, sans...',
fontSize: 12,
fontStyle: 'normal',
fontWeight: 'normal',
},
zlevel: 0,//一级层叠控制。默认0,每一个不同的zlevel将产生一个独立的canvas,相同zlevel的组件或图标将在同一个canvas上渲染。zlevel越高越靠顶层,canvas对象增多会消耗更多的内存和性能,并不建议设置过多的zlevel,大部分情况可以通过二级层叠控制z实现层叠控制。
z: 6,//二级层叠控制,默认6,同一个canvas(相同zlevel)上z越高约靠顶层。
},
//tooltip 提示框,鼠标悬浮交互时的信息提示
tooltip: {
trigger: 'item'
},
//legend图例,每个图表最多仅有一个图例
legend: {
orient: 'vertical',
left: 'left',
data: ['在线', '离线']
},
// 颜色
color: [
"#004BFF",
"#1FBBFF",
"#00A8D6",
"#7340FE",
"#F49D00",
"#EED742 ",
"#E8494D",
],
// 系列列表,每个系列通过 type 决定自己的图表类型
series: [
{
name: "",
type: "pie",
radius: [50, 60],
avoidLabelOverlap: false,
label: {
show: false,
position: 'center'
},
labelLine: {
show: false
},
data: this.echartList,
},
],
};
machart.setOption(option);// 为echarts对象加载数据
setTimeout(() => {
window.addEventListener("resize", resizeFn);
}, 100);
// 窗口大小改变时 自适应
const resizeFn = () => {
return machart.resize();
};
},
},
// watch: {
// this.echartList(val, newval) {
// },
// },
};
</script>
<style scoped>
#echarts1 {
width: 100%;
min-height: 21vh;
}
</style>
二、graphic
比如,如果是多行 ,就要用graphic
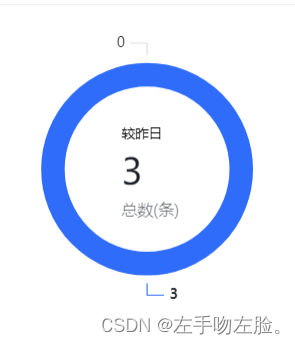
 graphic: [
    {
      type: "text",
      left: "30%",
      top: "35%",
      style: {
        text: '较昨日',
        textAlign: "center",
        fill: "较昨日",
        width: 30,
        height: 30,
        fontSize: 12,
      },
    },
      {
      type: "text",
      left: "30%",
      top: "44%",
      style: {
        text: res.count,
        textAlign: "center",
        fill: "#1D2129",
        width: 30,
        height: 30,
        fontSize: 32,
      },
    },
      {
      type: "text",
      left: "30%",
      top: "59%",
      style: {
        text: '总数(条)',
        textAlign: "center",
        fill: "rgba(29,33,41,0.6)",
        width: 30,
        height: 30,
        fontSize: 14,
      },
    }
  ],
完整代码
<template>
  <div id="echarts3"></div>
</template>

<script setup>
import * as echarts from "echarts";
const { proxy } = getCurrentInstance();
const props = defineProps({
  echartList: {
    default: [
      { temp: 47, outTemp: -13 },
      { temp: 44, outTemp: -11 },
      { temp: 41, outTemp: -9 },
      { temp: 38, outTemp: -7 },
      { temp: 35, outTemp: -5 },
      { temp: 32, outTemp: -3 },
      { temp: 29, outTemp: -1 },
      { temp: 26, outTemp: 1 },
      { temp: 23, outTemp: 3 },
      { temp: 20, outTemp: 5 },
      { temp: 17, outTemp: 7 },
      { temp: 14, outTemp: 9 },
    ],
  },
  counts: {
    default: {}
  }
});
const statistics = async () => {
  const res = await proxy.$get("/home/getDeviceCount", { });
  // countss.vale=res.data
  initChart(res.data)
}
const initChart = (res) => {
  let xdata = [];
  let ydata = [];
  props.echartList.forEach((item) => {
    xdata.push(item.outTemp);
    ydata.push(item.temp);
  });
  const machart = echarts.init(document.getElementById("echarts3"));

  var option = {
    // tooltip: {
    //   trigger: "item",
    // },
    graphic: [
    {
      type: "text",
      left: "30%",
      top: "35%",
      style: {
        text: '较昨日',
        textAlign: "center",
        fill: "较昨日",
        width: 30,
        height: 30,
        fontSize: 12,
      },
    },
      {
      type: "text",
      left: "30%",
      top: "44%",
      style: {
        text: res.count,
        textAlign: "center",
        fill: "#1D2129",
        width: 30,
        height: 30,
        fontSize: 32,
      },
    },
      {
      type: "text",
      left: "30%",
      top: "59%",
      style: {
        text: '总数(条)',
        textAlign: "center",
        fill: "rgba(29,33,41,0.6)",
        width: 30,
        height: 30,
        fontSize: 14,
      },
    }
  ],
    legend: {
      // bottom: "5%",
      right: "5%",
      top: 'center',
      orient: 'vertical',
    },
    color: ['#306cfa', '#dcdde1'],
    series: [
      {
        name: "Access From",
        type: "pie",
        radius: ["50%", "70%"], center: ['36%', '48%'],
        avoidLabelOverlap: false,

        label: {
          //展示文本设置
          normal: {
            formatter: '{c}',
            show: true, //展示
            position: "outside", // outside表示文本显示位置为外部,
          },

          emphasis: {
            //文本样式
            show: true, //展示
            textStyle: {
              //文本样式
              fontSize: "26",
              fontWeight: "600",
            },

          },

        },

        labelLine: {
          //引导线设置
          normal: {

            show: true, //引导线显示
            length: 14,
          },
        },
        emphasis: {
          label: {
            show: true,
            fontSize: 40,
            fontWeight: "bold",
          },

        },
        itemStyle: {
          borderWidth: 7,
          borderColor: "#fff",
        },

        // labelLine: {
        //   show: false
        // },
        data: [
          { value: res.yes, name: "已处理" },
          { value: res.not, name: "未处理" },
        ],
      },
    ],
  };
  machart.setOption(option);
};
setTimeout(() => {
  initChart();
}, 800);
defineExpose({
  initChart,
  statistics
});
</script>

<style scoped>
#echarts3 {
  width: 100%;
  height: 34vh;
}
</style>