本篇介绍一下使用 openlayers WebGL 切片图层样式修改(曝光度、对比度、饱和度、明暗度、颜色)
1 需求
- WebGL 切片图层样式修改(曝光度、对比度、饱和度、明暗度、颜色)
2 分析
- WebGLTile 的 style 属性修改
- ol/expr/expression 的简单使用官网解释
WebGLTile 的 style 有以下属性:
| 属性 | 说明 |
|---|---|
| variables | 样式变量对象,可使用 updateStyleVariables 方法动态修改 |
| color | 颜色(直接设置会覆盖切片内容) |
| brightness | 明暗度 |
| contrast | 对比度 |
| exposure | 曝光度 |
| saturation | 饱和度 |
| gamma | 伽马矫正 |
一般步骤:
- 定义样式变量对象
- 使用 ExpressionValue 为 style 各个属性赋值
- 改变样式变量对象中的属性并调用 updateStyleVariables 方法(传入最新的各个属性值)
3 实现
3.1 动态修改颜色及其他属性
<template>
  <div id="map" class="map"></div>
  <div class="toolbar">
    <div>
      <div>
        <span>颜色</span>
        <el-color-picker
          v-model="color"
          color-format="rgb"
          show-alpha
          size="small"
          @active-change="handleColorChange"
        />
      </div>
      <div>
        <span>伽马矫正</span>
        <el-slider v-model="gamma" :min="0" :step="0.1" @input="handleInput"></el-slider>
      </div>
    </div>
    <div>
      <div>
        <span>曝光度</span>
        <el-slider
          v-model="exposure"
          :min="-1"
          :max="1"
          :step="0.1"
          @input="handleInput"
        ></el-slider>
      </div>
      <div>
        <span>对比度</span>
        <el-slider
          v-model="contrast"
          :min="-1"
          :max="1"
          :step="0.1"
          @input="handleInput"
        ></el-slider>
      </div>
    </div>
    <div>
      <div>
        <span>饱和度</span>
        <el-slider
          v-model="saturation"
          :min="-1"
          :max="1"
          :step="0.1"
          @input="handleInput"
        ></el-slider>
      </div>
      <div>
        <span>明暗度</span>
        <el-slider
          v-model="brightness"
          :min="-1"
          :max="1"
          :step="0.1"
          @input="handleInput"
        ></el-slider>
      </div>
    </div>
  </div>
</template>

<script setup lang="ts">
import { Map, View } from 'ol';
import { asArray } from 'ol/color';
import { WebGLTile as WebGLTileLayer } from 'ol/layer';
import { get } from 'ol/proj';
import { XYZ } from 'ol/source';

const projection = get('EPSG:4326');
const key = '替换为天地图key';
const layerTypeMap = {
  vector: ['vec', 'cva'], // [矢量底图, 矢量注记]
  image: ['img', 'cia'], // [影像底图, 影像注记]
  terrain: ['ter', 'cta'] // [地形晕渲, 地形注记]
};
const color = ref('rgba(79, 31, 128,1)');
const exposure = ref(0);
const contrast = ref(0);
const saturation = ref(0);
const brightness = ref(0);
const gamma = ref(1);

const variables = computed(() => ({
  exposure: exposure.value,
  contrast: contrast.value,
  saturation: saturation.value,
  brightness: brightness.value,
  gamma: gamma.value,
  red: asArray(color.value)[0],
  green: asArray(color.value)[1],
  blue: asArray(color.value)[2],
  alpha: asArray(color.value)[3]
}));

let map = null;
const imageLayer = new WebGLTileLayer({
  style: {
    exposure: ['var', 'exposure'], //从样式变量对象中获取exposure
    contrast: ['var', 'contrast'], //从样式变量对象中获取contrast
    saturation: ['var', 'saturation'],
    brightness: ['var', 'brightness'],
    gamma: ['var', 'gamma'],
    color: ['color', ['var', 'red'], ['var', 'green'], ['var', 'blue'], ['var', 'alpha']],
    variables: variables.value
  },
  source: new XYZ({
    url: `https://t{0-7}.tianditu.gov.cn/DataServer?T=${layerTypeMap['image'][0]}_c&tk=${key}&x={x}&y={y}&l={z}`,
    projection
  })
});

onMounted(() => {
  initMap('image');
});

const initMap = (layerType = 'image') => {
  // c: 经纬度 w: 墨卡托
  const matrixSet = 'c';
  map = new Map({
    target: 'map',
    layers: [
      // 底图
      imageLayer,
      // 注记
      new WebGLTileLayer({
        source: new XYZ({
          url: `https://t{0-7}.tianditu.gov.cn/DataServer?T=${layerTypeMap[layerType][1]}_${matrixSet}&tk=${key}&x={x}&y={y}&l={z}`,
          projection
        })
      })
    ],
    view: new View({
      center: [116.406393, 39.909006],
      projection: projection,
      zoom: 5,
      maxZoom: 17,
      minZoom: 1
    })
  });
};

const handleInput = () => {
  imageLayer.updateStyleVariables(variables.value);
};

const handleColorChange = val => {
  if(val){
    color.value = val;
    handleInput();
  }

};
</script>
<style scoped lang="scss">
.map {
  width: 100%;
  height: 100%;
}
.toolbar {
  position: absolute;
  top: 20px;
  left: 100px;
  display: flex;
  flex-direction: column;
  justify-content: center;
  align-items: center;
  color: #fff;
  .el-slider {
    margin-right: 10px;
    margin-left: 10px;
  }
  div {
    width: 200px;
    height: 40px;
    display: flex;
    justify-content: center;
    align-items: center;
    span {
      width: 120px;
      margin-left:10px;
    }
  }
}
</style>
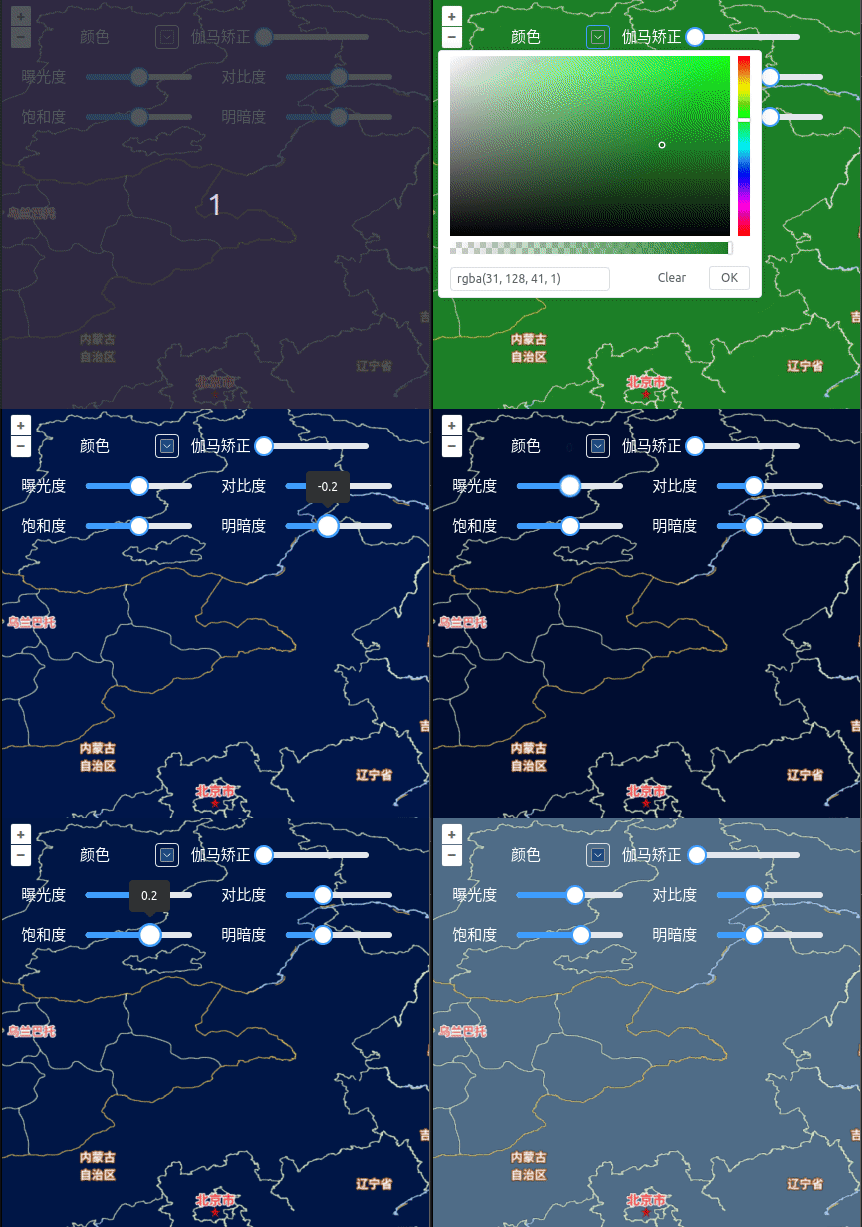
可以看到,卫星影像是被设置的颜色覆盖掉的
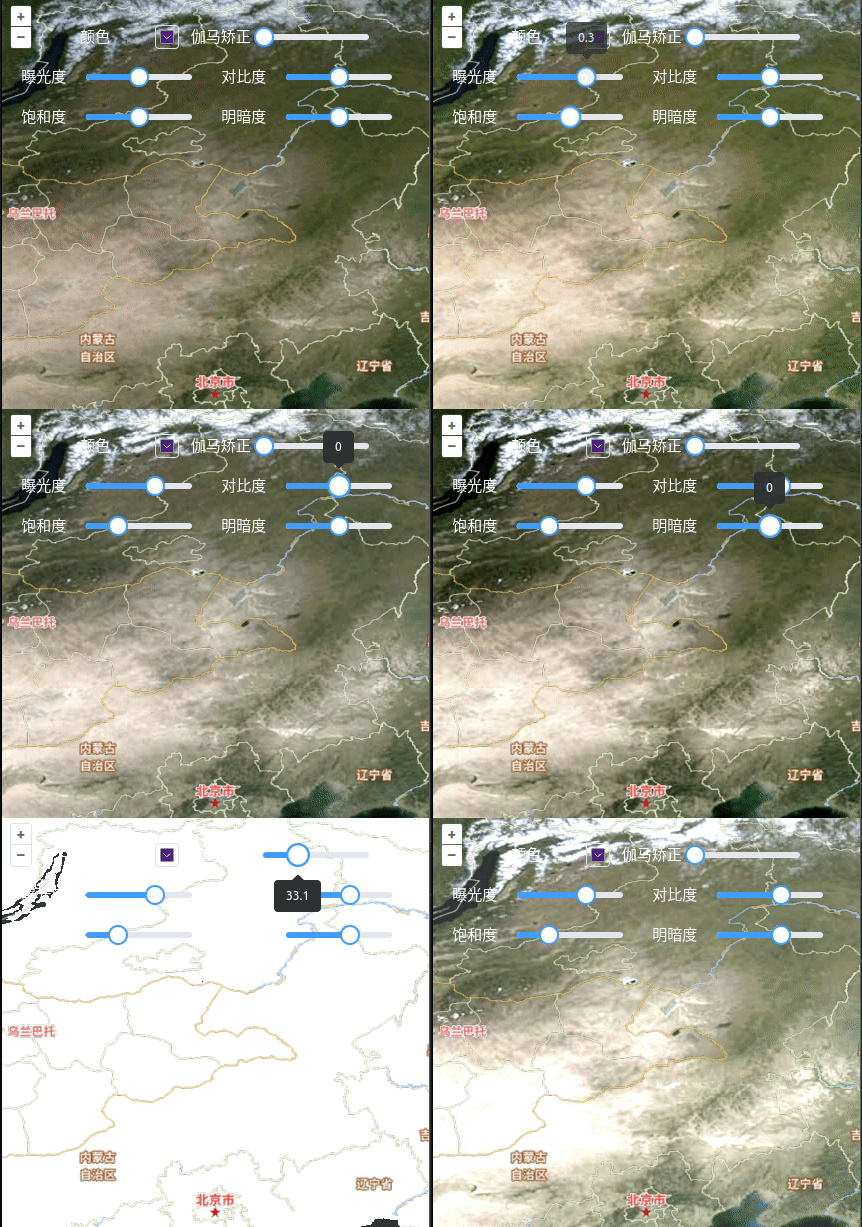
3.2 仅动态修改其他属性(显示卫星影像切片)
当取消颜色自定义时,也就是注释掉下面一行代码
color: ['color', ['var', 'red'], ['var', 'green'], ['var', 'blue'], ['var', 'alpha']],
3.3 动态修改颜色及其他属性(显示卫星影像切片)
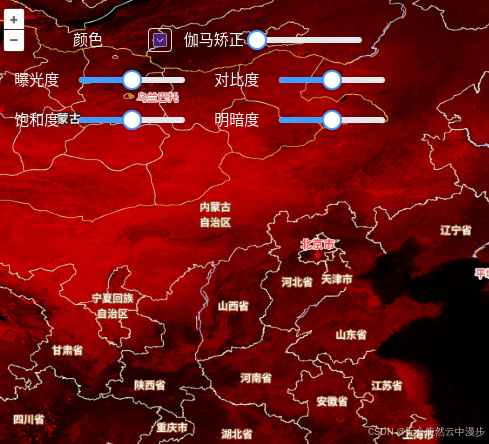
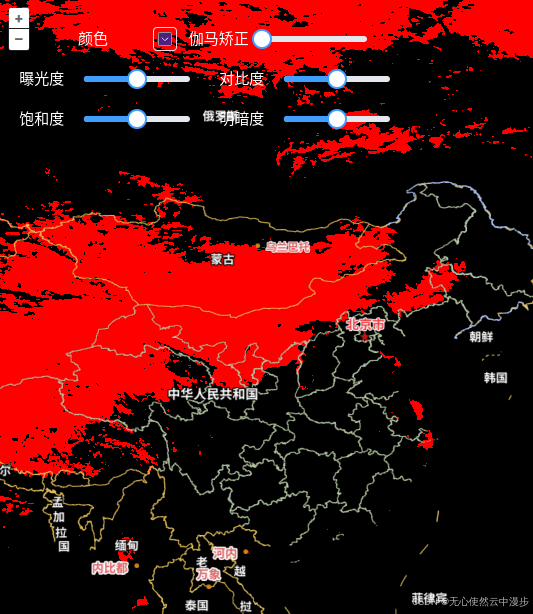
如果想显示出卫星影响切片,还要自定义颜色,有两种方法:
- 在WebGLTile的style的color属性上使用ExpressionValue
将style中的color修改如下,则只会选择出红色通道
 color: [
      'color',
      ['*',['band', 1], 255],
      0,
      0,
      1
    ],
将style中的color修改如下,则只会选择出红色通道,并且r>=128的r=255;r<128的r=0
 color: [
      'color',
      ['*', ['case', ['<', ['band', 1], 0.5], 0, ['>=', ['band', 1], 0.5], 1, 1], 255],
      0,
      0,
      1
    ],
-
在source上绑定tileLoadFunction(之前的文章介绍过)
关键代码:
const handleTileLoadFunction=(imageTile: any, src: string) => {
  // 该函数默认为imageTile.getImage().src = src;
  // 以下为自定义
  let img = new Image();
  img.setAttribute('crossOrigin', 'Anonymous');
  img.src = src;
  img.onload = () => {
    let canvas = document.createElement('canvas');
    let w = img.width;
    let h = img.height;
    canvas.width = w;
    canvas.height = h;
    let context = canvas.getContext('2d');
    // 使用过滤器整体改变像素
    context!.filter = 'hue-rotate(100deg)';
    context?.drawImage(img, 0, 0, w, h, 0, 0, w, h);
    const imageData = context!.getImageData(0, 0, canvas.width, canvas.height);
    const pixelData = imageData?.data ?? [];
    // 遍历每个切片上的像素进行自定义
		// pixelData 为数组 是[r,g,b,a]的循环结构
    for (let i = 0; i < pixelData.length; i++) {
      // pixelData[i * 4 + 0] r 通道;
      // pixelData[i * 4 + 1] g 通道;
      // pixelData[i * 4 + 2] b 通道;
      // pixelData[i * 4 + 3] a 通道;
    }
    context!.putImageData(imageData, 0, 0, 0, 0, canvas.width, canvas.height);
    imageTile.getImage().src = canvas.toDataURL('image/png');
  };

};


new XYZ({
    url: `https://t{0-7}.tianditu.gov.cn/DataServer?T=${layerTypeMap['image'][0]}_c&tk=${key}&x={x}&y={y}&l={z}`,
    projection,
    tileLoadFunction:handleTileLoadFunction
  })


