v-charts柱状图使用、环图监听点击事件及监听点击事件
v-charts中柱状图和环图的使用
v-charts的使用
安装
npm i v-charts echarts -S
引入柱状图、环图
main.js中引入
// 柱状图
import VeHistogram from 'v-charts/lib/histogram.common'
//饼图
import VeRing from 'v-charts/lib/ring.common'

Vue.component(VeHistogram.name, VeHistogram)
Vue.component(VeRing.name, VeRing)
柱状图的使用
<template>
    <div class="chartBox">
      <ve-histogram
        style="hieght:300px"
        :extend="chartExtend"
        :data="chartData"
        :settings="chartSettings"
        :tooltip="tooltip"
      />
    </div>
 </template>

<script>
import { getData} from '@/api/project'
export default {
  data() {
    this.chartSettings = {
      labelMap: {
        BankReceiveAmount: '计划对比',
        ActualAmout: '进度',
        InvoiceAmount: '已超期'
      },
      yAxisName: ['百分比']
    }
    this.chartExtend = {
      title: { text: '详情', left: 'center', style: 'fontSize:0.4rem' },
      // 图例设置  显示哪个颜色分别表示什么
      legend: {
        formatter: function(name) { // 用来格式化图例文本,支持字符串模板和回调函数两种形式。模板变量为图例名称 {name}
          console.log(name, '图例名称')
          if (name === '计划时间' || name === '实际时间') {
            // const isShow = false
            return
          }
          // var isShow = true
          return name
        },
        show: true,
        bottom: 'bottom'
      },
      // 设置  计划时间和实际时间为 白色 #FFFFFF
      color: ['#FFFFFF', '#FFFFFF', '#E4E4E4', '#00CC33', '#FF7350', '#FF3300'],
      tooltip: {
        trigger: 'axis',
        axisPointer: {
          type: 'shadow', // type:"cross"
          crossStyle: {
            color: '#999'
          }
        }
      },
      // 每个柱子
      series(v) {
        console.log('每个柱子', v)
        // 颜色
        const colors = ['#E4E4E4', '#00CC33', '#FF7350', '#FF3300', '#FFFFFF', '#FFFFFF']
        // 设置柱子的样式
        v.forEach(i => {
          console.log('每个柱子里面的数据', i)
          // i.barWidth = 20
          // i.itemStyle = {
          //   color: colors[v.indexOf(i)],
          //   borderWidth: 0
          // }
          if (i.name === '计划时间' || i.name === '实际时间') {
            i.barWidth = 0
          } else {
            i.barWidth = 15
            i.itemStyle = {
              color: colors[v.indexOf(i)],
              borderWidth: 0
            }
          }
        })
        return v
      }
    }
    // 提示框内容
    this.tooltip = {
      trigger: 'axis',
      position: function(point, params, dom, rect, size) {
        // 鼠标坐标和提示框位置的参考坐标系是:以外层div的左上角那一点为原点,x轴向右,y轴向下
        // 提示框位置
        var x = 0 // x坐标位置
        var y = 0 // y坐标位置
        // 当前鼠标位置
        var pointX = point[0]
        var pointY = point[1]
        // 外层div大小
        // var viewWidth = size.viewSize[0];
        // var viewHeight = size.viewSize[1];
        // 提示框大小
        var boxWidth = size.contentSize[0]
        var boxHeight = size.contentSize[1]
        // boxWidth > pointX 说明鼠标左边放不下提示框
        if (boxWidth > pointX) {
          x = 5
        } else { // 左边放的下
          x = pointX - boxWidth
        }
        // boxHeight > pointY 说明鼠标上边放不下提示框
        if (boxHeight > pointY) {
          y = 5
        } else { // 上边放得下
          y = pointY - boxHeight
        }
        return [x, y]
      },
      formatter: function(params, ticket, callback) {
        console.log(params, ticket, 'params数据')
        let htmlStr = ''
        for (let i = 0; i < params.length; i++) {
          const param = params[i]
          const xName = param.name// x轴的名称
          const seriesName = param.seriesName// 图例名称
          const value = param.value// y轴值
          const color = param.color// 图例颜色
          if (i === 0) {
            htmlStr += xName + '<br/>'// x轴的名称
          }
          htmlStr += '<div>'
          // 文本颜色设置--2020-07-23(需要设置,请解注释下面一行)
          // htmlStr += '<span style="color:'+color+'">';
          // 圆点后面显示的文本
          if (seriesName === '计划时间' || seriesName === '实际时间') {
            htmlStr += seriesName + ':' + value
          } else {
            // 为了保证和原来的效果一样,这里自己实现了一个点的效果
            htmlStr += '<span style="margin-right:5px;display:inline-block;width:10px;height:10px;border-radius:5px;background-color:' + color + ';"></span>'
            htmlStr += seriesName + ':' + value + '%'
          }
          // 文本颜色设置--2020-07-23(需要设置,请解注释下面一行)
          // htmlStr += '</span>';
          htmlStr += '</div>'
        }
        return htmlStr
      }
    }
    return {
      deviceName: '', // 设备名称
      chartData: {
        columns: ['阶段', '计划对比', '实际完成进度', '已超期', '计划时间', '实际时间'],
        rows: []
      },
      // 备注
      remarkData: []
    }
  },
  beforeRouteEnter(to, from, next) {
    next(vm => {
      if (vm.$route.query.productionEntryId) {
        vm.deviceName = vm.$route.query.deviceName
        getProductionDeviceProcessInfo(vm.$route.query.productionEntryId).then(res => {
          console.log(res, '返回值')
          // vm.remarkData = res.overdue
          vm.remarkData = []
          // 数据
          const processData = res.content
          vm.chartData.rows = processData.map(item => {
            const temp = {
              '阶段': item.processName,
              '计划对比': 100,
              '进度': null,
              '已超期': null,
              '计划时间': item.expectedStartDate + '至' + item.expectedFinishDate,
              '实际时间': item.actualStartDate + '至' + item.actualFinishDate
            }
            // 计划天数
            const s1 = new Date(item.expectedStartDate.replace(/-/g, '/')) // 计划开始时间
            const f1 = new Date(item.expectedFinishDate.replace(/-/g, '/'))// 计划结束时间
            const time1 = f1.getTime() - s1.getTime() // 计划天数
            const day1 = parseInt(time1 / (1000 * 60 * 60 * 24))// 实际天数
            // 已完成
            if (item.status === 'FINISH') {
              // 实际天数
              // const s2 = new Date(item.actualStartDate.replace(/-/g, '/'))
              // const f2 = new Date(item.actualFinishDate.replace(/-/g, '/'))// 计划结束时间
              // const time2 = f2.getTime() - s2.getTime()
              // const day2 = parseInt(time2 / (1000 * 60 * 60 * 24))// 实际天数
              temp['实际完成进度'] = 100
              temp['已超期'] = 0
            }
            // 未完成
            if (item.status === 'NOT_FINISH') {
              // 实际天数
              const s2 = new Date(item.actualStartDate.replace(/-/g, '/'))
              const f2 = new Date()// 当前日期:2017-04-24
              const time2 = f2.getTime() - s2.getTime()
              const day2 = parseInt(time2 / (1000 * 60 * 60 * 24))// 实际天数
              temp['实际完成进度'] = (day2 / day1).toFixed(4) * 100
              temp['已超期'] = 0
            }
            // 超期
            if (item.actualFinishDate > item.expectedFinishDate) {
              // 实际天数
              const s2 = new Date(item.actualStartDate.replace(/-/g, '/'))
              const f2 = new Date(item.actualFinishDate.replace(/-/g, '/'))// 计划结束时间
              const time2 = f2.getTime() - s2.getTime()
              const day2 = parseInt(time2 / (1000 * 60 * 60 * 24))// 实际天数
              temp['实际完成进度'] = (day2 / day1).toFixed(4) * 100
              temp['已超期'] = ((day2 - day1) / day1).toFixed(4) * 100
            }
            return temp
          })
        })
      }
    })
  },
  methods: {
  }
}
</script>
环图的使用
事件监听
:events="chartEvents"
<template>
<!-- 环图数据部分 -->
<div class="chartBox">
<!-- 这一部分使用定位 定到 -->
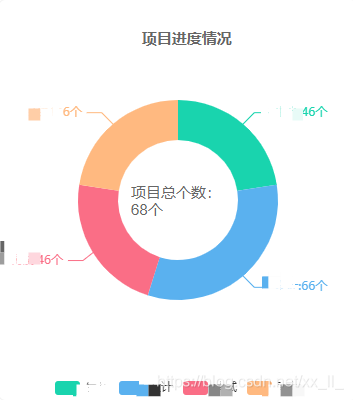
<div class="title">项目进度情况</div>
<div class="objCount">项目总个数:{{ count }}个</div>
<ve-ring
id="myChart"
style="hieght:300px"
:extend="chartExtend"
:data="chartData"
:settings="chartSettings"
:events="chartEvents"
/>
</div>
</template>
事件监听
<script>
import { getData } from '@/api/project'
export default {
  data() {
    // 设置环形图半径
    this.chartSettings = {
      radius: [60, 100],
      // offsetY: 300
      label: {
        formatter: params => {
          // this.clickChar = params.data.name
          // console.log(params.data.name, 'params数据')
          // if (params.dataIndex === 0) {
          return `${params.data.name}:${params.data.value}个`
          // } else {
          //   return `${params.data.name}:${params.data.value}个`
          // }
        }
      }
    } // 提示框内容
    // this.tooltip = {
    //   trigger: 'axis'
    // }
    this.chartExtend = {
      // title: { text: '项目进度情况', left: 'center', fontSize: '0.8rem', textStyle: {// 主标题文本样式{"fontSize": 18,"fontWeight": "bolder","color": "#333"}
      //   fontFamily: 'Arial, Verdana, sans...',
      //   fontSize: 18,
      //   fontStyle: 'normal',
      //   fontWeight: 'lighter'
      // }},
      legend: {
        show: true,
        bottom: 'bottom'
      }
    }
    // 环图点击事件
    const _this = this
    this.chartEvents = {
      click: function(e) {
        console.log(e.name, 'this.chartEvents')
        const arr = []
        arr.push(e.name)
        _this.selectPhaseKey = arr//改变条件值  重新去获取数据
        _this.contractData = []
        _this.page = 0
        _this.loading = false
        _this.finished = false
        _this.refreshing = false
        _this.getData()
      }
    }
    return {
      clickChar: '',
      // 加载模块需要的数据
      loading: false,
      finished: false,
      refreshing: false,
      size: 10,
      page: 0,
      count: null, // 总数据
      isSelect: true,
      showFilter: false,
      selectCompanyId: [],
      company: [],
      // 默认选中全部值
      selectPhaseKey: ['1', '2', '3', '4'],
      phase: [],
      // 查询选择的状态
      selectStatusKey: ['NOT_START', 'DOING', 'FINISH', 'PAUSE'],
      selectContent: [],
      chartData: {
        columns: [],
        rows: []
      },
      contractData: []
    }
  },
  created() {
    this.getData()
    this.$nextTick(() => {
    })
  },
  methods: {
    // 获取数据
    getData() {
      const temp = {
        page: this.page,
        size: this.size,
        corps: this.selectCompanyId,
        processStatus: this.selectStatusKey,
        processNames: this.selectPhaseKey
      }
      getData(temp).then(res => {
        this.contractData = [...this.contractData, ...res.projects]
        this.refreshing = false
        this.loading = false
      })
    },
  }
}
</script>