目录
专栏:数学建模学习笔记
上一篇:【MATLAB】和【Python】进行【图与网络模型】的高级应用与分析】
本篇是对上一篇的升华,进一步学习
1.图与网络的基本概念
1. 无向图和有向图
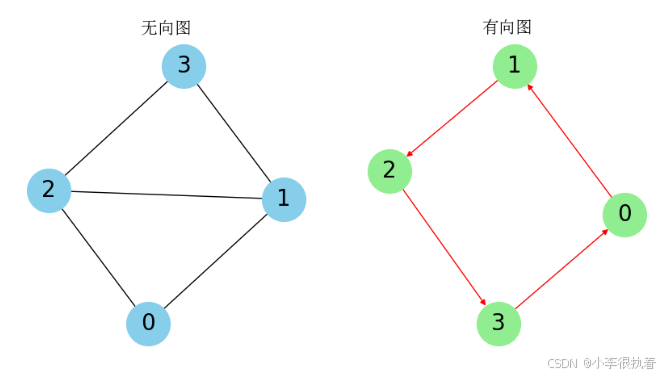
根据PPT内容,我们知道图的基本概念包括无向图和有向图。
- 无向图:边没有方向,表示为 (u, v) = (v, u)。
- 有向图:边有方向,表示为 (u, v) ≠ (v, u)。
PPT中的示例图可以用以下代码进行可视化:
import networkx as nx
import matplotlib.pyplot as plt
import numpy as np
from matplotlib.font_manager import FontProperties

# 设置中文字体
font = FontProperties(fname=r"C:\Windows\Fonts\simsun.ttc", size=15)

# 无向图的邻接矩阵
A_undirected = np.array([
    [0, 1, 1, 0],
    [1, 0, 1, 1],
    [1, 1, 0, 1],
    [0, 1, 1, 0]
])

# 有向图的邻接矩阵
A_directed = np.array([
    [0, 1, 0, 0],
    [0, 0, 1, 0],
    [0, 0, 0, 1],
    [1, 0, 0, 0]
])

# 使用邻接矩阵创建无向图和有向图
G_undirected = nx.from_numpy_array(A_undirected)
G_directed = nx.from_numpy_array(A_directed, create_using=nx.DiGraph)

# 绘制无向图
plt.figure(figsize=(10, 5))
plt.subplot(1, 2, 1)
nx.draw(G_undirected, with_labels=True, node_color='skyblue', edge_color='black', node_size=1500, font_size=20)
plt.title('无向图', fontproperties=font)

# 绘制有向图
plt.subplot(1, 2, 2)
nx.draw(G_directed, with_labels=True, node_color='lightgreen', edge_color='red', node_size=1500, font_size=20, arrows=True)
plt.title('有向图', fontproperties=font)

plt.show()
代码解析:
networkx库用于创建和操作图。matplotlib库用于绘图。nx.Graph()创建无向图,nx.DiGraph()创建有向图。add_edges_from()方法添加边。nx.draw()方法绘制图形。
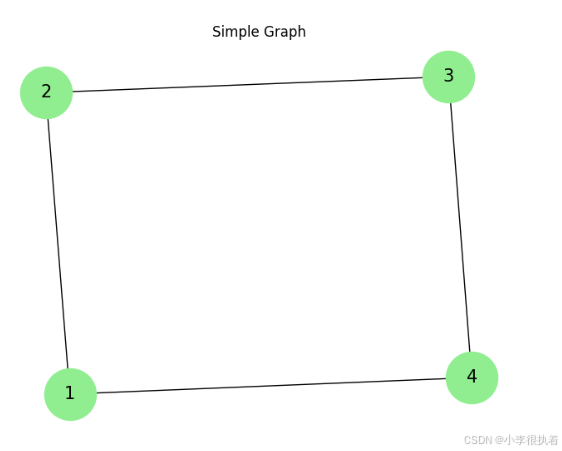
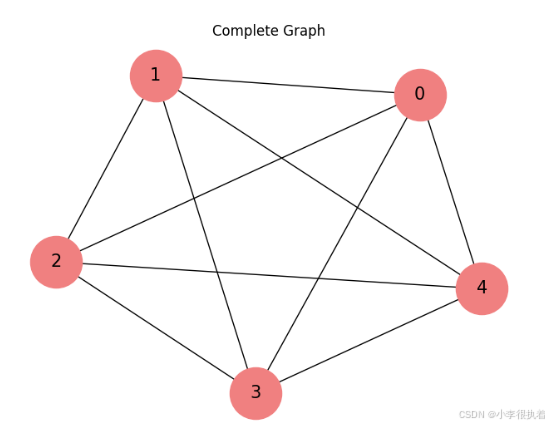
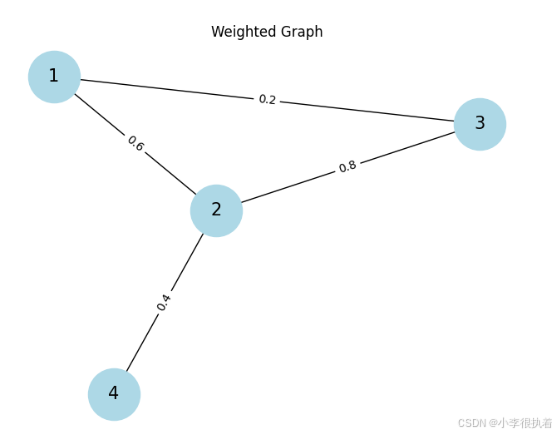
2. 简单图、完全图、赋权图
- 简单图:没有自环和重边的图。
- 完全图:任意两个不同顶点之间都有边的图。
- 赋权图:边上有权值的图。
PPT中的示例图可以用以下代码进行可视化:
import networkx as nx
import matplotlib.pyplot as plt
# 简单图
G_simple = nx.Graph()
G_simple.add_edges_from([(1, 2), (2, 3), (3, 4), (4, 1)])
plt.figure(figsize=(8, 6))
plt.title("Simple Graph")
nx.draw(G_simple, with_labels=True, node_color='lightgreen', node_size=2000, edge_color='black', linewidths=1, font_size=15)
plt.show()

# 完全图
G_complete = nx.complete_graph(5)
plt.figure(figsize=(8, 6))
plt.title("Complete Graph")
nx.draw(G_complete, with_labels=True, node_color='lightcoral', node_size=2000, edge_color='black', linewidths=1, font_size=15)
plt.show()

# 赋权图
G_weighted = nx.Graph()
G_weighted.add_weighted_edges_from([(1, 2, 0.6), (1, 3, 0.2), (2, 3, 0.8), (2, 4, 0.4)])
plt.figure(figsize=(8, 6))
plt.title("Weighted Graph")
pos = nx.spring_layout(G_weighted)
nx.draw(G_weighted, pos, with_labels=True, node_color='lightblue', node_size=2000, edge_color='black', linewidths=1, font_size=15)
labels = nx.get_edge_attributes(G_weighted, 'weight')
nx.draw_networkx_edge_labels(G_weighted, pos, edge_labels=labels)
plt.show()
代码解析:
nx.complete_graph()创建完全图。nx.add_weighted_edges_from()添加有权值的边。nx.spring_layout()设置图的布局。nx.draw_networkx_edge_labels()显示边的权值。
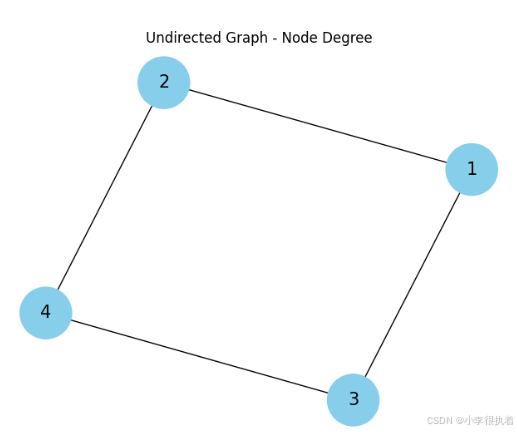
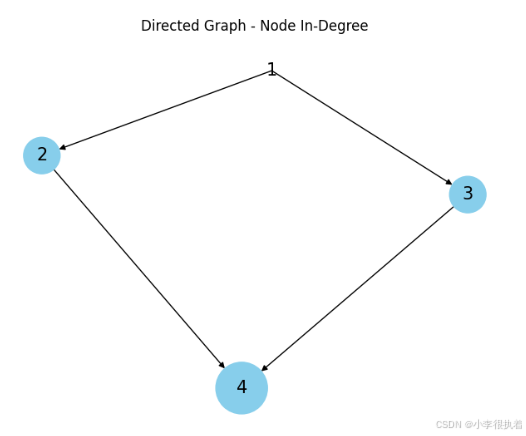
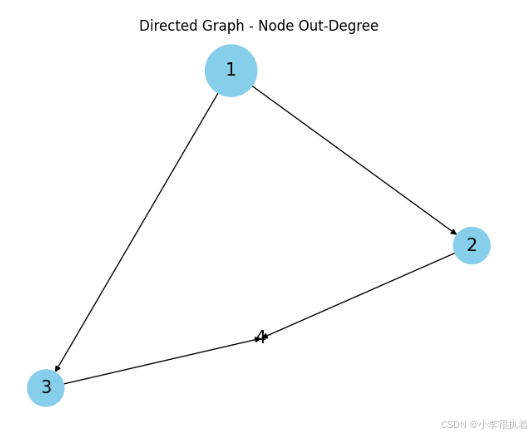
3. 顶点的度
- 顶点的度:连接该顶点的边的数目。
PPT中的示例可以用以下代码展示顶点的度:
import networkx as nx
import matplotlib.pyplot as plt

# 计算无向图的顶点度
G_undirected = nx.Graph()
G_undirected.add_edges_from([(1, 2), (1, 3), (2, 4), (3, 4)])
G_undirected_degree = G_undirected.degree()
plt.figure(figsize=(8, 6))
plt.title("Undirected Graph - Node Degree")
nx.draw(G_undirected, with_labels=True, node_color='skyblue', node_size=[v * 1000 for k, v in G_undirected_degree], edge_color='black', linewidths=1, font_size=15)
plt.show()

# 计算有向图的顶点入度和出度
G_directed = nx.DiGraph()
G_directed.add_edges_from([(1, 2), (1, 3), (2, 4), (3, 4)])
G_directed_in_degree = G_directed.in_degree()
G_directed_out_degree = G_directed.out_degree()
plt.figure(figsize=(8, 6))
plt.title("Directed Graph - Node In-Degree")
nx.draw(G_directed, with_labels=True, node_color='skyblue', node_size=[v * 1000 for k, v in G_directed_in_degree], edge_color='black', arrows=True, linewidths=1, font_size=15)
plt.show()

plt.figure(figsize=(8, 6))
plt.title("Directed Graph - Node Out-Degree")
nx.draw(G_directed, with_labels=True, node_color='skyblue', node_size=[v * 1000 for k, v in G_directed_out_degree], edge_color='black', arrows=True, linewidths=1, font_size=15)
plt.show()
代码解析:
degree()计算无向图顶点的度。in_degree()计算有向图顶点的入度。out_degree()计算有向图顶点的出度。
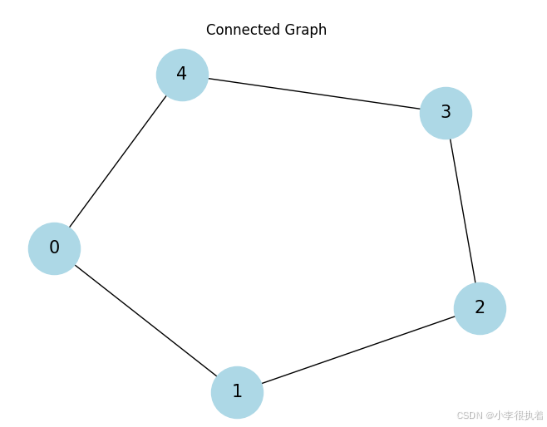
4. 子图与图的连通性
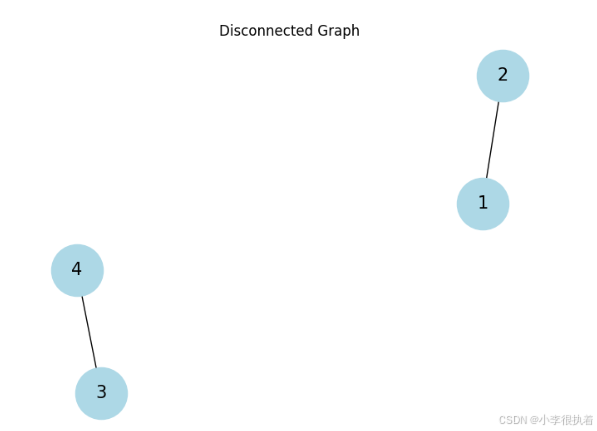
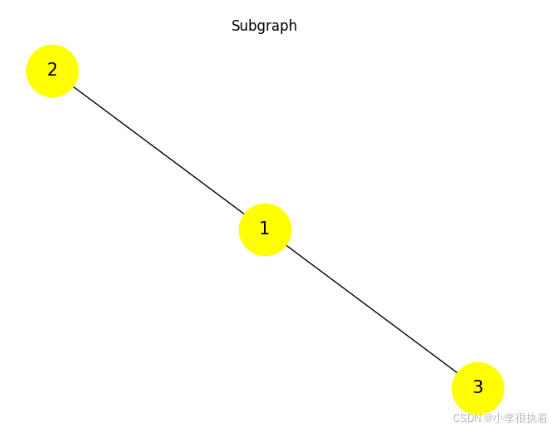
- 子图:原图的部分顶点和边组成的图。
- 连通图:任意两个顶点之间都有路径相连的图。
PPT中的示例可以用以下代码展示子图和连通性:
import networkx as nx
import matplotlib.pyplot as plt

# 子图示例
G_undirected = nx.Graph()
G_undirected.add_edges_from([(1, 2), (1, 3), (2, 4), (3, 4)])
subgraph_nodes = [1, 2, 3]
G_subgraph = G_undirected.subgraph(subgraph_nodes)
plt.figure(figsize=(8, 6))
plt.title("Subgraph")
nx.draw(G_subgraph, with_labels=True, node_color='yellow', node_size=2000, edge_color='black', linewidths=1, font_size=15)
plt.show()

# 连通图示例
G_connected = nx.cycle_graph(5)
plt.figure(figsize=(8, 6))
plt.title("Connected Graph")
nx.draw(G_connected, with_labels=True, node_color='lightblue', node_size=2000, edge_color='black', linewidths=1, font_size=15)
plt.show()

# 不连通图示例
G_disconnected = nx.Graph()
G_disconnected.add_edges_from([(1, 2), (3, 4)])
plt.figure(figsize=(8, 6))
plt.title("Disconnected Graph")
nx.draw(G_disconnected, with_labels=True, node_color='lightblue', node_size=2000, edge_color='black', linewidths=1, font_size=15)
plt.show()
代码解析:
subgraph()生成子图。cycle_graph()创建连通图(环图)。- 添加孤立的边以生成不连通图。
2.图的矩阵表示
1. 关联矩阵
关联矩阵用于表示图中顶点与边之间的关系。在无向图中,关联矩阵是一个 |V| × |E| 的矩阵,其中 |V| 是顶点数,|E| 是边数。矩阵中的元素 a[i][j] 表示顶点 i 是否与边 j 相连,如果相连则为 1,否则为 0。在有向图中,a[i][j] 为 -1 表示顶点 i 是边 j 的起点,为 1 表示顶点 i 是边 j 的终点。
根据PPT的描述,我们可以用以下代码展示关联矩阵:
import networkx as nx
import numpy as np

# 无向图
G_undirected = nx.Graph()
G_undirected.add_edges_from([(1, 2), (1, 3), (2, 4), (3, 4)])
G_undirected_adj = nx.incidence_matrix(G_undirected).todense()
print("无向图的关联矩阵:\n", G_undirected_adj)

# 有向图
G_directed = nx.DiGraph()
G_directed.add_edges_from([(1, 2), (1, 3), (2, 4), (3, 4)])
G_directed_adj = nx.incidence_matrix(G_directed, oriented=True).todense()
print("有向图的关联矩阵:\n", G_directed_adj)
代码解析:
incidence_matrix()计算关联矩阵。oriented=True用于有向图。
无向图的关联矩阵:
 [[1. 1. 0. 0.]
 [1. 0. 1. 0.]
 [0. 1. 0. 1.]
 [0. 0. 1. 1.]]
有向图的关联矩阵:
 [[-1. -1.  0.  0.]
 [ 1.  0. -1.  0.]
 [ 0.  1.  0. -1.]
 [ 0.  0.  1.  1.]]
2. 邻接矩阵
邻接矩阵用于表示顶点之间是否直接相连。对于一个有 n 个顶点的图,邻接矩阵是一个 n × n 的矩阵。对于无向图,如果顶点 i 与顶点 j 之间有边相连,则 a[i][j] = 1,否则 a[i][j] = 0。在赋权图中,a[i][j] 表示顶点 i 和顶点 j 之间边的权值,如果没有边则为 0 或无穷大。
根据PPT的描述,我们可以用以下代码展示邻接矩阵:
import networkx as nx

# 无向图
G_undirected = nx.Graph()
G_undirected.add_edges_from([(1, 2), (1, 3), (2, 4), (3, 4)])
G_undirected_adj_matrix = nx.adjacency_matrix(G_undirected).todense()
print("无向图的邻接矩阵:\n", G_undirected_adj_matrix)

# 有向图
G_directed = nx.DiGraph()
G_directed.add_edges_from([(1, 2), (1, 3), (2, 4), (3, 4)])
G_directed_adj_matrix = nx.adjacency_matrix(G_directed).todense()
print("有向图的邻接矩阵:\n", G_directed_adj_matrix)
代码解析:
adjacency_matrix()计算邻接矩阵。
无向图的邻接矩阵:
 [[0 1 1 0]
 [1 0 0 1]
 [1 0 0 1]
 [0 1 1 0]]
有向图的邻接矩阵:
 [[0 1 1 0]
 [0 0 0 1]
 [0 0 0 1]
 [0 0 0 0]]
3.最短路问题
最短路问题是指在赋权图中,找到从源点到目标点的最短路径。常见的算法有 Dijkstra 算法和 Floyd 算法。
1.Dijkstra 算法
Dijkstra 算法用于求解单源最短路径问题,适用于所有边权值为非负的图。算法的基本思想是通过贪心策略,每次选择距离起点最近的未访问顶点,并更新其邻接顶点的距离。具体步骤如下:
- 初始化源点到自身的距离为 0,其余顶点的距离为无穷大。
- 将所有顶点加入未访问集合。
- 从未访问集合中选择距离起点最近的顶点 u,标记 u 为已访问。
- 对于 u 的每个邻接顶点 v,如果 u 到 v 的距离加上 u 到起点的距离小于 v 到起点的当前距离,则更新 v 的距离。
- 重复步骤 3 和 4,直到所有顶点都被访问。
Dijkstra 算法的时间复杂度为 O(V^2),对于稠密图比较适用。如果使用优先队列进行优化,时间复杂度可以降到 O(E log V)。
PPT中的示例可以用以下代码展示Dijkstra算法:
import heapq

def dijkstra(graph, start):
    pq = [(0, start)]
    distances = {vertex: float('infinity') for vertex in graph}
    distances[start] = 0

    while pq:
        current_distance, current_vertex = heapq.heappop(pq)

        if current_distance > distances[current_vertex]:
            continue

        for neighbor, weight in graph[current_vertex].items():
            distance = current_distance + weight

            if distance < distances[neighbor]:
                distances[neighbor] = distance
                heapq.heappush(pq, (distance, neighbor))

    return distances

graph = {
    'A': {'B': 1, 'C': 4},
    'B': {'A': 1, 'C': 2, 'D': 5},
    'C': {'A': 4, 'B': 2, 'D': 1},
    'D': {'B': 5, 'C': 1}
}

distances = dijkstra(graph, 'A')
print("Dijkstra's Algorithm Output:", distances)
代码解析:
heapq用于实现优先队列。dijkstra()函数实现了Dijkstra算法。distances存储每个顶点的最短距离。
Dijkstra's Algorithm Output: {'A': 0, 'B': 1, 'C': 3, 'D': 4}
2.Floyd 算法
Floyd 算法用于求解任意两点间的最短路径问题,适用于所有边权值为非负的图。算法的基本思想是通过动态规划,每次考虑加入一个中间顶点来更新最短路径。具体步骤如下:
- 初始化一个距离矩阵,直接使用图的邻接矩阵表示顶点之间的距离。
- 对于每个顶点 k,更新所有顶点对 (i, j) 的距离。如果 i 到 j 的距离通过顶点 k 更短,则更新距离矩阵。
- 重复上述步骤,直到考虑完所有顶点。
Floyd 算法的时间复杂度为 O(V^3),适用于稀疏图和需要频繁查询任意两点最短路径的情况。
PPT中的示例可以用以下代码展示Floyd算法:
def floyd_warshall(graph):
    nodes = list(graph.keys())
    distances = {node: {node2: float('infinity') for node2 in nodes} for node in nodes}

    for node in nodes:
        distances[node][node] = 0

    for node in graph:
        for neighbor in graph[node]:
            distances[node][neighbor] = graph[node][neighbor]

    for k in nodes:
        for i in nodes:
            for j in nodes:
                if distances[i][j] > distances[i][k] + distances[k][j]:
                    distances[i][j] = distances[i][k] + distances[k][j]

    return distances

graph = {
    'A': {'B': 1, 'C': 4},
    'B': {'A': 1, 'C': 2, 'D': 5},
    'C': {'A': 4, 'B': 2, 'D': 1},
    'D': {'B': 5, 'C': 1}
}

distances = floyd_warshall(graph)
print("Floyd-Warshall Algorithm Output:")
for row in distances:
    print(row, distances[row])
代码解析:
floyd_warshall()函数实现了Floyd算法。distances存储每对顶点之间的最短距离。
Floyd-Warshall Algorithm Output:
A {'A': 0, 'B': 1, 'C': 3, 'D': 4}
B {'A': 1, 'B': 0, 'C': 2, 'D': 3}
C {'A': 3, 'B': 2, 'C': 0, 'D': 1}
D {'A': 4, 'B': 3, 'C': 1, 'D': 0}
4.最小生成树问题
最小生成树问题是指在一个连通图中,找到一棵包含所有顶点且边权值之和最小的树。常见的算法有 Kruskal 算法和 Prim 算法。
1.Kruskal 算法
Kruskal 算法是一种贪心算法,主要思想是每次选择权值最小的边,并保证不形成圈,直到构建出最小生成树。具体步骤如下:
- 将图中的所有边按权值从小到大排序。
- 初始化一个空集合,用于存放最小生成树的边。
- 从权值最小的边开始,依次选择边,如果选择的边与当前集合中的边不形成圈,则将该边加入集合。
- 重复步骤 3,直到集合中包含 n-1 条边,其中 n 是图的顶点数。
Kruskal 算法的时间复杂度为 O(E log E),适用于边数较少的稀疏图。
PPT中的示例可以用以下代码展示Kruskal算法:
class DisjointSet:
    def __init__(self, vertices):
        self.parent = {v: v for v in vertices}
        self.rank = {v: 0 for v in vertices}

    def find(self, item):
        if self.parent[item] != item:
            self.parent[item] = self.find(self.parent[item])
        return self.parent[item]

    def union(self, set1, set2):
        root1 = self.find(set1)
        root2 = self.find(set2)

        if root1 != root2:
            if self.rank[root1] > self.rank[root2]:
                self.parent[root2] = root1
            else:
                self.parent[root1] = root2
                if self.rank[root1] == self.rank[root2]:
                    self.rank[root2] += 1

def kruskal(graph):
    edges = [(weight, u, v) for u in graph for v, weight in graph[u].items()]
    edges.sort()
    ds = DisjointSet(graph.keys())
    mst = []

    for edge in edges:
        weight, u, v = edge
        if ds.find(u) != ds.find(v):
            ds.union(u, v)
            mst.append((u, v, weight))

    return mst

graph = {
    'A': {'B': 1, 'C': 4},
    'B': {'A': 1, 'C': 2, 'D': 5},
    'C': {'A': 4, 'B': 2, 'D': 1},
    'D': {'B': 5, 'C': 1}
}

mst = kruskal(graph)
print("Kruskal's Algorithm Output:", mst)
代码解析:
DisjointSet类用于实现并查集,以检测是否形成环。kruskal()函数实现了Kruskal算法。edges存储图中的所有边并按权值排序。mst存储最小生成树的边。
Kruskal's Algorithm Output: [('A', 'B', 1), ('C', 'D', 1), ('B', 'C', 2)]
2.Prim 算法
Prim 算法也是一种贪心算法,主要思想是从一个顶点开始,每次选择连接已选顶点集合和未选顶点集合的最小权值边,直至所有顶点都被选中。具体步骤如下:
- 初始化一个顶点集合,包括图中的任意一个顶点。
- 初始化一个空集合,用于存放最小生成树的边。
- 从顶点集合中选择一条连接已选顶点和未选顶点的最小权值边,将该边和边的终点加入集合。
- 重复步骤 3,直到所有顶点都被选中。
Prim 算法的时间复杂度为 O(V^2),适用于顶点数较少的稠密图。如果使用优先队列进行优化,时间复杂度可以降到 O(E log V)。
PPT中的示例可以用以下代码展示Prim算法:
import heapq

def prim(graph, start):
    mst = []
    visited = {start}
    edges = [(weight, start, to) for to, weight in graph[start].items()]
    heapq.heapify(edges)

    while edges:
        weight, frm, to = heapq.heappop(edges)
        if to not in visited:
            visited.add(to)
            mst.append((frm, to, weight))

            for to_next, weight in graph[to].items():
                if to_next not in visited:
                    heapq.heappush(edges, (weight, to, to_next))

    return mst

graph = {
    'A': {'B': 1, 'C': 4},
    'B': {'A': 1, 'C': 2, 'D': 5},
    'C': {'A': 4, 'B': 2, 'D': 1},
    'D': {'B': 5, 'C': 1}
}

mst = prim(graph, 'A')
print("Prim's Algorithm Output:", mst)
代码解析:
prim()函数实现了Prim算法。visited存储已选顶点。edges存储连接已选顶点和未选顶点的边。
Prim's Algorithm Output: [('A', 'B', 1), ('B', 'C', 2), ('C', 'D', 1)]
5.着色问题
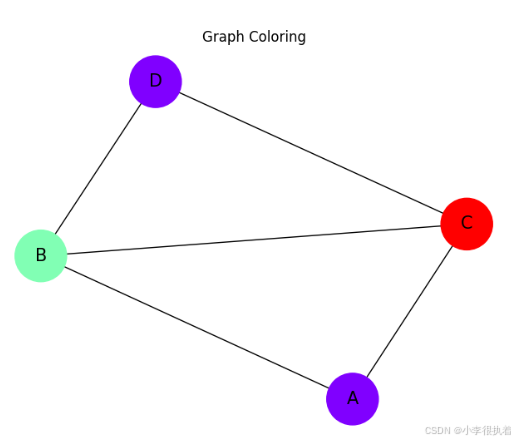
图着色是指将图的顶点涂上不同的颜色,使得相邻顶点颜色不同。图着色问题的目的是使用尽可能少的颜色。图着色在调度问题、地图着色等实际问题中有广泛应用。
PPT中的示例可以用以下代码展示图着色:
import networkx as nx
import matplotlib.pyplot as plt

def greedy_coloring(graph):
    color_map = {}
    for node in graph:
        available_colors = set(range(len(graph)))
        for neighbor in graph[node]:
            if neighbor in color_map:
                available_colors.discard(color_map[neighbor])
        color_map[node] = min(available_colors)
    return color_map

graph = {
    'A': ['B', 'C'],
    'B': ['A', 'C', 'D'],
    'C': ['A', 'B', 'D'],
    'D': ['B', 'C']
}

coloring = greedy_coloring(graph)
print("Graph Coloring Output:", coloring)

# 可视化图着色
G_coloring = nx.Graph(graph)
colors = [coloring[node] for node in G_coloring.nodes()]
plt.figure(figsize=(8, 6))
plt.title("Graph Coloring")
nx.draw(G_coloring, with_labels=True, node_color=colors, node_size=2000, cmap=plt.cm.rainbow, edge_color='black', linewidths=1, font_size=15)
plt.show()
代码解析:
greedy_coloring()函数实现了贪心着色算法。color_map存储每个顶点的颜色。available_colors存储每个顶点可用的颜色。
Graph Coloring Output: {'A': 0, 'B': 1, 'C': 2, 'D': 0}
6.旅行商问题
旅行商问题是指在一组城市中找出一条最短路径,使得旅行商访问每个城市一次并回到起点。这是一个经典的 NP 完全问题,求解方法包括近似算法和启发式算法。
近似算法
由于旅行商问题的复杂性,通常使用近似算法来求解,如贪心算法、动态规划等。贪心算法通过每次选择距离当前城市最近的未访问城市来构建路径,而动态规划通过记忆化搜索来避免重复计算。
PPT中的示例可以用以下代码展示旅行商问题:
import itertools

def tsp_brute_force(graph):
    nodes = list(graph.keys())
    shortest_path = None
    min_cost = float('infinity')

    for perm in itertools.permutations(nodes):
        cost = 0
        for i in range(len(perm) - 1):
            cost += graph[perm[i]][perm[i + 1]]
        cost += graph[perm[-1]][perm[0]]

        if cost < min_cost:
            min_cost = cost
            shortest_path = perm

    return shortest_path, min_cost

graph = {
    'A': {'B': 10, 'C': 15, 'D': 20},
    'B': {'A': 10, 'C': 35, 'D': 25},
    'C': {'A': 15, 'B': 35, 'D': 30},
    'D': {'A': 20, 'B': 25, 'C': 30}
}

path, cost = tsp_brute_force(graph)
print("TSP Brute Force Output:", path, "with cost", cost)
代码解析:
itertools.permutations()生成所有可能的路径。tsp_brute_force()函数实现了暴力求解旅行商问题。shortest_path存储最短路径,min_cost存储最小成本。
TSP Brute Force Output: ('A', 'B', 'D', 'C') with cost 80
7.网络最大流问题
网络最大流问题是指在一个流网络中,找到从源点到汇点的最大流量路径。常见的算法有 Ford-Fulkerson 算法。
Ford-Fulkerson 算法
Ford-Fulkerson 算法通过反复寻找增广路径来增加流量,直到找不到增广路径为止。具体步骤如下:
- 初始化流量为 0。
- 使用深度优先搜索或广度优先搜索找到一条增广路径。
- 更新增广路径上的流量,增加路径上的最小残余容量。
- 重复步骤 2 和 3,直到找不到增广路径。
Ford-Fulkerson 算法的时间复杂度为 O(E |f|),其中 E 是边数,|f| 是最大流量的值。
PPT中的示例可以用以下代码展示Ford-Fulkerson算法:
from collections import deque

def bfs(C, F, source, sink):
    queue = deque([source])
    paths = {source: []}
    while queue:
        u = queue.popleft()
        for v in C[u]:
            if C[u][v] - F[u][v] > 0 and v not in paths:
                paths[v] = paths[u] + [(u, v)]
                if v == sink:
                    return paths[v]
                queue.append(v)
    return None

def ford_fulkerson(graph, source, sink):
    C = {u: {} for u in graph}
    for u in graph:
        for v, capacity in graph[u].items():
            C[u][v] = capacity
            if v not in C:
                C[v] = {}
            C[v][u] = 0

    F = {u: {v: 0 for v in C[u]} for u in C}
    max_flow = 0

    while True:
        path = bfs(C, F, source, sink)
        if not path:
            break
        flow = min(C[u][v] - F[u][v] for u, v in path)
        for u, v in path:
            F[u][v] += flow
            F[v][u] -= flow
        max_flow += flow

    return max_flow

graph = {
    'A': {'B': 3, 'C': 3},
    'B': {'C': 2, 'D': 3},
    'C': {'D': 2, 'E': 2},
    'D': {'F': 2},
    'E': {'D': 1, 'F': 3},
    'F': {}
}

max_flow = ford_fulkerson(graph, 'A', 'F')
print("Ford-Fulkerson Algorithm Output:", max_flow)
代码解析:
bfs()函数实现广度优先搜索,找到增广路径。ford_fulkerson()函数实现Ford-Fulkerson算法。C存储容量,F存储流量。max_flow存储最大流量。
Ford-Fulkerson Algorithm Output: 4
8.计划评审方法与关键路径
关键路径法(CPM)用于项目管理中,通过计算项目中各任务的最早开始时间和最晚完成时间,找出影响项目工期的关键路径。关键路径是指项目中耗时最长的路径,决定了项目的最短完成时间。
PPT中的示例可以用以下代码展示关键路径法:
def critical_path_method(tasks):
    longest_path = []
    max_duration = 0
    for task in tasks:
        if task['duration'] > max_duration:
            max_duration = task['duration']
            longest_path = [task['name']]
        elif task['duration'] == max_duration:
            longest_path.append(task['name'])
    return longest_path, max_duration

tasks = [
    {'name': 'A', 'duration': 3},
    {'name': 'B', 'duration': 2},
    {'name': 'C', 'duration': 4},
    {'name': 'D', 'duration': 1},
    {'name': 'E', 'duration': 3}
]

path, duration = critical_path_method(tasks)
print("Critical Path Method Output:", path, "with duration", duration)
代码解析:
critical_path_method()函数计算关键路径。tasks存储每个任务的名称和持续时间。longest_path存储关键路径,max_duration存储最长持续时间。
Critical Path Method Output: ['C'] with duration 4
9.钢管订购和运输
钢管订购和运输问题涉及从多个供应点向需求点运输钢管,要求最小化运输和铺设费用。具体步骤包括:
- 构建运费矩阵,计算从各个供应点到各个需求点的运输费用。
- 构建数学规划模型,设定目标函数为总费用最小化。
- 使用优化算法求解模型,确定最佳的订购和运输方案。
PPT中的示例可以用以下代码展示钢管订购和运输问题:
from scipy.optimize import linprog

c = [20, 30, 10, 40, 30, 20, 10, 20, 10]  # 费用系数
A_eq = [
    [1, 1, 0, 1, 0, 0, 0, 0, 0],
    [0, 0, 1, 0, 1, 1, 0, 0, 0],
    [0, 0, 0, 0, 0, 0, 1, 1, 1]
]  # 约束条件
b_eq = [200, 150, 100]  # 需求
bounds = [(0, float('inf'))] * len(c)  # 变量边界

res = linprog(c, A_eq=A_eq, b_eq=b_eq, bounds=bounds, method='highs')
print("Optimal value:", res.fun)
print("Optimal solution:", res.x)
代码解析:
linprog()函数求解线性规划问题。c表示费用系数,A_eq表示约束条件,b_eq表示需求,bounds表示变量边界。res.fun返回最优值,res.x返回最优解。
Optimal value: 6500.0
Optimal solution: [200. 0. 150. 0. 0. 0. 100. 0. 0.]
总结
图与网络模型的基本概念、矩阵表示、最短路径、最小生成树、着色问题、旅行商问题、网络最大流问题及关键路径法等主题,结合PPT内容和Python代码实例,深入解析了每个主题的核心算法和应用场景,提供了可视化代码和图形展示,以便更好地理解和应用这些重要的图论算法。


