CSV 文件:将数据组织为一系列以逗号分隔的值(comma-separated values,CSV)并写入文件。这样的文件就是 CSV 文件。
"USW13578333","SDAS AIRPORT, AK US","2025-01-01",,"29","30"
气象数据下载教程见:
https://blog.csdn.net/Lin_Coder_/article/details/146004907?spm=1001.2014.3001.5501
1、解析 CSV 文件头
from pathlib import Path
import csv


path = Path('weather_data/sdas_weather_07-2024_simple.csv')
lines = path.read_text().splitlines()
reader = csv.reader(lines)
header_row = next(reader)
print(header_row)
csv 模块包含在 Python 标准库中,可用于解析 CSV 文件中的数据行。把 splitlines() 纳入方法链式调用来获取一个包含文件中各行的列表。创建 reader对象,调用 csv.reader() 函数并将包含 CSV 文件中各行的列表传递给它。
以 reader 对象为参数时,函数 next() 返回文件中的下一行(从文件开头开始)。
输出结果:
['STATION', 'NAME', 'DATE', 'TAVG', 'TMAX', 'TMIN']
reader 对象处理文件中以逗号分隔的第一行数据,并将每项数据都作为一个元素存储在列表中。
2、打印文件头及其位置
## 将上述代码的print 替换为下边代码

for index, column_header in enumerate(header_row):
    print(index, column_header)
对列表调用 enumerate() 来获取每个元素的索引及其值。
3、获取数据并绘制图形
from pathlib import Path
import csv
import matplotlib.pyplot as plt
path = Path('weather_data/sdas_weather_07-2024_simple.csv')
lines = path.read_text().splitlines()
reader = csv.reader(lines)
header_row = next(reader)
# 最高温度
highs = []
for row in reader:
high = int(row[4])
highs.append(high)
print(highs)
print(plt.style.available)
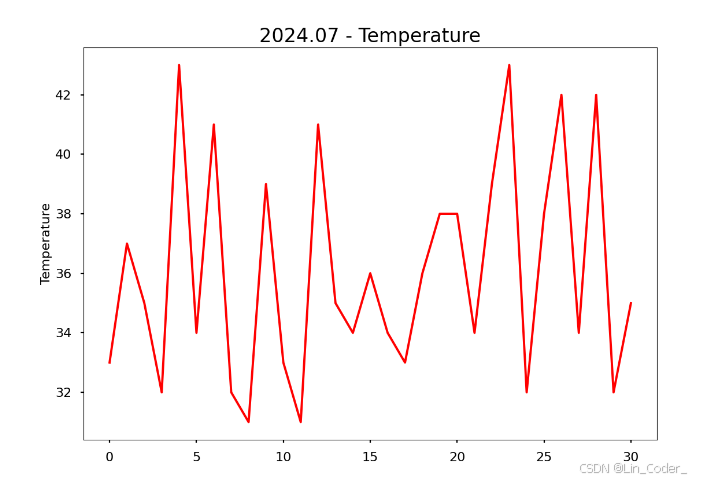
# 根据最高温度绘图
plt.style.use('seaborn-v0_8-poster')
fig, ax = plt.subplots()
ax.plot(highs, color='red')
# 设置绘图的格式
ax.set_title("2024.07 - Temperature", fontsize=24)
ax.set_xlabel('', fontsize=16)
ax.set_ylabel("Temperature", fontsize=16)
ax.tick_params(labelsize=16)
plt.show()
reader 对象从刚才中断的地方继续往下读取 CSV 文件,每次都自动返回当前所处位置的下一行。由于已经读取了文件头行,这个循环将从第二行开始。在文件中,这项数据是以字符串的格式存储的,因此在追加到 highs 的末尾前,要使用函数 int() 将其转换为数值格式。
输出结果:
4、datetime 模块
datetime 模块中设置日期和时间格式的参数
| 参数 | 含义 |
|---|---|
| %m | 用数表示的月份(01~12) |
| %d | 用数表示的月份中的一天(01~31) |
| %Y | 四位数的年份,如 2024 |
| %y | 两位数的年份,如 25 |
| %H | 24小时制的小时数(00~23) |
| %I | 12 小时制的小时数(01~12) |
| %M | 分钟数(00~59) |
| %A | 星期几,如 Monday |
| %B | 月份,如 January |
from pathlib import Path
import csv
import matplotlib.pyplot as plt
from datetime import datetime


path = Path('weather_data/sdas_weather_07-2024_simple.csv')
lines = path.read_text().splitlines()
reader = csv.reader(lines)
header_row = next(reader)

# 最高温度,和日期
highs, dates = [], []
for row in reader:
    current_date = datetime.strptime(row[2], '%Y/%m/%d')
    high = int(row[4])
    dates.append(current_date)
    highs.append(high)

print(highs)
print(plt.style.available)
# 根据最高温度绘图
plt.style.use('seaborn-v0_8-poster')
fig, ax = plt.subplots()
ax.plot(dates, highs, color='red')
# 设置绘图的格式
ax.set_title("2024.07 - Temperature", fontsize=24)
ax.set_xlabel('', fontsize=16)
ax.set_ylabel("Temperature", fontsize=16)
fig.autofmt_xdate()
ax.tick_params(labelsize=16)
plt.show()
输出结果:

导入 datetime 模块中的 datetime 类,再调用 strptime() 方法,并将包含日期的字符串作为第一个实参。第二个实参告诉 Python 如何设置日期的格式。调用 fig.autofmt_xdate() 来绘制倾斜的日期标签。
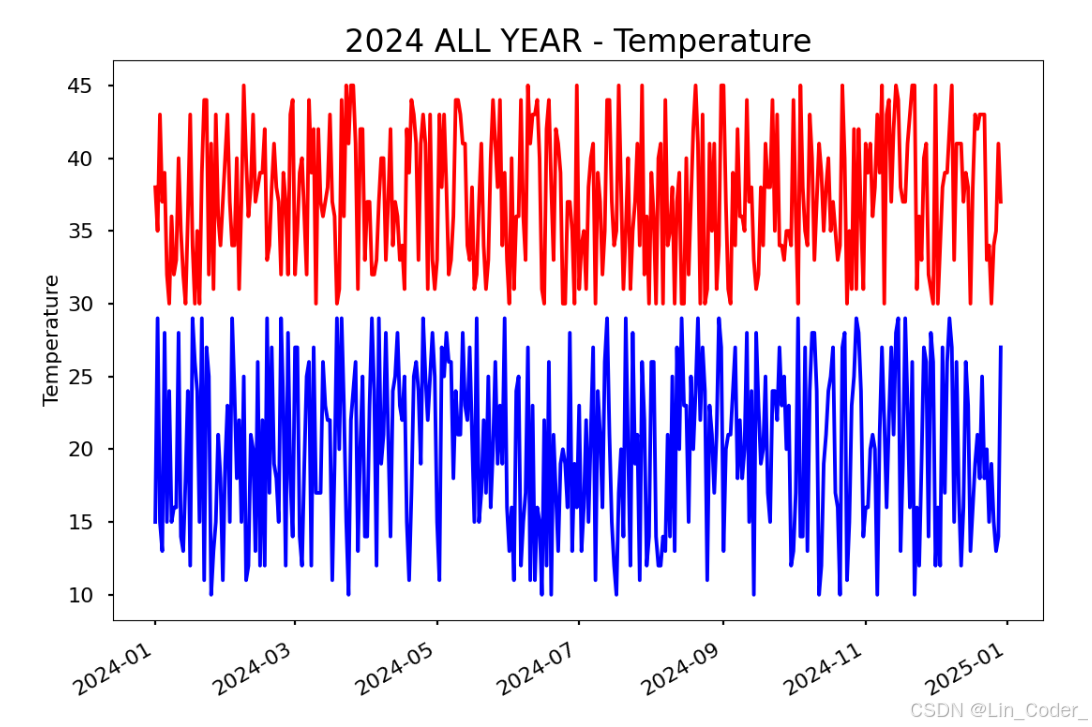
5、一整年最低和最高气温
from pathlib import Path
import csv
import matplotlib.pyplot as plt
from datetime import datetime


path = Path('weather_data/sdas_weather_2024_simple.csv')
lines = path.read_text().splitlines()
reader = csv.reader(lines)
header_row = next(reader)

# 最高温度,最低气温,和日期
highs, lows, dates = [], [], []
for row in reader:
    current_date = datetime.strptime(row[2], '%Y/%m/%d')
    high = int(row[4])
    low = int(row[5])
    dates.append(current_date)
    highs.append(high)
    lows.append(low)

print(highs)
print(plt.style.available)
# 根据最高温度绘图
plt.style.use('seaborn-v0_8-poster')
fig, ax = plt.subplots()
ax.plot(dates, highs, color='red')
ax.plot(dates, lows, color='blue')
# 设置绘图的格式
ax.set_title("2024 ALL YEAR - Temperature", fontsize=24)
ax.set_xlabel('', fontsize=16)
ax.set_ylabel("Temperature", fontsize=16)
fig.autofmt_xdate()
ax.tick_params(labelsize=16)
plt.show()
文件和程序目录如下:
输出结果:
当然,还有很多其他的图像格式设置,可以让图像更加美观,可以多尝试,比如给区域着色等等。