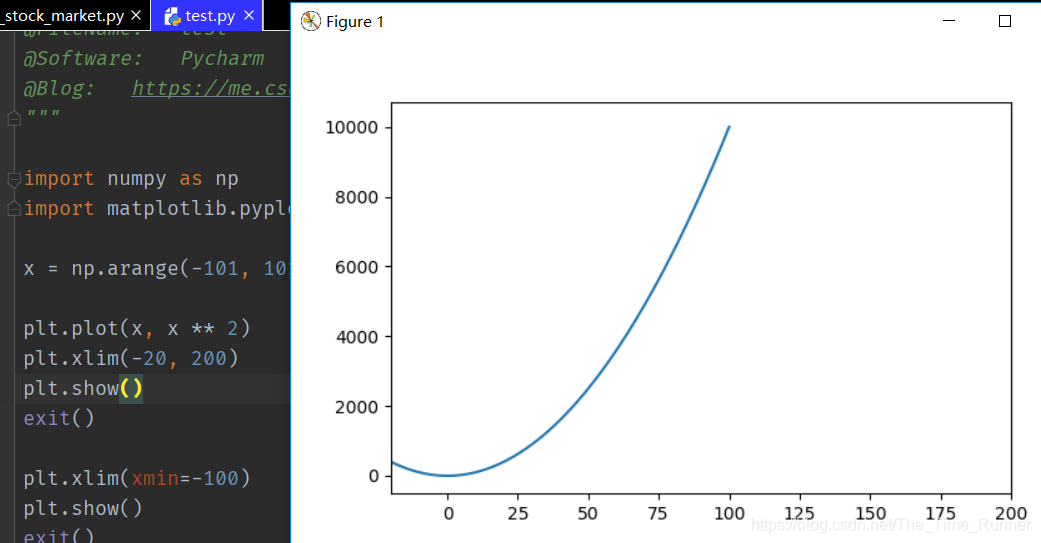
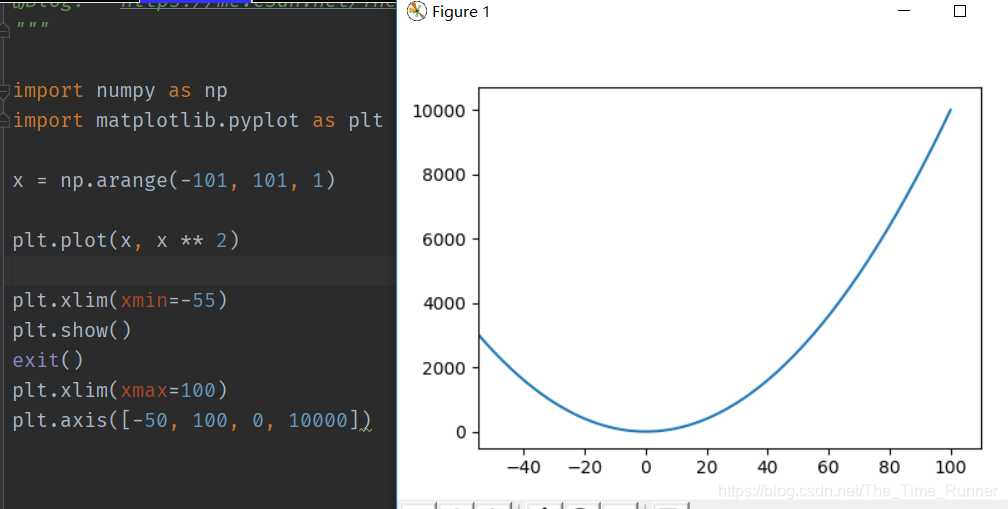
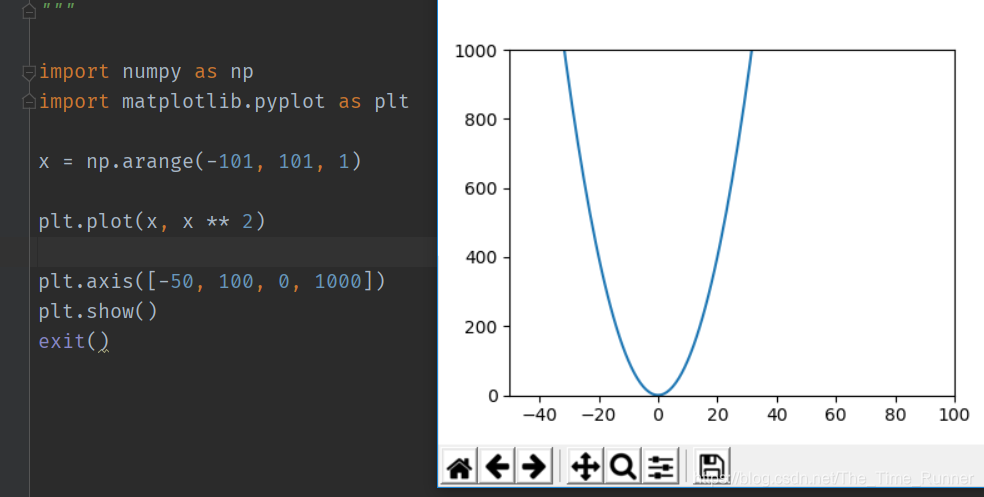
-
matplotlib.pyplot.xlim() 官方文档
matplotlib.pyplot.xlim(*args, **kwargs)
获取或者是设定x座标轴的范围,当前axes上的座标轴。
有两种参数输入方式
-
plt.xlim(num1, num2)
-
plt.xlim(xmin=num1,xmax=num2)
-
matplotlib.pyplot.ylim 官方文档
内容与x一样
-
matplotlib.pyplot.axis 官方文档
matplotlib.pyplot.axis(*v, **kwargs)
参数详解:
-
xmin, xmax, ymin, ymax : float, optional
-
option : str
Value Description ‘on’ Turn on axis lines and labels. ‘off’ Turn off axis lines and labels. ‘equal’ Set equal scaling (i.e., make circles circular) by changing axis limits. ‘scaled’ Set equal scaling (i.e., make circles circular) by changing dimensions of the plot box. ‘tight’ Set limits just large enough to show all data. ‘auto’ Automatic scaling (fill plot box with data). ‘normal’ Same as ‘auto’; deprecated. ‘image’ ‘scaled’ with axis limits equal to data limits. ‘square’ Square plot; similar to ‘scaled’, but initially forcing xmax-xmin = ymax-ymin. -
emit : bool, optional, default True


