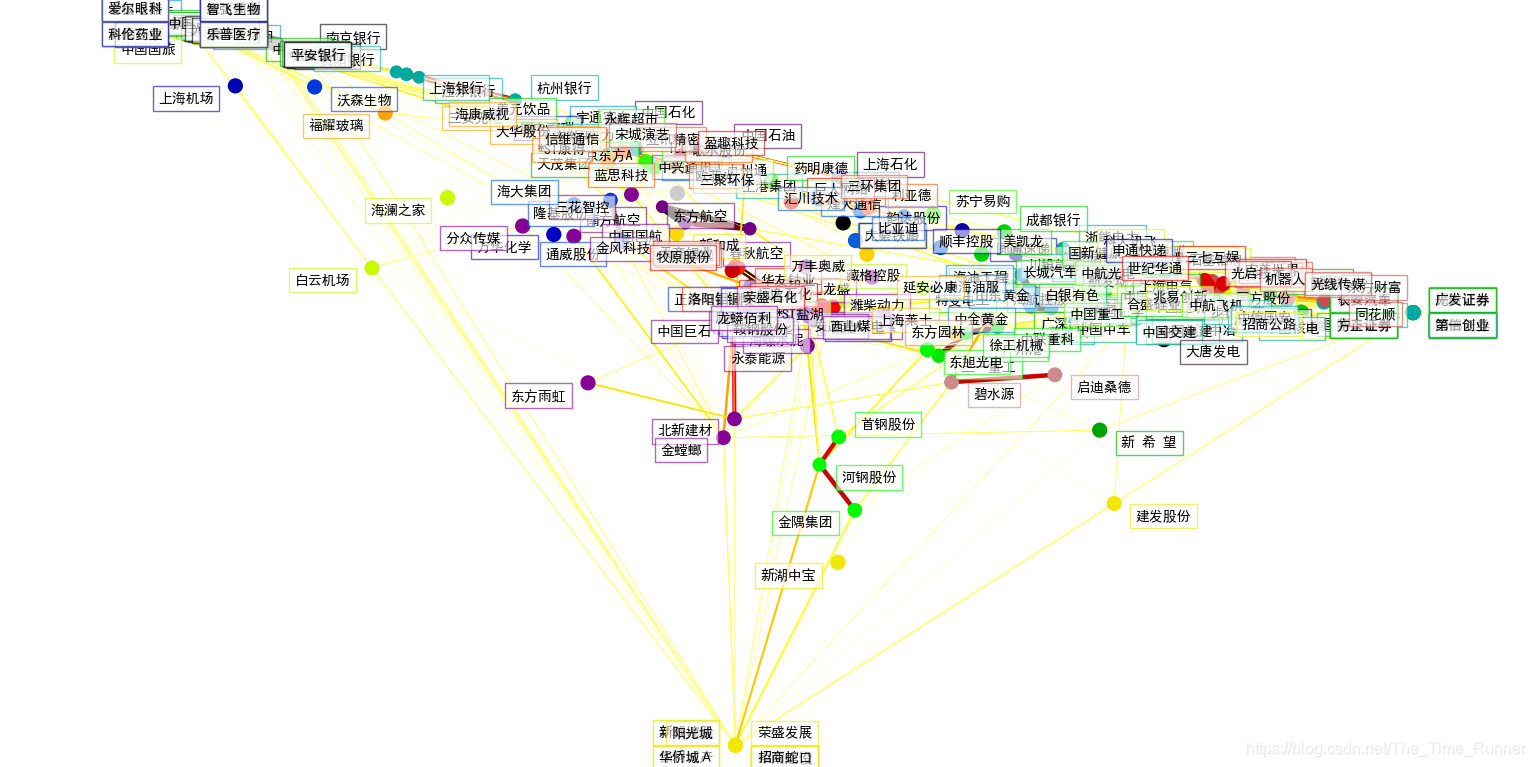
上篇文章:《可视化股票市场结构||沪深300股票聚类可视化》逐行代码解释了sklearn中的一个案例:可视化股票市场结构。案例中采用的数据是美股。这篇文章将其移植到A股市场,看看我们的沪深300股票市场结构如何。采用的分类及可视化手段与sklearn案例完全一样。
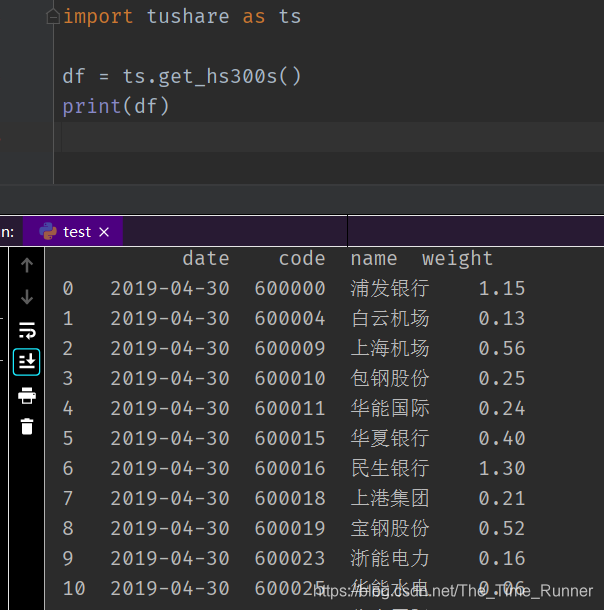
沪深300指数1是由上海和深圳证券市场中选取市值大、流动性好的300支A股作为样本编制而成的成份股指数。沪深300指数样本覆盖了沪深市场六成左右的市值,具有良好的市场代表性。由中证指数有限公司2编制负责。
可以通过tushare获取:
- 首先获取沪深300成分列表
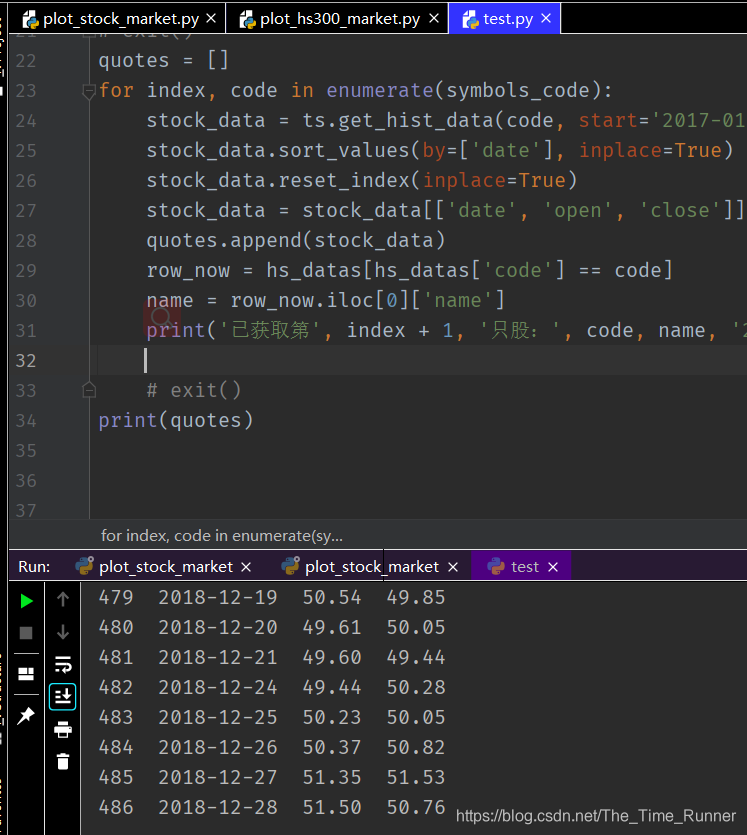
- 再获取个股历史纪录,只保留时间、开盘价、收盘价,截取2017年到2019年间数据
import numpy as np
import matplotlib.pyplot as plt
import tushare as ts
hs_datas = ts.get_hs300s()
symbols_name = np.array(hs_datas['name'])
symbols_code = np.array(hs_datas['code'])
quotes = []
for index, code in enumerate(symbols_code):
    stock_data = ts.get_hist_data(code, start='2017-01-01', end='2019-01-01')
    stock_data.sort_values(by=['date'], inplace=True)
    stock_data.reset_index(inplace=True)
    stock_data = stock_data[['date', 'open', 'close']]
    quotes.append(stock_data)
    row_now = hs_datas[hs_datas['code'] == code]
    name = row_now.iloc[0]['name']
    print('已获取第', index + 1, '只股:', code, name, '2017-01-01 到 2019-01-01的历史数据')
    # exit()
print(quotes)
- 数据整理,转为可为模型使用的数据
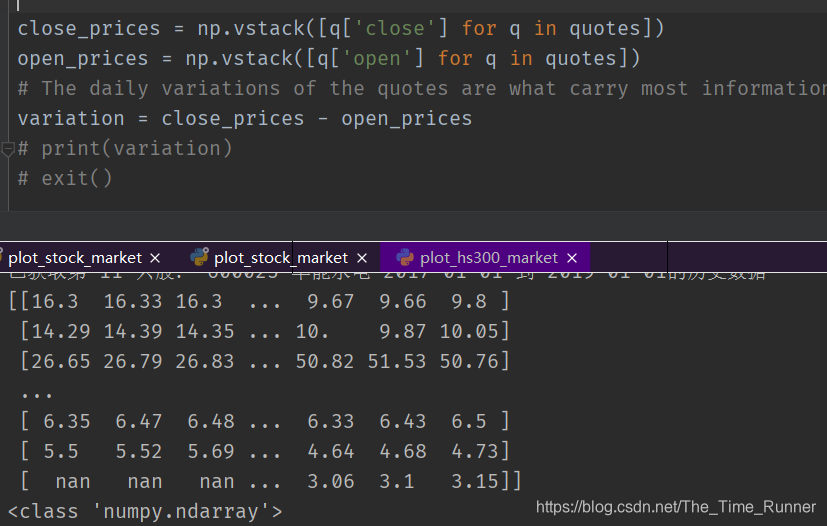
close_prices = np.vstack([q['close'] for q in quotes])
open_prices = np.vstack([q['open'] for q in quotes])
# 每日价格变换可能承载我们所需信息
variation = close_prices - open_prices
通过这三步操作,就完成了沪深300指数个股的历史记录。
上述第2部分的代码所得结果,在处理第3步时,会出现如下错误:(已解决)ValueError: all the input array dimensions except for the concatenation axis must match exactly。3上面给出了原因及解决方案,仔细研究应该时可以解决的,如果没搞懂,可以留言问我要完整代码。
采用稀疏逆协方差评估来寻找哪些报价之间存在有条件的关联。
edge_model = covariance.GraphicalLassoCV(cv=5)
X = variation.copy().T
X /= X.std(axis=0)
edge_model.fit(X)
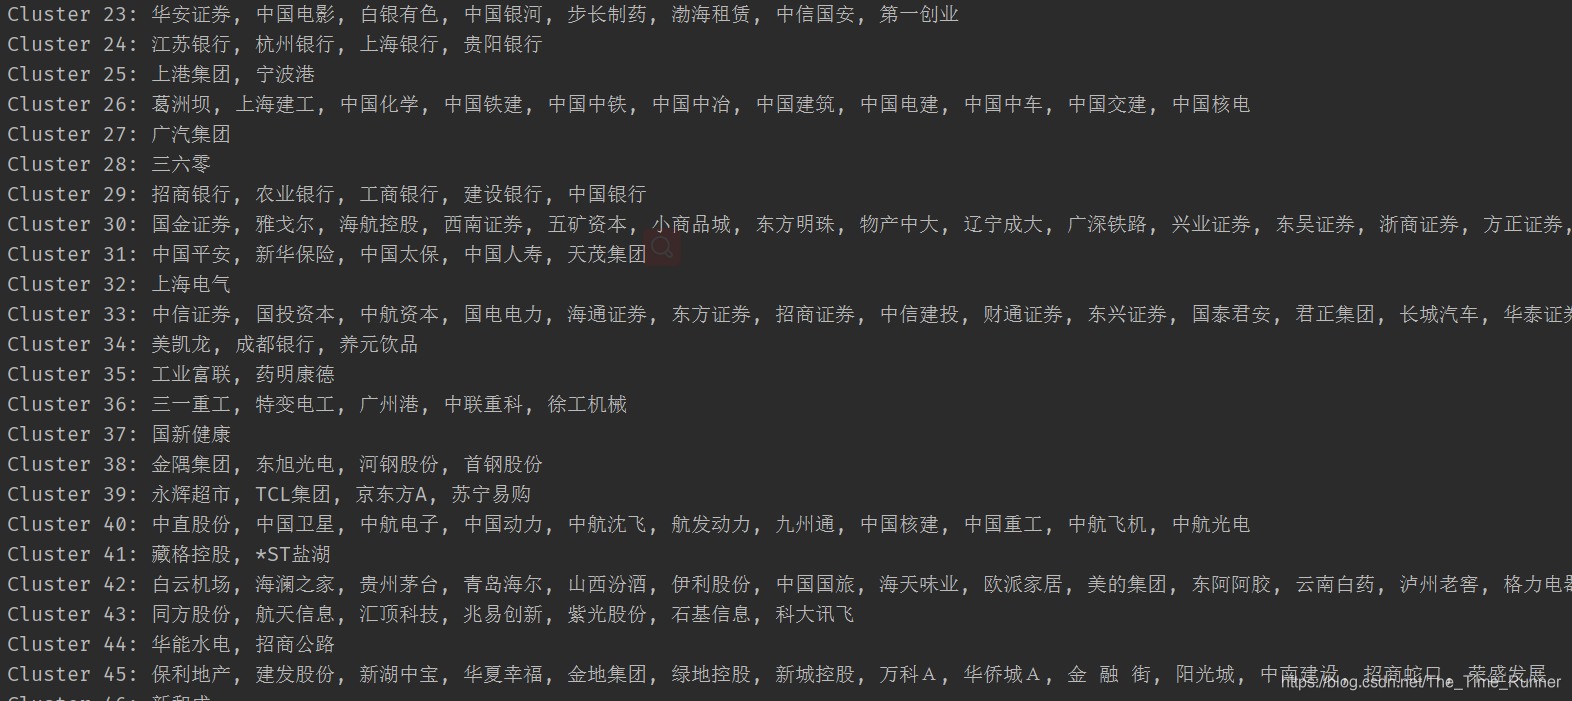
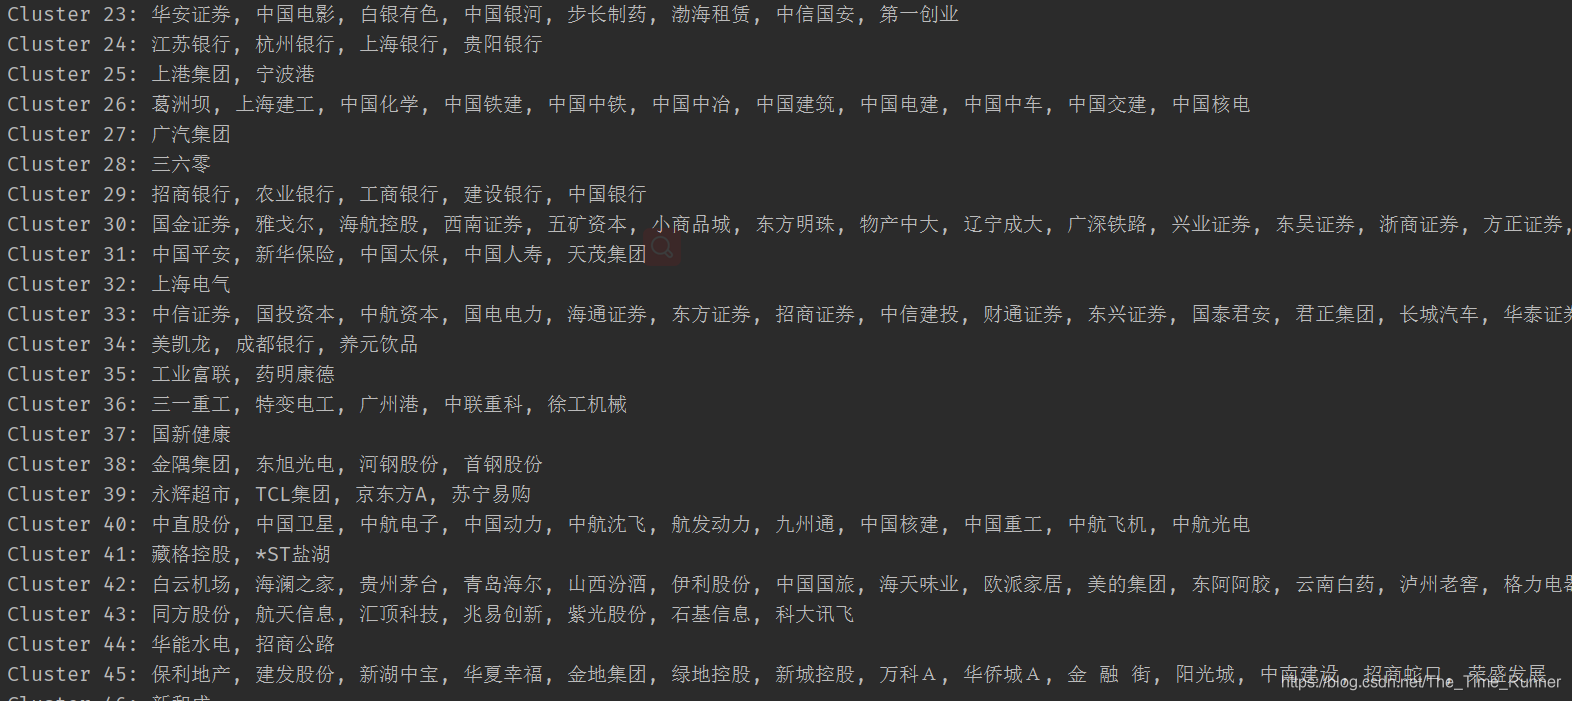
采用Affinity Propagation(近邻传播);因为它不强求相同大小的类,并且能从数据中自动确定类的数目。
_, labels = cluster.affinity_propagation(edge_model.covariance_)
n_labels = labels.max()
names = symbols_name[0:11]
for i in range(n_labels + 1):
    print('Cluster %i: %s' % ((i + 1), ', '.join(names[labels == i])))
采用 Manifold learning(流形学习)技术来实现2D嵌入。
node_position_model = manifold.LocallyLinearEmbedding(
    n_components=2, eigen_solver='dense', n_neighbors=6)

embedding = node_position_model.fit_transform(X.T).T
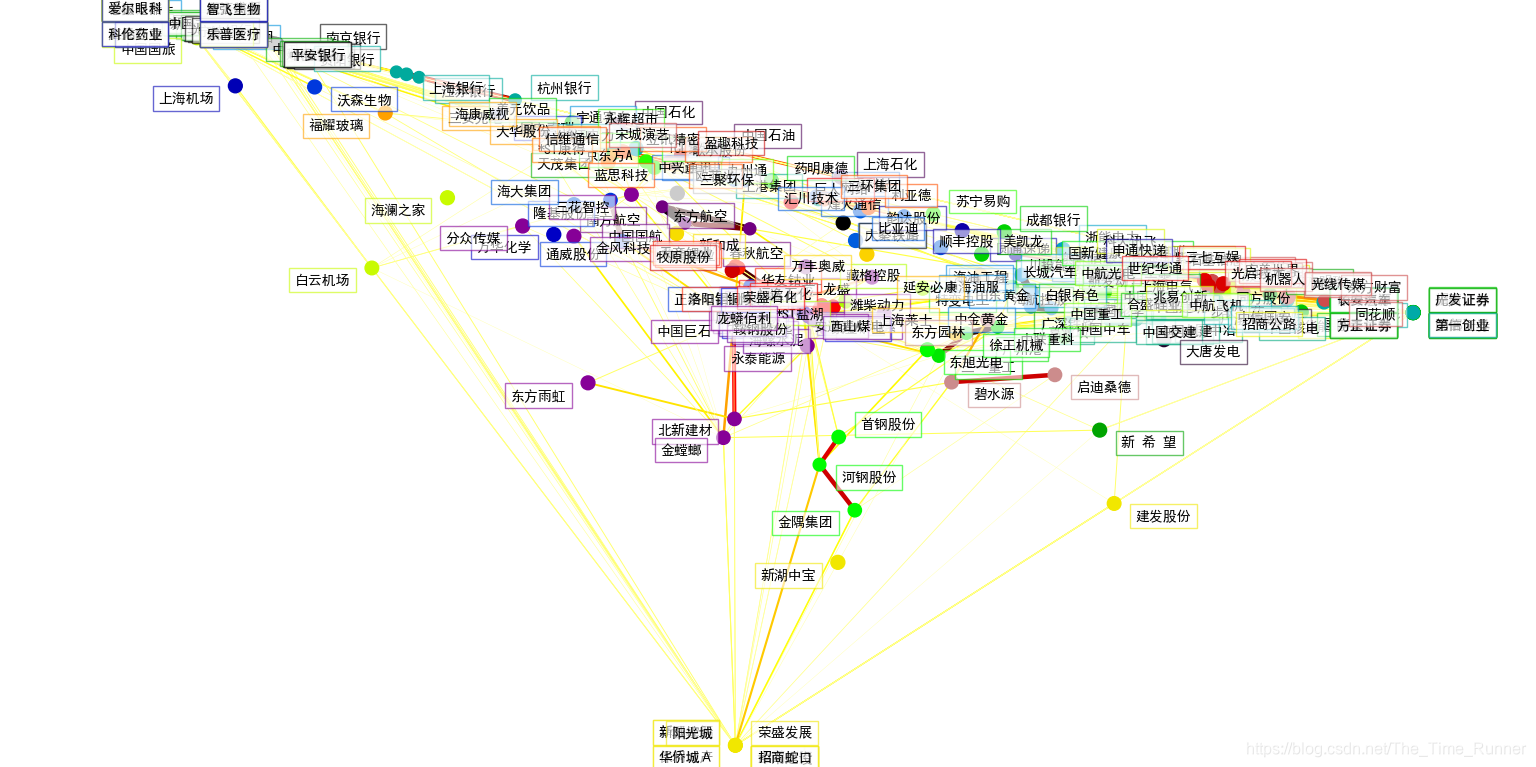
3个模型的输出结合在一个2D图形上,节点表示股票,边表示:
- 簇标签用于定义节点颜色
- 稀疏协方差模型用于展示边的强度
- 2D嵌入用于定位平面中的节点
# Visualization
plt.figure(1, facecolor='w', figsize=(10, 8))
plt.clf()
ax = plt.axes([0., 0., 1., 1.])
plt.axis('off')

# Display a graph of the partial correlations
partial_correlations = edge_model.precision_.copy()  #偏相关分析
d = 1 / np.sqrt(np.diag(partial_correlations))
partial_correlations *= d
partial_correlations *= d[:, np.newaxis]
non_zero = (np.abs(np.triu(partial_correlations, k=1)) > 0.02)

# Plot the nodes using the coordinates of our embedding
plt.scatter(embedding[0], embedding[1], s=100 * d ** 2, c=labels,
            cmap=plt.cm.nipy_spectral)

# Plot the edges
start_idx, end_idx = np.where(non_zero)
# a sequence of (*line0*, *line1*, *line2*), where::
#            linen = (x0, y0), (x1, y1), ... (xm, ym)

segments = [[embedding[:, start], embedding[:, stop]]
            for start, stop in zip(start_idx, end_idx)]
values = np.abs(partial_correlations[non_zero])
lc = LineCollection(segments,
                    zorder=0, cmap=plt.cm.hot_r,
                    norm=plt.Normalize(0, .7 * values.max()))
lc.set_array(values)
lc.set_linewidths(15 * values)
ax.add_collection(lc)

# Add a label to each node. The challenge here is that we want to
# position the labels to avoid overlap with other labels
for index, (name, label, (x, y)) in enumerate(
        zip(names, labels, embedding.T)):

    dx = x - embedding[0]
    dx[index] = 1
    dy = y - embedding[1]
    dy[index] = 1
    this_dx = dx[np.argmin(np.abs(dy))]
    this_dy = dy[np.argmin(np.abs(dx))]
    # print(dx)
    # print(this_dx)
    # exit()
    if this_dx > 0:
        horizontalalignment = 'left'
        x = x + .002
    else:
        horizontalalignment = 'right'
        x = x - .002
    if this_dy > 0:
        verticalalignment = 'bottom'
        y = y + .002
    else:
        verticalalignment = 'top'
        y = y - .002
    plt.text(x, y, name, size=10,
             horizontalalignment=horizontalalignment,
             verticalalignment=verticalalignment,
             bbox=dict(facecolor='w',
                       edgecolor=plt.cm.nipy_spectral(label / float(n_labels)),
                       alpha=.6))

plt.xlim(embedding[0].min() - .15 * embedding[0].ptp(),
         embedding[0].max() + .10 * embedding[0].ptp(),)
plt.ylim(embedding[1].min() - .03 * embedding[1].ptp(),
         embedding[1].max() + .03 * embedding[1].ptp())

plt.show()
综述,整个过程除了获取沪深300指数个股资料部分的代码,其余各部分操作与《可视化股票市场结构||沪深300股票聚类可视化》4中完全一样,如需详细了解,可参考上文,特别是上文附录了大量相关细节。
如需完整代码,请留言索取。
