之前有一些朋友评论和私信希望我可以出一些游戏数据分析、大厂数据分析的实例,我一直在找一个比较好的方式,因为内部的数据肯定是不能公开的,无论脱敏与否都不合规
如果现编一些数据和场景,又会丢失很多真实数据里面值得学习的点,所以一直卡着没有头绪
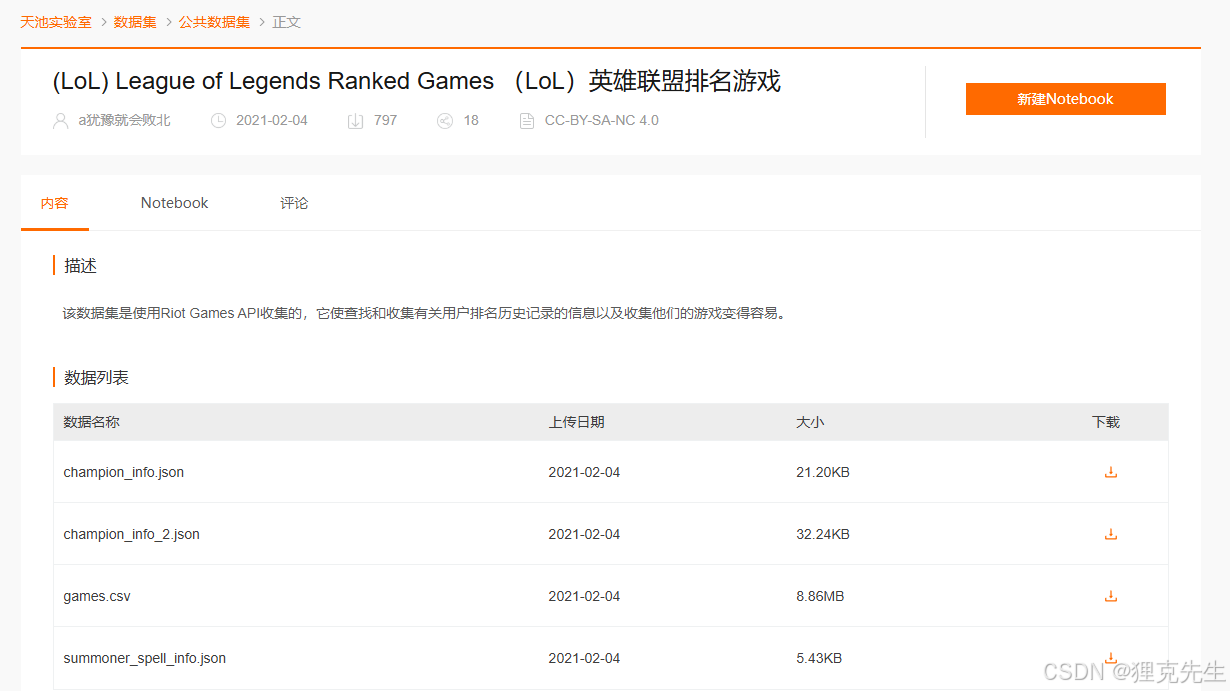
直到最近在研究阿里天池,发现阿里居然有现成的真实游戏数据
数据集的链接放在这里:https://tianchi.aliyun.com/dataset/90273
<class 'pandas.core.frame.DataFrame'>
RangeIndex: 51490 entries, 0 to 51489
Data columns (total 61 columns):
 #   Column              Non-Null Count  Dtype
---  ------              --------------  -----
 0   gameId              51490 non-null  int64
 1   creationTime        51490 non-null  int64
 2   gameDuration        51490 non-null  int64
 3   seasonId            51490 non-null  int64
 4   winner              51490 non-null  int64
 5   firstBlood          51490 non-null  int64
 6   firstTower          51490 non-null  int64
 7   firstInhibitor      51490 non-null  int64
 8   firstBaron          51490 non-null  int64
 9   firstDragon         51490 non-null  int64
 10  firstRiftHerald     51490 non-null  int64
 11  t1_champ1id         51490 non-null  int64
 12  t1_champ1_sum1      51490 non-null  int64
 13  t1_champ1_sum2      51490 non-null  int64
 14  t1_champ2id         51490 non-null  int64
 15  t1_champ2_sum1      51490 non-null  int64
 16  t1_champ2_sum2      51490 non-null  int64
 17  t1_champ3id         51490 non-null  int64
 18  t1_champ3_sum1      51490 non-null  int64
 19  t1_champ3_sum2      51490 non-null  int64
 20  t1_champ4id         51490 non-null  int64
 21  t1_champ4_sum1      51490 non-null  int64
 22  t1_champ4_sum2      51490 non-null  int64
 23  t1_champ5id         51490 non-null  int64
 24  t1_champ5_sum1      51490 non-null  int64
 25  t1_champ5_sum2      51490 non-null  int64
 26  t1_towerKills       51490 non-null  int64
 27  t1_inhibitorKills   51490 non-null  int64
 28  t1_baronKills       51490 non-null  int64
 29  t1_dragonKills      51490 non-null  int64
 30  t1_riftHeraldKills  51490 non-null  int64
 31  t1_ban1             51490 non-null  int64
 32  t1_ban2             51490 non-null  int64
 33  t1_ban3             51490 non-null  int64
 34  t1_ban4             51490 non-null  int64
 35  t1_ban5             51490 non-null  int64
 36  t2_champ1id         51490 non-null  int64
 37  t2_champ1_sum1      51490 non-null  int64
 38  t2_champ1_sum2      51490 non-null  int64
 39  t2_champ2id         51490 non-null  int64
 40  t2_champ2_sum1      51490 non-null  int64
 41  t2_champ2_sum2      51490 non-null  int64
 42  t2_champ3id         51490 non-null  int64
 43  t2_champ3_sum1      51490 non-null  int64
 44  t2_champ3_sum2      51490 non-null  int64
 45  t2_champ4id         51490 non-null  int64
 46  t2_champ4_sum1      51490 non-null  int64
 47  t2_champ4_sum2      51490 non-null  int64
 48  t2_champ5id         51490 non-null  int64
 49  t2_champ5_sum1      51490 non-null  int64
 50  t2_champ5_sum2      51490 non-null  int64
 51  t2_towerKills       51490 non-null  int64
 52  t2_inhibitorKills   51490 non-null  int64
 53  t2_baronKills       51490 non-null  int64
 54  t2_dragonKills      51490 non-null  int64
 55  t2_riftHeraldKills  51490 non-null  int64
 56  t2_ban1             51490 non-null  int64
 57  t2_ban2             51490 non-null  int64
 58  t2_ban3             51490 non-null  int64
 59  t2_ban4             51490 non-null  int64
 60  t2_ban5             51490 non-null  int64
dtypes: int64(61)
memory usage: 24.0 MB
可以看到这里有双方玩家选择的英雄、击杀、大小龙的统计**,还有一塔/首条龙**等等信息,并且是按战局粒度记录的,不是聚合后的统计数据
这其实就已经是非常接近真实的埋点数据了,大概率是通过一些解包工具拦截了 Log,也有可能是早期的 lol 就直接把 log 存在本地了,所以能够从里面解析出这些信息
不管数据是怎么来的,但既然这些就是数据分析师在工作中接触到的数据,那我们就能来模拟一个真实的分析场景
先来摸个底
在正式分析之前,我们先做个简单的数据探索,看看数据的分布
i=0
fig, axes = plt.subplots(2, 3, figsize=(15, 8), sharey=True)
for col in ['creationTime','seasonId','gameDuration','t1_champ1_sum1','t1_champ1id','winner']:
    ax = axes[i // 3, i % 3]
    n=data[col].nunique()
    if n<50 :
        sns.countplot(x=col, data=data, ax=ax, palette='Set2')
        ax.set_title(f'Distribution of {col}')
        ax.set_ylabel('Count')
        ax.set_xlabel(col)

    else:  # 对于数值型数据
        sns.histplot(data[col], ax=ax, color='skyblue', bins=10)
        ax.set_title(f'Distribution of {col}')
        ax.set_ylabel('Frequency')
        ax.set_xlabel(col)
    i=i+1

plt.tight_layout()
plt.show()
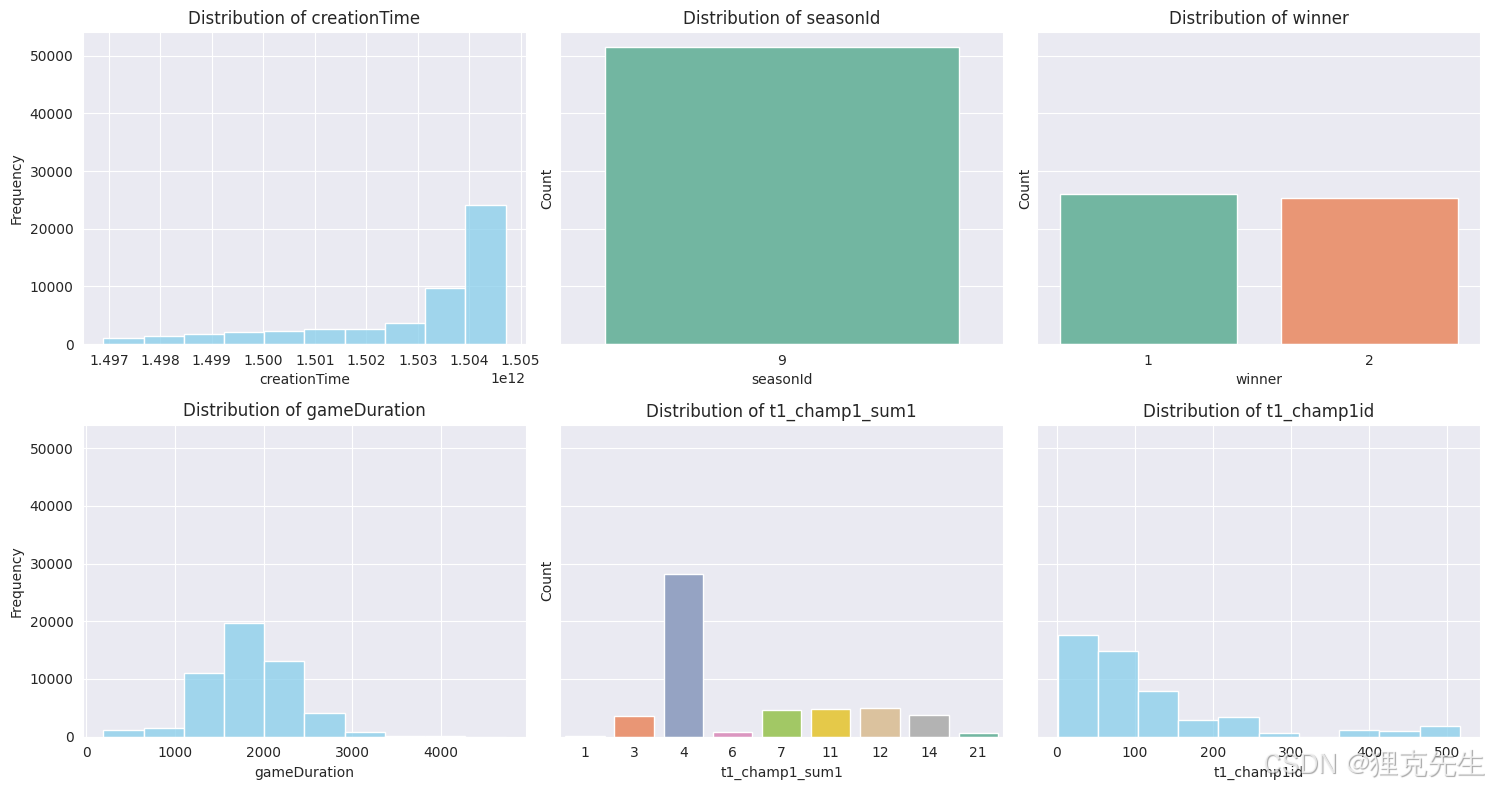
输出如下 :
这里我们对’creationTime’,‘seasonId’,‘gameDuration’,‘t1_champ1_sum1’,‘t1_champ1id’,'winner’这6个字段进行了数据探查,因为我们已经知道这个数据集是以对局为维度的数据,每一行代表的是一个对局,所以我们还需要了解一下这些对局有什么特征,主要的结论是:
- creationTime:创建时间,这应该是一个时间戳,从分布来看应该不止1天的数据,可能覆盖了比较长的一段时间
- seasonId:赛季ID,很遗憾,看来这里都是S9赛季的数据
- gameDuration:对局时长,值分布在几百到3000+,因此是以秒为单位的
- t1_champ1_sum1:未知命名,数据不是连续的,说明这不是英雄的KD之类的数据,应该是召唤师技能的ID
- t1_champ1id:英雄ID,数据分布比较广,应该是具体的ID而不是序号
- winner:只有1和2,说明不存在平局/投降标识之类的情况
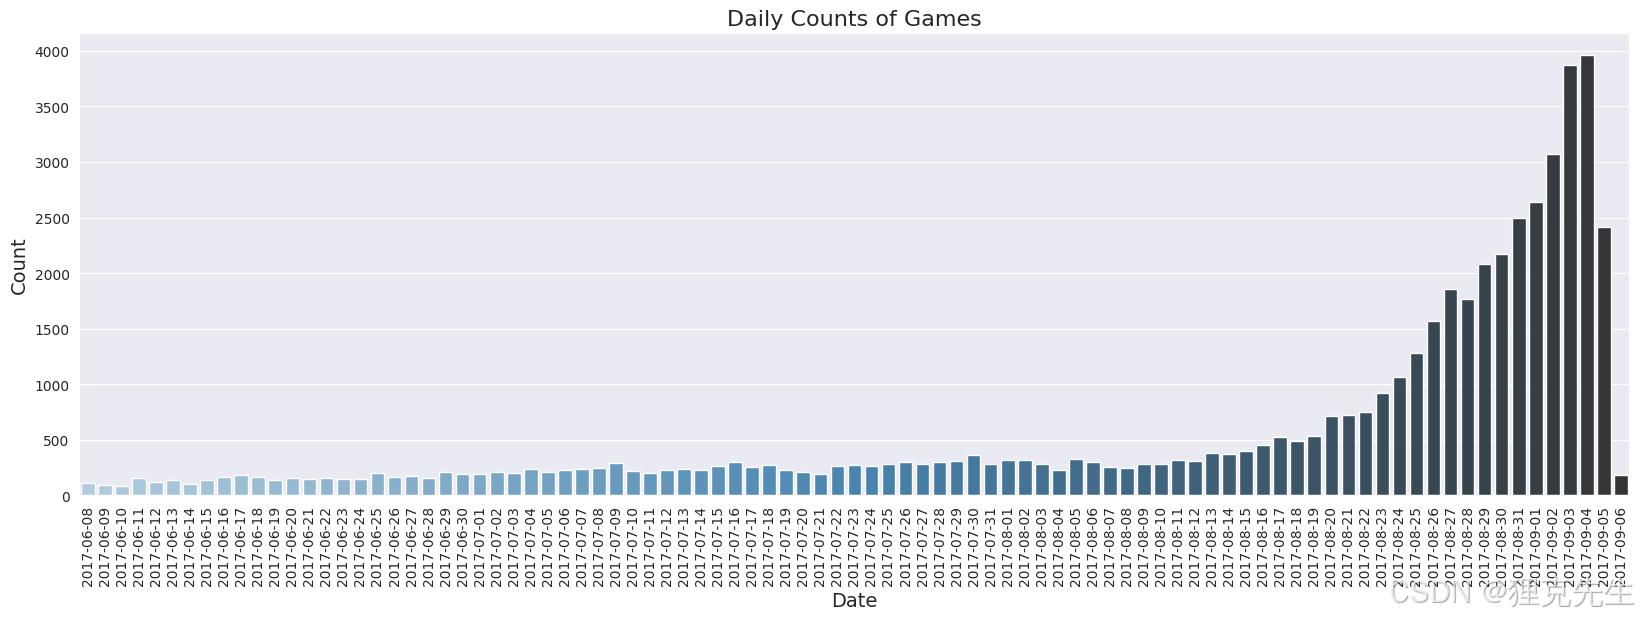
另外对于creationTime,我做了一下时间戳的转换,可以看出这是从17年6月到17年9月的对局数据,而且主要分布在8月份这个时间。
数据分析看板
制作 dashboard 是数分最常见的工作,那么对于英雄联盟这样的游戏,我们应该怎么规划分析看板呢?
基础分析1:胜率分析
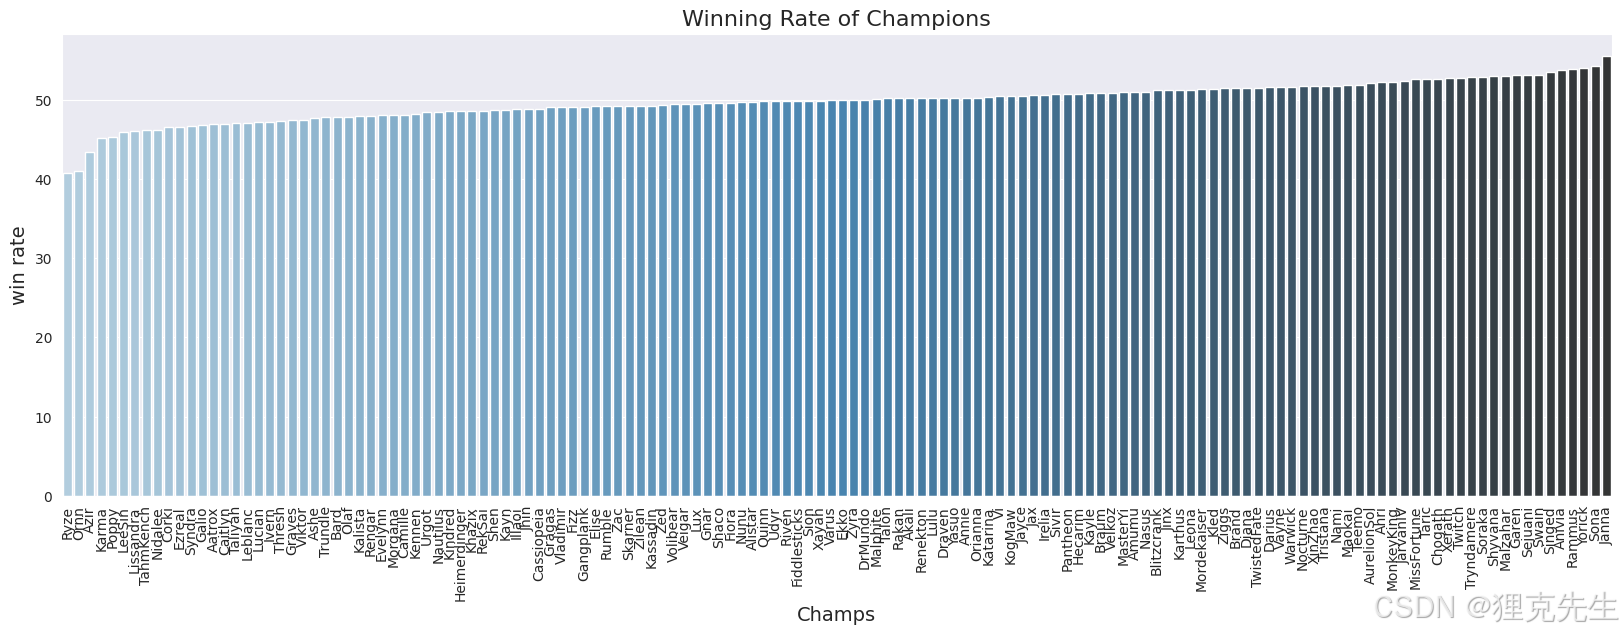
首先需要明确的是我们监控的目的是为了什么。对于英雄联盟这类公平竞技游戏,游戏的重中之重就是平衡性,平衡性的典型衡量基准就是胜率,包括:
英雄胜率:英雄胜场数 / 英雄出场数。如果某个英雄特别强胜率特别高,那说明游戏中存在特别超出平衡性的角色,当前游戏可能存在平衡性问题
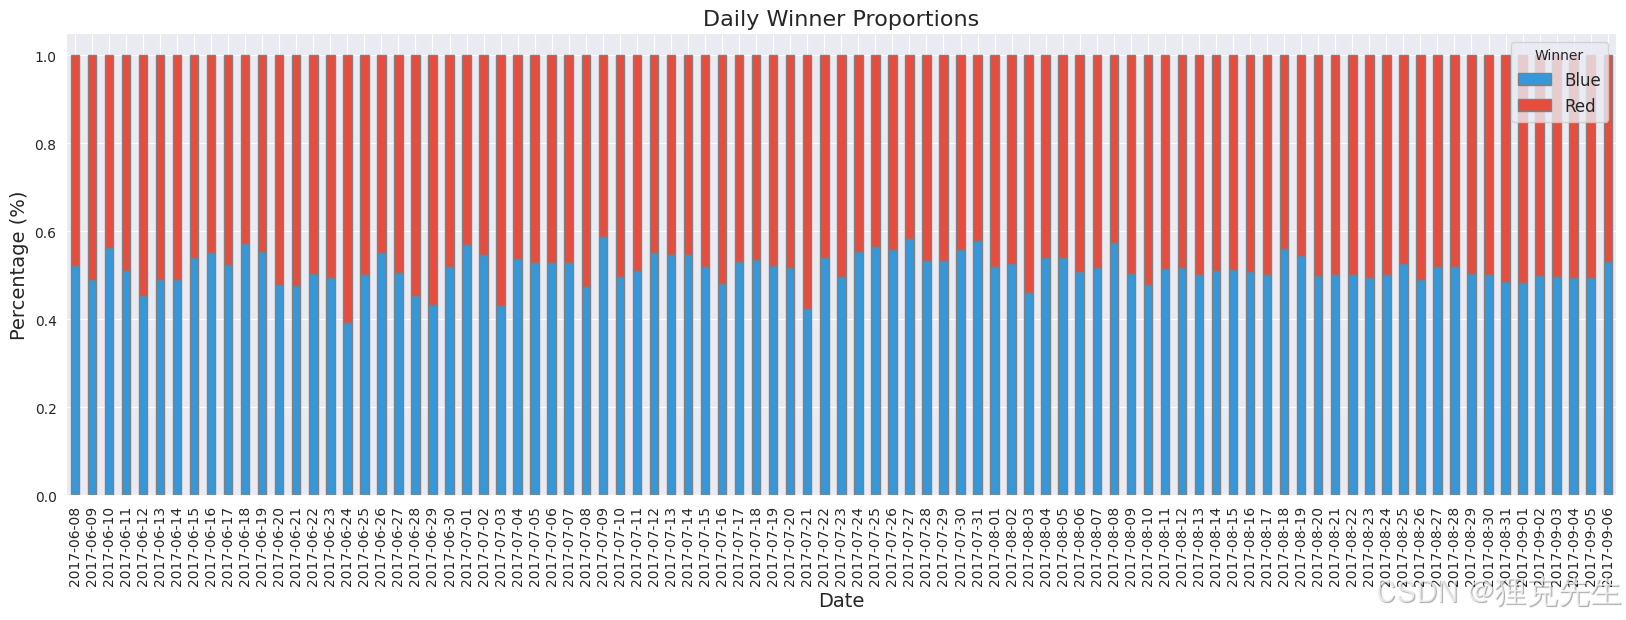
红蓝方胜率:红蓝方对局数 / 总对局数。大概率是稳定 50%的,背后其实代表着的是游戏地图的平衡性
因为数据中有胜方、时间、英雄 ID 等信息,所以我们可以很轻易的计算出胜率数据
但是,作为监控看板,就这样的两个图是远远不够的,因为现在这种程度顶多能称为“可视化看板”,在实际的工作中,我们往往希望看板能够给出一些基础的分析参考,实现“数据分析看板”的目的,为此我们还需要考虑评价标准(benchmark)和异常检测(Anomaly Detection)
题外话1:看板指标的评价标准
如果说什么样的胜率才是正常的,那么大部分人都会觉得 50%是一个理想的值
试想想,为什么我们会觉得双方 50%胜率是合理的? 是因为我们认为 50%是绝对公平的,这个50%本身就是我们基于经验的得出的一个评价标准(benchmark)
在红蓝胜率这里,确实 50%胜率是一个非常重要的标准,但在英雄胜率上就不一定了,实际上在游戏的分析中我们常常认为英雄胜率在45%~55%都是可以接受的,为什么不是50%?
1)一方面是因为做不到,实际影响英雄胜率的原因非常多,而英雄联盟中有上百个英雄,没有办法真正做到每个英雄都能有很好的平衡性体验
2)另一方面是分散不均的胜率对于游戏来说是健康的,英雄存在强度差异意味着玩家需要掌握更多的策略,并且也为版本之间提供了差异化的游戏体验,保证玩家的新鲜感
多数指标的评价标准来自于经验值的分布(经验驱动),但诸如付费、激活转化率、活跃时长等指标是业务驱动的,能够提供 benchmark 并给出指标表现的评价,是数据分析师的核心价值之一
题外话2:业务指标的异常检测
试想象一个场景:某一天红方的胜率提升到了 51%,这是一个值得关注的波动吗?
这是数据分析师最常见的工作场景,在搭好一个看板或者是确定一套指标体系后,还需要对指标的波动进行正确的识别和判断
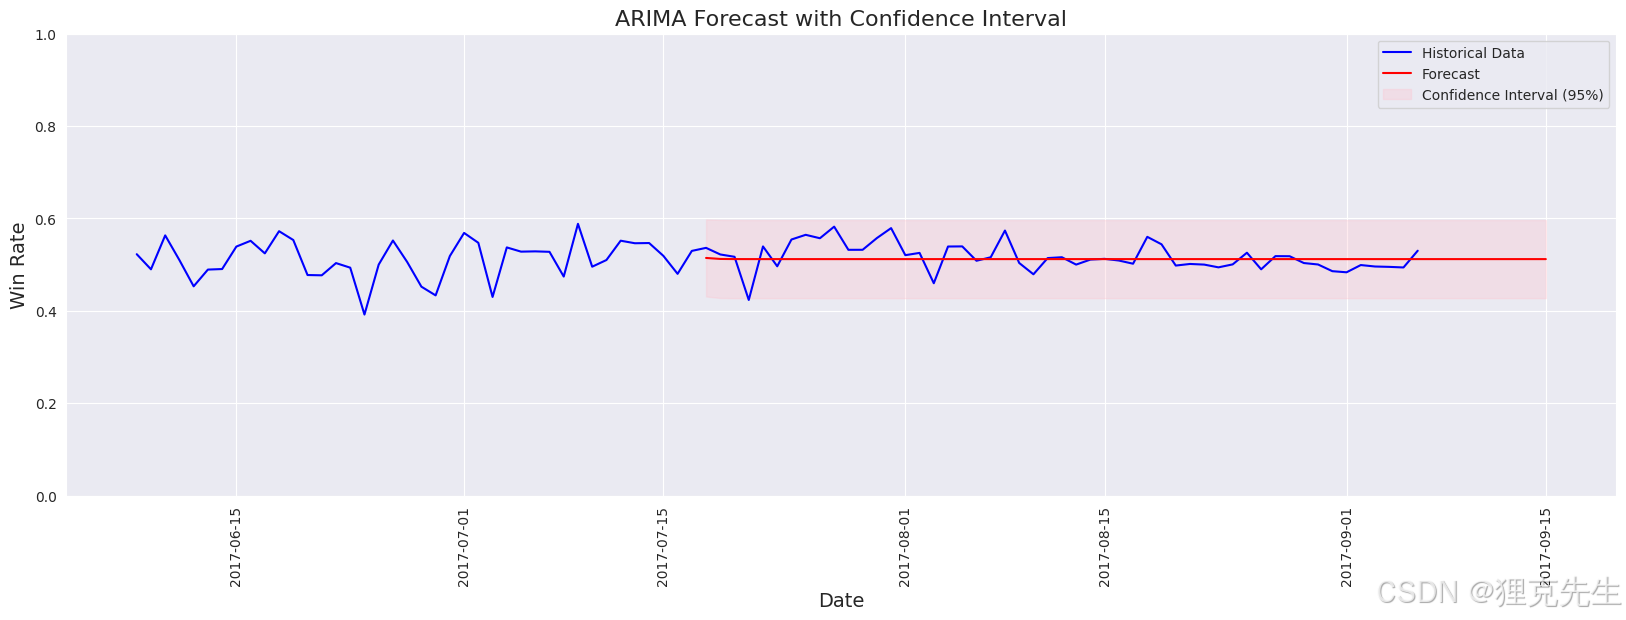
常用的方法是时序分析,以ARIMA为例,我们可以简单的基于前 40 天的数据计算一个时序预测结果,并提供置信区间,来判断后续 50 天的胜率是否处于正常的范围
from statsmodels.tsa.arima.model import ARIMA
from statsmodels.graphics.tsaplots import plot_predict

# 数据预处理
df=percentages.reset_index()[['creationDate','Blue']]
df.rename(columns={'creationDate':'date','Blue':'win_rate'},inplace=1)
df['date'] = pd.to_datetime(df['date'])  # 确保日期列为 datetime 类型
df.set_index('date', inplace=True)  # 将日期列设置为索引
df.sort_index(inplace=True)

# 拆分验证集,训练集
df_train=df.head(40)
df_valid=df.tail(50)

# 拟合 ARIMA 模型 (例如 ARIMA(1, 1, 1) - 你可以根据 AIC/BIC 或其他方法来选择最佳参数)
model = ARIMA(df_train['win_rate'], order=(1, 1, 1))
model_fit = model.fit()

# 进行预测
# 预测未来 10 天的数据,并返回置信区间
forecast_steps = 60
forecast_df_champs = model_fit.get_forecast(steps=forecast_steps)
forecast = forecast_df_champs.predicted_mean
stderr = forecast_df_champs.se_mean
conf_int = forecast_df_champs.conf_int(alpha=0.05)

# 画图:原始数据和预测数据
plt.figure(figsize=(20, 6))

# 绘制原始数据
plt.plot(df.index, df['win_rate'], label='Historical Data', color='blue')

forecast_index = pd.date_range(df_train.index[-1], periods=forecast_steps + 1, freq='D')[1:]

plt.plot(forecast_index, forecast, label='Forecast', color='red')
plt.fill_between(forecast_index, conf_int['lower win_rate'], conf_int['upper win_rate'], color='pink', alpha=0.3, label='Confidence Interval (95%)')

# 添加标题和标签
plt.title('ARIMA Forecast with Confidence Interval', fontsize=16)
plt.ylim(0,1)
plt.xlabel('Date', fontsize=14)
plt.ylabel('Win Rate', fontsize=14)
plt.legend()
plt.xticks(rotation=90)
plt.show()
输出:
因为胜率和总是100%的,所以我们只取了蓝色方的胜率来分析。可以看到,几乎所有的胜率都落到了95%置信区间内,说明后续的胜率波动也是合理的
从数据的波动来看也可以回答上面的问题,红方胜率提升到 51%是合理的状态,属于正常的数据波动
基础分析2:出场率分析
扯远了,还是回到我们的分析看板设计
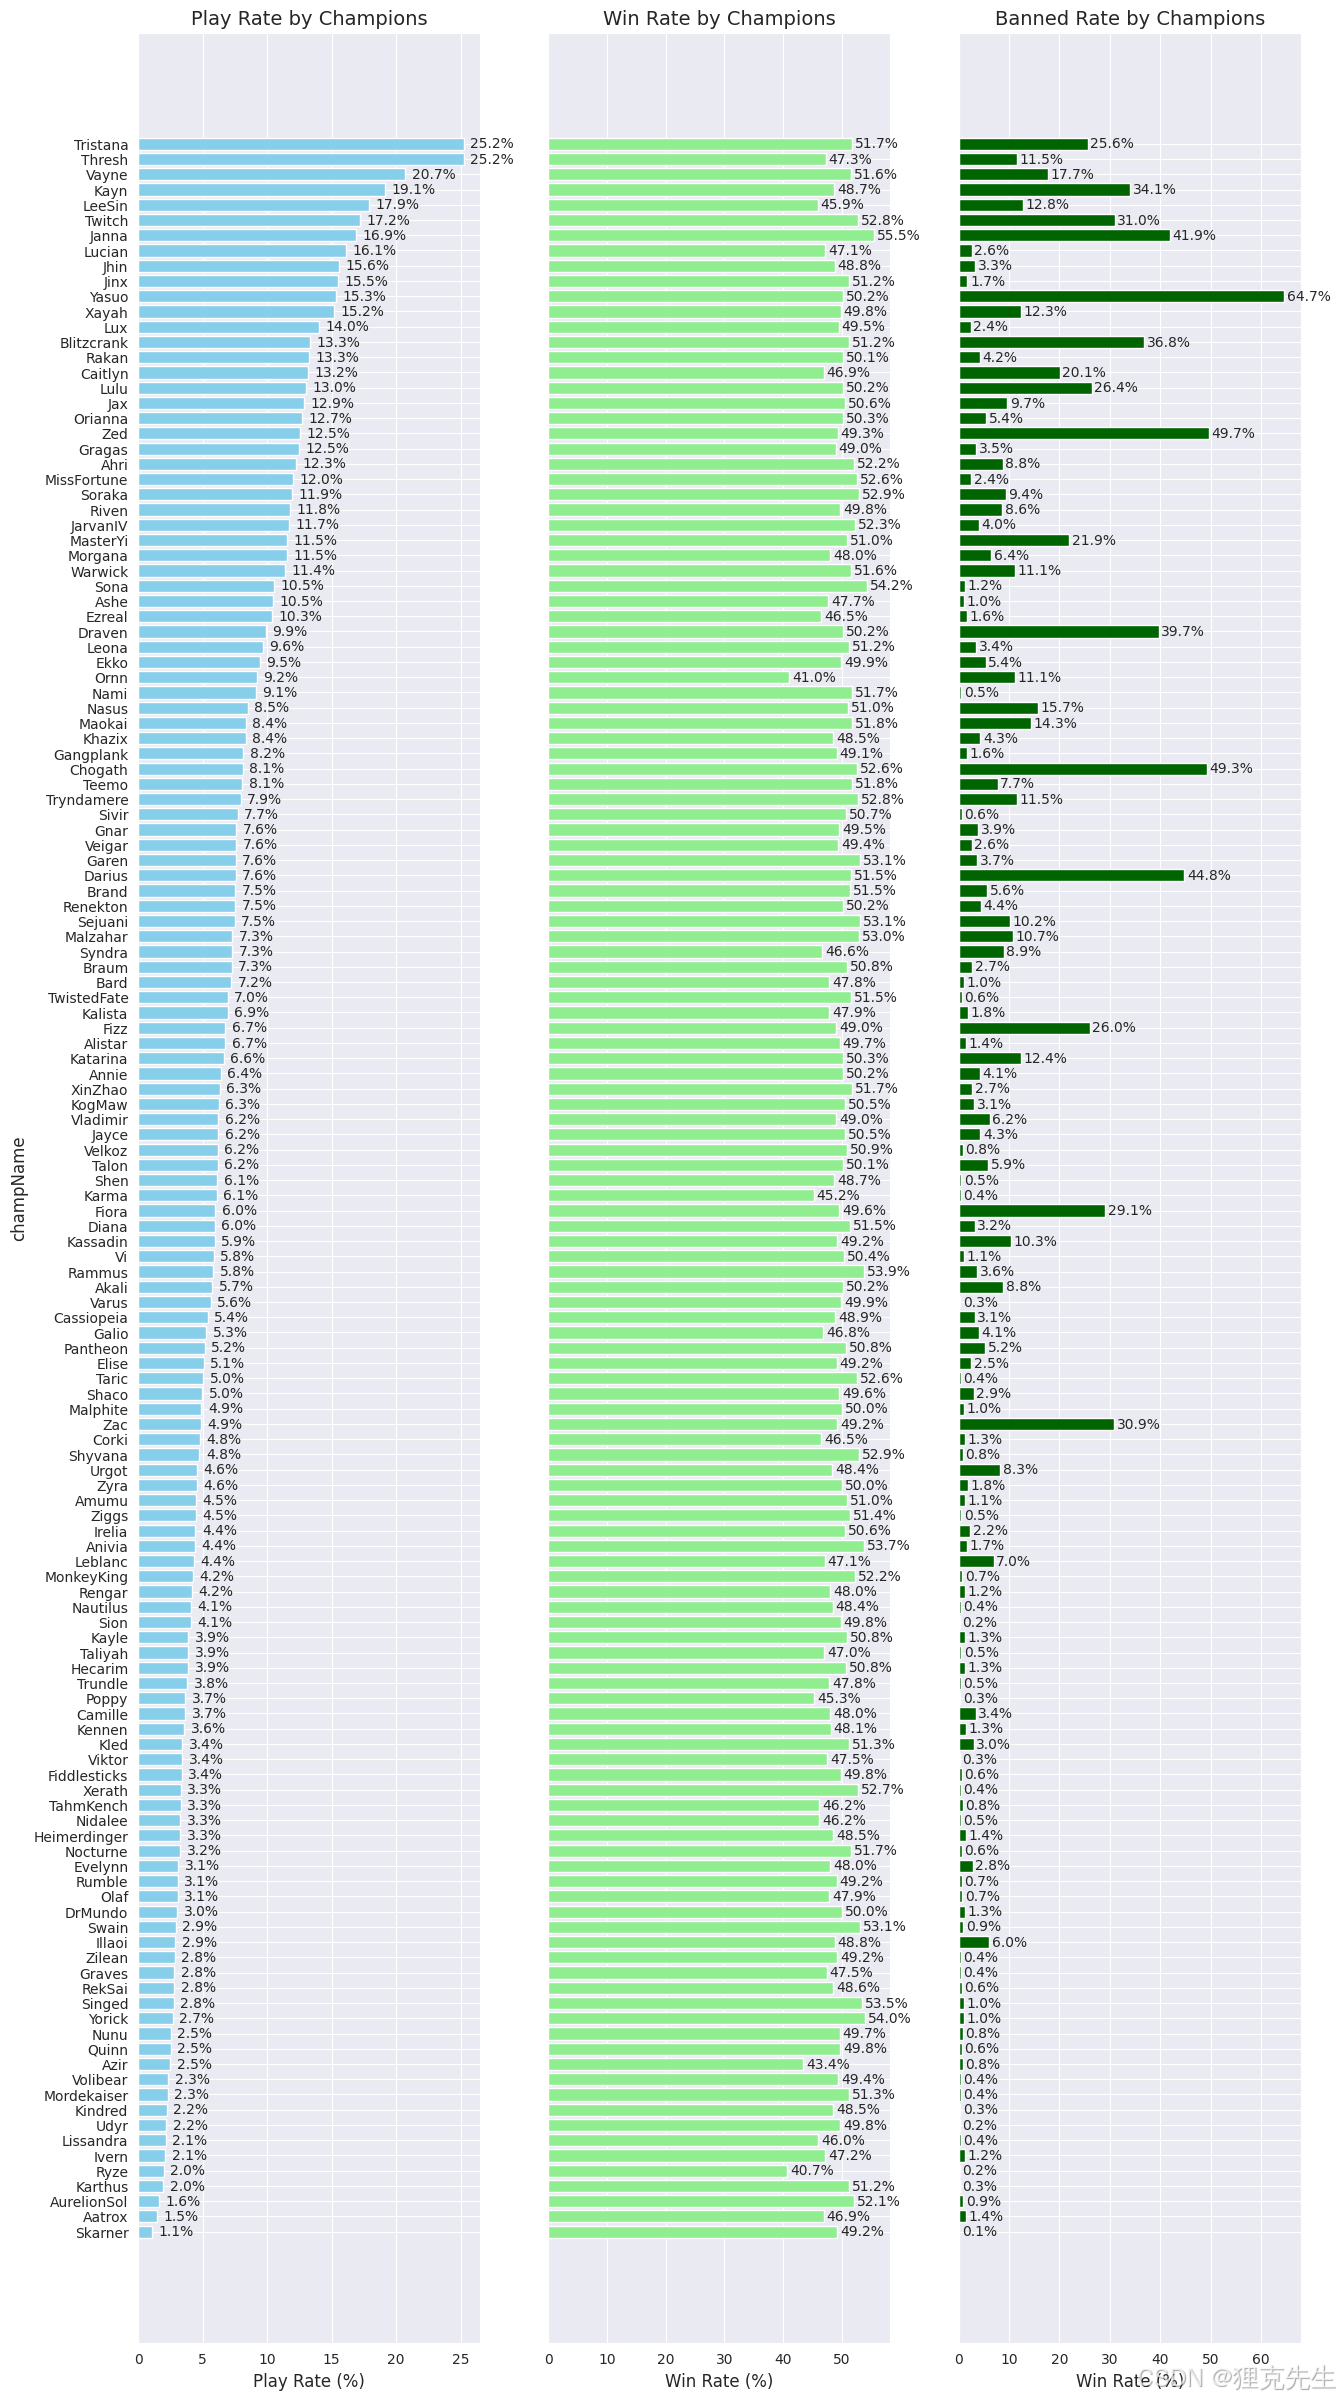
只有胜率的话这个分析看板还是太过于单薄了,对于平衡性,除了胜率之外还有一个常用的指标是出场率和ban率,也可以从侧面反映游戏的平衡性环境,因为如果大部分玩家都只选择个别英雄, 那说明游戏环境中实际符合平衡性要求的英雄是很少的,为了有更直观的对比,我们可以把英雄的胜率和出场率放到一起看,方便我们更直观的呈现结果
# 计算每个对局的唯一 gameId 数
total_games = df_champGames['gameId'].nunique()

# 计算每个 champId 的出场次数
champ_play_count = df_champGames.groupby('champId')['gameId'].nunique()

# 计算每个 champId 的出场率
champ_play_rate = champ_play_count / total_games *100

# 计算每个 champId 的胜场次数
champ_win_count = df_champGames[df_champGames['is_winner'] == 1].groupby('champId')['gameId'].nunique()

# 计算每个 champId 的胜率
champ_win_rate = (champ_win_count / champ_play_count *100).fillna(0)  # 填充NaN值为0,避免除以0的错误

# 计算每个 champId 的禁用率
df_champBanGames = pd.concat([data['t1_ban1'],data['t1_ban2'],data['t1_ban3'],data['t1_ban4'],data['t1_ban5'],
                     data['t2_ban1'],data['t2_ban2'],data['t2_ban3'],data['t2_ban4'],data['t2_ban5']],
                     ignore_index=True)
champ_banned_count=df_champBanGames.value_counts()
champ_banned_rate=champ_banned_count / total_games *100
champ_banned_rate.sort_values(inplace=True)


# 合并出场率和胜率、ban率结果
df_champs = pd.DataFrame({
    'play_rate': champ_play_rate,
    'win_rate': champ_win_rate,
    'banned_rate': champ_banned_rate
})


champInfo_dict=champInfo[['id','key']].set_index('id')['key'].to_dict()
df_champs['champName']=df_champs.index.map(champInfo_dict)
df_champs.sort_values('play_rate',inplace=True)
df_champs.dropna(inplace=True)

# 绘制水平条形图
fig, axes = plt.subplots(1, 3, figsize=(15, 30), sharey=True)

# 出场率
axes[0].barh(df_champs['champName'], df_champs['play_rate'], color='skyblue')
axes[0].set_title('Play Rate by Champions', fontsize=14)
axes[0].set_xlabel('Play Rate (%)', fontsize=12)
axes[0].set_ylabel('champName', fontsize=12)
for i in df_champs.index:
    axes[0].text(df_champs['play_rate'][i] + 0.5, df_champs['champName'][i],
                 f'{df_champs["play_rate"][i]:.1f}%', va='center')

# 胜率
axes[1].barh(df_champs['champName'], df_champs['win_rate'], color='lightgreen')
axes[1].set_title('Win Rate by Champions', fontsize=14)
axes[1].set_xlabel('Win Rate (%)', fontsize=12)
for i in df_champs.index:
    axes[1].text(df_champs['win_rate'][i] + 0.5, df_champs['champName'][i],
                 f'{df_champs["win_rate"][i]:.1f}%', va='center')

# ban率
axes[2].barh(df_champs['champName'], df_champs['banned_rate'], color='darkgreen')
axes[2].set_title('Banned Rate by Champions', fontsize=14)
axes[2].set_xlabel('Win Rate (%)', fontsize=12)
for i in df_champs.index:
    axes[2].text(df_champs['banned_rate'][i] + 0.5, df_champs['champName'][i],
                 f'{df_champs["banned_rate"][i]:.1f}%', va='center')

plt.show()
出场率最高的英雄分别是崔丝塔娜、锤石、薇恩、凯隐和李青,
出场率垫底的Top5分别是水晶先锋斯科莫,剑魔阿托克斯,龙王奥瑞利安索尔,死神卡尔萨斯和流浪法师瑞兹。
英雄胜率也符合我们前面所说的,胜率大多分布在45%~55%之间,除了瑞兹,胜率特别低仅40.7%,而最高的是风女迦娜,55.5%
科加斯、亚索、劫是Top3的ban位首选
聪明的你可能会发现:
为什么出场率、胜率这些数据看起来毫无逻辑?
这里需要提到分析看板的另一个重要元素:维度
维度是为指标提供更多分析价值的重要数据,以出场率和ban率来说,如果我们能够提供更多的维度用于拆分数据,就可以得到更加丰满的分析结论,例如:
- 游戏版本:对比不同版本的英雄出场率数据,我们可以判断版本改动带来的影响,从而给出版本效果相关的分析
- 段位:同一个英雄,在不同的段位中可能呈现完全不同的数据,通过区分段位,可以验证英雄的难易程度以及深度是否符合设计预期
- 模式:匹配、单排、多排、五排、巅峰赛等不同的游戏模式会为玩家带来截然不同的游戏体验,拆分模式分析有助于我们了解英雄设计和模式之间的相关性
- 英雄价格:出场率会显著受到英雄拥有率的影响,英雄越贵,则越稀有,相应的能够上场的机会就更低。把英雄的获取难易程度加以考虑,可以更好的帮助我们理解出场率的差异
很可惜的是,这些维度数据在这个数据集里面都没有提到,因此我们的分析只能对英雄的热门情况做一些简要的分析,但仍然有一些有意思的课题值得挖掘,感兴趣的朋友可以试着探索一下:
- 不同的英雄定位中,哪个英雄更受欢迎?
- 一血塔对游戏的胜负有多大的影响?
- 英雄的类型和游戏对局的时长有关吗?
