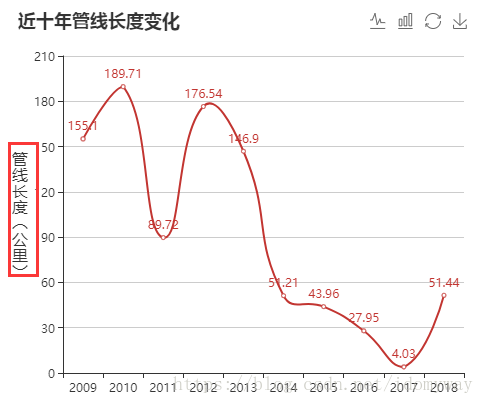
实现效果

知识点
- 折线光滑
- 设置grid
- 设置标题,toolbar
- Y轴垂直标题
代码实现
option = {
title: {
text: '近十年管线长度变化',
top:10,
left:10
},
tooltip : {
trigger: 'axis',
formatter: "{a} <br/>{b}年 : {c}公里"
},
toolbox: {
show : true,
top:10,
right:10,
feature : {
mark : {show: true},
magicType : {show: true, type: ['line', 'bar']},
restore : {show: true},
saveAsImage : {show: true}
}
},
grid:{
top:60,
right:20,
bottom:30,
left:60
},
legend: {
data:['']
},
xAxis: {
type: 'category',
data: [2009,2010,2011,2012,2013,2014,2015,2016,2017,2018]
},
yAxis: {
type: 'value',
name:"管\n线\n长\n度\n︵\n公\n里\n︶",
nameLocation:"center",
nameGap:35,
nameRotate:0,
nameTextStyle:{
fontSize: 16,
},
axisLabel : {
show:true,
showMinLabel:true,
showMaxLabel:true,
formatter: function (value) {
return value;
}
}
},
series: [{
name:'管线长度',
data: [155.1,189.71,89.72,176.54,146.90,51.21,43.96,27.95,4.03,51.44],
type: 'line',
smooth: true,
itemStyle : { normal: {label : {show: true}}}
}]
}
