文章目录
创建图表
创建一个没有节点和边的空图。
import networkx as nx
G = nx.Graph()
根据定义,“Graph”是节点(顶点)的集合以及
识别节点对(称为边、链接等)。 在 NetworkX 中,节点可以
是任何 hashable 对象,例如文本字符串、图像、XML 对象,
另一个 Graph、自定义节点对象等。
节点
图G可以通过多种方式增长。 NetworkX 包括许多
图形生成器函数和
以多种格式读取和写入图形的工具。
首先,我们将看看简单的操作。 您可以添加一个节点
一次,
G.add_node(1)
或从任何 iterable 容器添加节点,例如列表
G.add_nodes_from([2, 3])
还可以添加节点以及节点
如果容器产生表单的 2 元组,则属性
(node, node_attribute_dict):
>>> G.add_nodes_from([
...     (4, {"color": "red"}),
...     (5, {"color": "green"}),
... ])
节点属性将在下面进一步讨论。
一个图中的节点可以合并到另一个图中:
H = nx.path_graph(10)
G.add_nodes_from(H)
G 现在包含 H 的节点作为 G 的节点。
相比之下,您可以将图形 H用作G中的节点。
G.add_node(H)
图G现在包含H作为一个节点。 这种灵活性非常强大,因为
它允许图形图形、文件图形、函数图形等等。
值得考虑如何构建您的应用程序,以便节点
是有用的实体。 当然你总是可以在G中使用唯一标识符
并且有一个单独的字典,由标识符键控到节点信息,如果
你比较喜欢。
边
G 也可以通过一次添加一条边来增长,
G.add_edge(1, 2)
e = (2, 3)
G.add_edge(*e)  # unpack edge tuple*
通过添加边列表,
G.add_edges_from([(1, 2), (1, 3)])
或者通过添加任何边缘。 ebunch 是任何可迭代的
边缘元组的容器。 边元组可以是节点的 2 元组或 3 元组
带有 2 个节点,后跟一个边属性字典,例如,
(2, 3, {'weight': 3.1415})。 进一步讨论边缘属性
以下。
G.add_edges_from(H.edges)
There are no complaints when adding existing nodes or edges. For example,
after removing all nodes and edges,
G.clear()
我们添加新的节点/边,NetworkX 会悄悄地忽略任何
已经存在。
G.add_edges_from([(1, 2), (1, 3)])
G.add_node(1)
G.add_edge(1, 2)
G.add_node("spam")        # adds node "spam"
G.add_nodes_from("spam")  # adds 4 nodes: 's', 'p', 'a', 'm'
G.add_edge(3, 'm')
在此阶段,图 G 由 8 个节点和 3 个边组成,如下所示:
G.number_of_nodes()
G.number_of_edges()
3
DG = nx.DiGraph()
DG.add_edge(2, 1)   # adds the nodes in order 2, 1
DG.add_edge(1, 3)
DG.add_edge(2, 4)
DG.add_edge(1, 2)
assert list(DG.successors(2)) == [1, 4]
assert list(DG.edges) == [(2, 1), (2, 4), (1, 3), (1, 2)]
检查图的元素
我们可以检查节点和边。 四个基本图形属性有助于
报告:G.nodes、G.edges、G.adj 和G.degree。 这些
是节点、边、邻居(邻接)和度的类似集合的视图
图中的节点数。 它们提供持续更新的只读视图
图结构。 它们也类似于 dict,因为您可以查找节点
通过视图和边缘数据属性并使用数据属性进行迭代
使用方法.items()、.data()。
如果您想要一个特定的容器类型而不是一个视图,您可以指定一个。
这里我们使用列表,尽管集合、字典、元组和其他容器可能是
在其他情况下更好。
list(G.nodes)
list(G.edges)
list(G.adj[1])  # or list(G.neighbors(1))
G.degree[1]  # the number of edges incident to 1
2
可以指定从所有节点的子集中报告边和度
使用 nbunch。 nbunch 是以下任何一个:None(意味着所有节点),
一个节点,或一个可迭代的节点容器,它本身不是
图形。
G.edges([2, 'm'])
G.degree([2, 3])
DegreeView({2: 1, 3: 2})
从图中删除元素
可以以与添加类似的方式从图中删除节点和边。
使用方法
Graph.remove_node(),
Graph.remove_nodes_from(),
Graph.remove_edge()
和
Graph.remove_edges_from(),例如
G.remove_node(2)
G.remove_nodes_from("spam")
list(G.nodes)
G.remove_edge(1, 3)
使用图构造函数
图形对象不必增量构建 - 数据指定
图结构可以直接传递给各种构造函数
图类。
通过实例化其中一个图来创建图结构时
类,您可以指定多种格式的数据。
G.add_edge(1, 2)
H = nx.DiGraph(G)  # create a DiGraph using the connections from G
list(H.edges())
edgelist = [(0, 1), (1, 2), (2, 3)]
H = nx.Graph(edgelist)  # create a graph from an edge list
list(H.edges())
adjacency_dict = {0: (1, 2), 1: (0, 2), 2: (0, 1)}
H = nx.Graph(adjacency_dict)  # create a Graph dict mapping nodes to nbrs
list(H.edges())
[(0, 1), (0, 2), (1, 2)]
什么用作节点和边
您可能会注意到节点和边未指定为 NetworkX
对象。 这使您可以自由地使用有意义的项目作为节点和
边缘。 最常见的选择是数字或字符串,但节点可以
是任何可散列对象(“None”除外),并且可以关联边
使用G.add_edge(n1, n2, object=x)的任何对象x。
例如,n1 和 n2 可以是来自 RCSB Protein 的蛋白质对象
数据库,“x”可以指出版物的 XML 记录,详细说明
他们相互作用的实验观察。
我们发现这个异能非常有用,但它的滥用
除非熟悉 Python,否则可能会导致令人惊讶的行为。
如果有疑问,请考虑使用 convert_node_labels_to_integers() 来获得
带有整数标签的更传统的图形。
访问边和邻居
除了视图Graph.edges和Graph.adj,
使用下标符号可以访问边和邻居。
G = nx.Graph([(1, 2, {"color": "yellow"})])
G[1]  # same as G.adj[1]
G[1][2]
G.edges[1, 2]
{'color': 'yellow'}
您可以使用下标符号获取/设置边的属性
如果边缘已经存在。
G.add_edge(1, 3)
G[1][3]['color'] = "blue"
G.edges[1, 2]['color'] = "red"
G.edges[1, 2]
{'color': 'red'}
所有(节点,邻接)对的快速检查是使用
G.adjacency() 或 G.adj.items()。
请注意,对于无向图,邻接迭代会看到每条边两次。
FG = nx.Graph()
FG.add_weighted_edges_from([(1, 2, 0.125), (1, 3, 0.75), (2, 4, 1.2), (3, 4, 0.375)])
for n, nbrs in FG.adj.items():
    for nbr, eattr in nbrs.items():
        wt = eattr['weight']
        if wt < 0.5: print(f"({n}, {nbr}, {wt:.3})")
(1, 2, 0.125)
(2, 1, 0.125)
(3, 4, 0.375)
(4, 3, 0.375)
使用 edge 属性可以方便地访问所有边。
for (u, v, wt) in FG.edges.data('weight'):
    if wt < 0.5:
        print(f"({u}, {v}, {wt:.3})")
(1, 2, 0.125)
(3, 4, 0.375)
向图、节点和边添加属性
诸如权重、标签、颜色或任何您喜欢的 Python 对象之类的属性,
可以附加到图、节点或边。
每个图、节点和边都可以在关联的
属性字典(键必须是可散列的)。 默认情况下,这些是空的,
但是可以使用 add_edge、add_node 或直接添加或更改属性
操作名为“G.graph”、“G.nodes”和
图形“G”的“G.edges”。
图形属性
创建新图形时分配图形属性
G = nx.Graph(day="Friday")
G.graph
{'day': 'Friday'}
或者您可以稍后修改属性
G.graph['day'] = "Monday"
G.graph
{'day': 'Monday'}
节点属性
使用 add_node()、add_nodes_from() 或 G.nodes 添加节点属性
G.add_node(1, time='5pm')
G.add_nodes_from([3], time='2pm')
G.nodes[1]
G.nodes[1]['room'] = 714
G.nodes.data()
NodeDataView({1: {'time': '5pm', 'room': 714}, 3: {'time': '2pm'}})
请注意,将节点添加到 G.nodes 不会将其添加到图形中,请使用
G.add_node() 添加新节点。 边缘也是如此。
边缘属性
使用 add_edge()、add_edges_from() 添加/更改边属性,
或下标符号。
G.add_edge(1, 2, weight=4.7 )
G.add_edges_from([(3, 4), (4, 5)], color='red')
G.add_edges_from([(1, 2, {'color': 'blue'}), (2, 3, {'weight': 8})])
G[1][2]['weight'] = 4.7
G.edges[3, 4]['weight'] = 4.2
特殊属性 weight 应该是数字,因为它被使用
需要加权边的算法。
有向图
DiGraph 类提供特定的附加方法和属性
到有向边,例如,
DiGraph.out_edges、DiGraph.in_degree、
DiGraph.predecessors、DiGraph.successors 等。
为了让算法能够轻松地处理这两个类,有向版本的
neighbors 等价于
successors 而 degree 报告总和
in_degree 和 out_degree 即使有时感觉不一致。
DG = nx.DiGraph()
DG.add_weighted_edges_from([(1, 2, 0.5), (3, 1, 0.75)])
DG.out_degree(1, weight='weight')
DG.degree(1, weight='weight')
list(DG.successors(1))
list(DG.neighbors(1))
[2]
一些算法仅适用于有向图,而其他算法效果不佳
为有向图定义。 确实有肿块导向的倾向
和无向图放在一起是危险的。 如果你想治疗
对于某些测量,您可能应该将有向图视为无向图
使用 Graph.to_undirected() 或使用
H = nx.Graph(G) # create an undirected graph H from a directed graph G
多图
NetworkX 为允许多边的图提供类
任意一对节点之间。 MultiGraph 和
多有向图
类允许您添加相同的边缘两次,可能具有不同的
边缘数据。 这对于某些应用程序来说可能很强大,但许多
算法在这样的图上没有很好的定义。
在结果明确的地方,
例如,MultiGraph.degree() 我们提供了这个函数。 否则你
应该以进行测量的方式转换为标准图形
定义明确。
MG = nx.MultiGraph()
MG.add_weighted_edges_from([(1, 2, 0.5), (1, 2, 0.75), (2, 3, 0.5)])
dict(MG.degree(weight='weight'))
GG = nx.Graph()
for n, nbrs in MG.adjacency():
    for nbr, edict in nbrs.items():
        minvalue = min([d['weight'] for d in edict.values()])
        GG.add_edge(n, nbr, weight = minvalue)

nx.shortest_path(GG, 1, 3)
[1, 2, 3]
图生成器和图操作
除了逐节点或逐边构造图外,它们
也可以由
1. 应用经典的图操作,例如:
2. 使用对经典小图之一的调用,例如,
3. 对经典图使用(构造性)生成器,例如,
像这样:
K_5 = nx.complete_graph(5)
K_3_5 = nx.complete_bipartite_graph(3, 5)
barbell = nx.barbell_graph(10, 10)
lollipop = nx.lollipop_graph(10, 20)
4. 使用随机图生成器,例如,
像这样:
er = nx.erdos_renyi_graph(100, 0.15)
ws = nx.watts_strogatz_graph(30, 3, 0.1)
ba = nx.barabasi_albert_graph(100, 5)
red = nx.random_lobster(100, 0.9, 0.9)
5. 使用常见的图形格式读取存储在文件中的图形
NetworkX 支持许多流行的格式,例如边缘列表、邻接列表、
GML、GraphML、pickle、LEDA 等。
nx.write_gml(red, "path.to.file")
mygraph = nx.read_gml("path.to.file")
有关图形格式的详细信息,请参阅阅读和编写图形
对于图形生成器功能,请参阅图形生成器
分析图表
可以使用各种图论来分析 G 的结构
功能,例如:
G = nx.Graph()
G.add_edges_from([(1, 2), (1, 3)])
G.add_node("spam")       # adds node "spam"
list(nx.connected_components(G))
sorted(d for n, d in G.degree())
nx.clustering(G)
{1: 0, 2: 0, 3: 0, 'spam': 0}
一些具有大输出的函数迭代 (node, value) 2 元组。
如果您愿意,这些很容易存储在 dict 结构中。
sp = dict(nx.all_pairs_shortest_path(G))
sp[3]
{3: [3], 1: [3, 1], 2: [3, 1, 2]}
有关图算法的详细信息,请参阅算法
支持的。
绘制图形
NetworkX 主要不是图形绘图包,而是基本绘图
Matplotlib 以及使用开源 Graphviz 软件的接口
包都包括在内。 这些是 networkx.drawing 的一部分
模块,如果可能,将被导入。
首先导入 Matplotlib 的绘图界面(pylab 也可以)
import matplotlib.pyplot as plt
测试nx_pylab的导入是否成功绘制G
使用其中之一
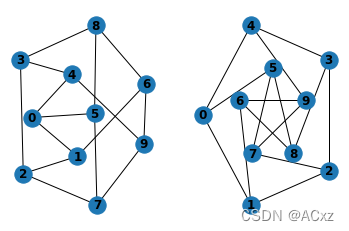
G = nx.petersen_graph()
subax1 = plt.subplot(121)
nx.draw(G, with_labels=True, font_weight='bold')
subax2 = plt.subplot(122)
nx.draw_shell(G, nlist=[range(5, 10), range(5)], with_labels=True, font_weight='bold')
绘制到交互式显示器时。 请注意,您可能需要发出
Matplotlib
plt.show()
命令,如果您不在交互模式下使用 matplotlib(请参阅
这个 Matplotlib 常见问题解答)。
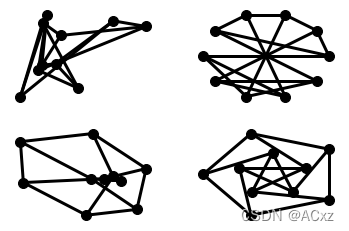
options = {
    'node_color': 'black',
    'node_size': 100,
    'width': 3,
}
subax1 = plt.subplot(221)
nx.draw_random(G, **options)
subax2 = plt.subplot(222)
nx.draw_circular(G, **options)
subax3 = plt.subplot(223)
nx.draw_spectral(G, **options)
subax4 = plt.subplot(224)
nx.draw_shell(G, nlist=[range(5,10), range(5)], **options)
您可以通过 draw_networkx() 和
通过“布局模块”进行布局。
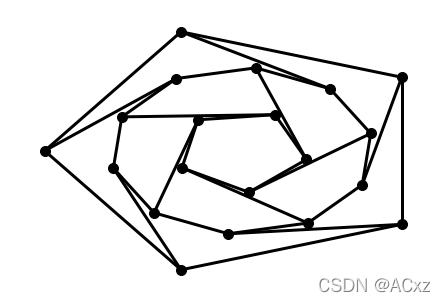
您可以通过draw_shell() 使用多个shell。
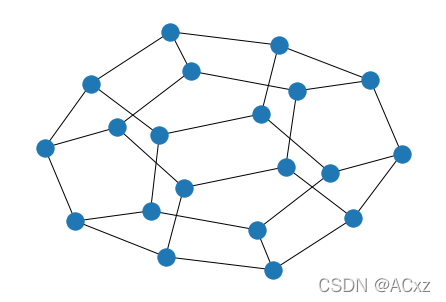
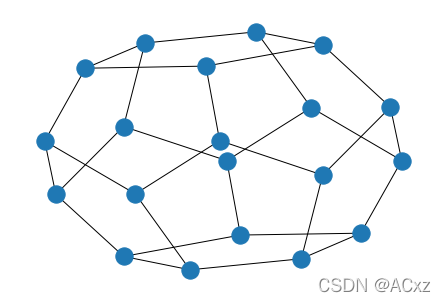
G = nx.dodecahedral_graph()
shells = [[2, 3, 4, 5, 6], [8, 1, 0, 19, 18, 17, 16, 15, 14, 7], [9, 10, 11, 12, 13]]
nx.draw_shell(G, nlist=shells, **options)
要将图纸保存到文件,请使用,例如
nx.draw(G)
plt.savefig("path.png")
此函数写入本地目录中的文件“path.png”。 如果 Graphviz 和
PyGraphviz 或 pydot,在您的系统上可用,您也可以使用
networkx.drawing.nx_agraph.graphviz_layout 或
networkx.drawing.nx_pydot.graphviz_layout 获取节点位置,或者写
点格式的图形以供进一步处理。
from networkx.drawing.nx_pydot import write_dot
pos = nx.nx_agraph.graphviz_layout(G)
nx.draw(G, pos=pos)
write_dot(G, 'file.dot')
networkx官网:https://networkx.org/
