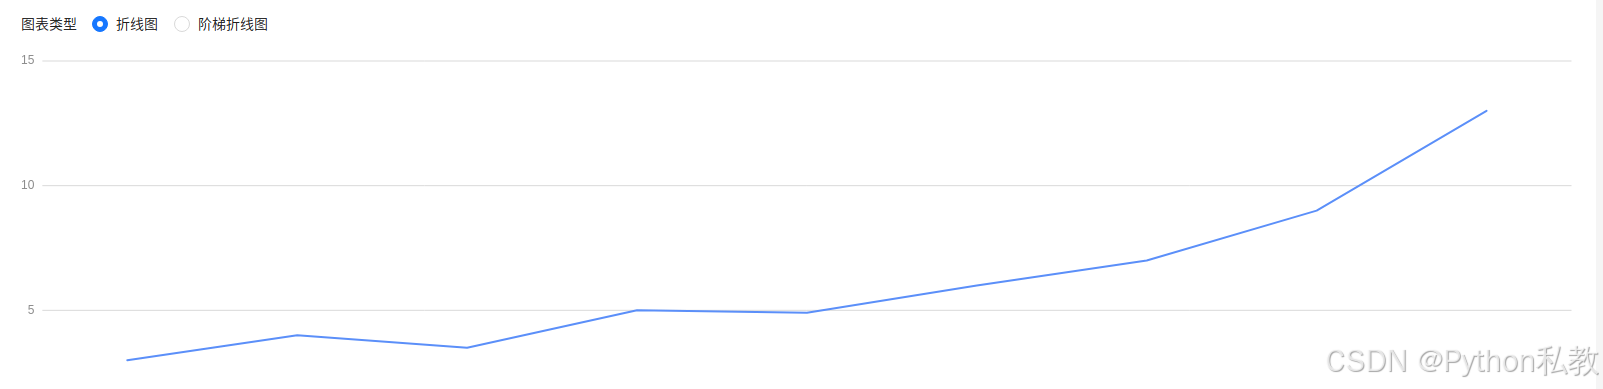
如图:
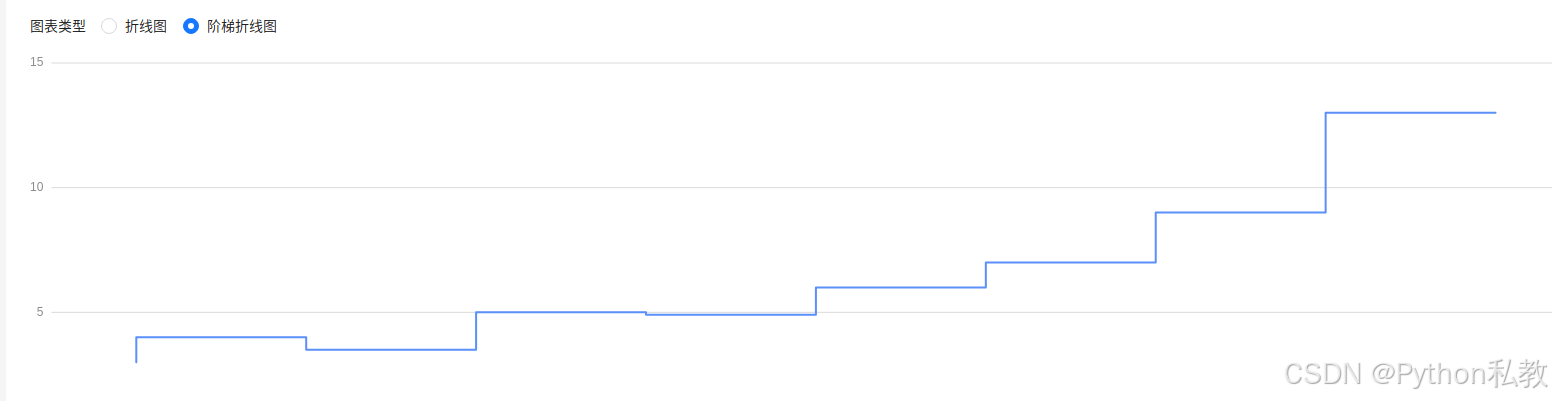
当我点击阶梯折线图的时候,显示的是阶梯折线图,但是当我点击折线图的时候我希望显示的是折线图。
核心思路是是在图表类型变化的时候,调用update方法,核心代码如下:
const renderChart = async () => {
  if (!chart.value){
    chart.value = new Line('container', {
      data: data.value,
      xField: 'year',
      yField: 'value',
      stepType: chartType.value,
    });
  }else{
    chart.value.update({
      stepType: chartType.value
    })
  }
  chart.value.render();
}
完整代码如下:
<script setup>
import {onMounted, reactive, ref} from "vue";
import {Line} from "@antv/g2plot";
import axios from "axios";
import {MdPreview, MdEditor} from 'md-editor-v3';
import 'md-editor-v3/lib/style.css';
import {message} from "ant-design-vue";

const editText = ref()
const text = ref();
const activeKey = ref('chart');


// form
const chart = ref()
const data = ref([])
const chartType = ref("line")
const blog = ref()
const uniKey = "/line/step_type_vh"
const isEdit = ref(false)
const title = ref("")
const description = ref("")

const updateBlog = async (data) => {
  console.log(data)
  await axios({
    method: "put",
    url: `http://127.0.0.1:8888/zdppy_amblog_markdown/${blog.value.id}`,
    data,
  }).then(() => {
    message.success("修改代码成功")
    activeKey.value = "code"
  })
}

const loadBlog = async () => {
  await axios({
    method: "get",
    url: `http://127.0.0.1:8888/zdppy_amblog_markdown?uniKey=${uniKey}`,
  }).then(resp => {
    console.log("loadBlog", resp.data)
    if (resp.data && resp.data.data && resp.data.data.results && resp.data.data.results.length > 0) {
      blog.value = resp.data.data.results[0]
      text.value = blog.value.content
      title.value = blog.value.title
      description.value = blog.value.description
      editText.value = blog.value.content
      isEdit.value = true
    }
  })
}

const saveBlog = async (data) => {
  console.log("save", data)
  await axios({
    method: "post",
    contentType: "application/json",
    url: "http://127.0.0.1:8888/zdppy_amblog_markdown",
    data,
  }).then(() => {
    message.success("保存代码成功")
    activeKey.value = "code"
  })
}

const handleEditorSubmit = async () => {
  if (!title.value) {
    message.warning("文章的标题不能为空")
    return
  }
  if (!editText.value) {
    message.warning("文章的内容不能为空")
    return;
  }
  const data = {
    uniKey,
    title: title.value,
    description: description.value,
    content: editText.value,
  }
  if (isEdit.value) {
    await updateBlog(data)
  } else {
    await saveBlog(data)
  }
  await loadBlog()
}

const loadData = async () => {
  await axios({
    method: "get",
    url: "http://127.0.0.1:8888/zdppy_amg2plot_line",
    params: {
      size: 10000,
      year: "notnull",
      category: "null",
      order: "keyDate",
    }
  }).then(resp => {
    if (resp.data && resp.data.data && resp.data.data.results) {
      data.value = resp.data.data.results
    }
  })
}

const renderChart = async () => {
  if (!chart.value){
    chart.value = new Line('container', {
      data: data.value,
      xField: 'year',
      yField: 'value',
      stepType: chartType.value,
    });
  }else{
    chart.value.update({
      stepType: chartType.value
    })
  }
  chart.value.render();
}
const handleChartTypeChange = async (e) => {
  const chartType = e.target.value
  console.log("chartType", chartType)
  console.log(e)
  await renderChart()
}
onMounted(async () => {
  await loadBlog()
  await loadData()
  await renderChart()
})

</script>

<template>
  <a-tabs v-model:activeKey="activeKey">
    <a-tab-pane key="chart" tab="图表">
      <div id="config">
        <div class="config-item">
          <span class="label">图表类型</span>
          <a-radio-group v-model:value="chartType" @change="handleChartTypeChange">
            <a-radio value="line">折线图</a-radio>
            <a-radio value="vh">阶梯折线图</a-radio>
          </a-radio-group>
        </div>
      </div>
      <div id="container"></div>
    </a-tab-pane>
    <a-tab-pane key="code" tab="源码">
      <MdPreview v-model="text"/>
    </a-tab-pane>
    <a-tab-pane key="edit" tab="编辑">
      <a-form-item label="标题">
        <a-input v-model:value="title"/>
      </a-form-item>
      <a-form-item label="描述">
        <a-textarea v-model:value="description"/>
      </a-form-item>
      <a-form-item label="内容">
        <MdEditor v-model="editText"/>
      </a-form-item>
      <a-form-item>
        <a-button
            type="primary"
            html-type="submit"
            style="margin-left: 40px"
            @click="handleEditorSubmit"
        >
          提交
        </a-button>
      </a-form-item>
    </a-tab-pane>
  </a-tabs>
</template>

<style scoped>
#config {
  margin-bottom: 20px;
}

#config .config-item {
  display: flex;
  justify-content: start;
  align-items: center;
}

#config .label {
  margin-right: 15px;
}
</style>