前言
转眼开始写博客已经一年了,这篇本来是寒假前就想发的,谁知一拖就是几个月。
之前老是想在网上找关于飞行器相关的仿真程序,但是一直也没有找到比较经典、合理的。给平时的工作带来了困扰,这部分的代码我也是经过看师兄的程序,看论文,整理出一个比较简单的框架,而且那会复现了别人论文里的结果,所以后面的有些工作也建立在这个之上,分享出来与大家共同进步。
来源
代码中所用到的模型来自:张勇. 面向控制的高超声速飞行器一体化设计[D]. 南京航空航天大学, 2012.
第三章,3.2.2节的内容。
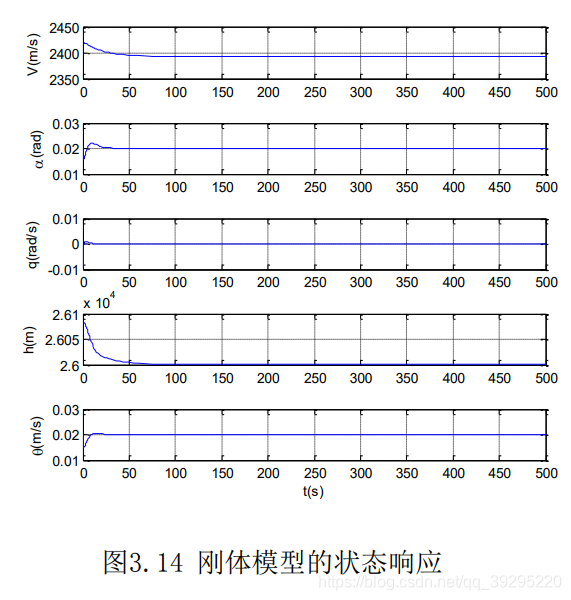
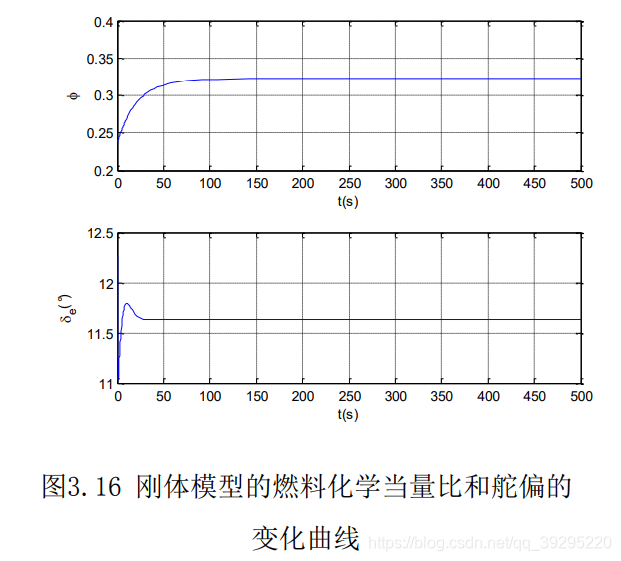
附上参考文献中的结果以供对比:
MATLAB
代码
话不多说,直接上MATLAB代码,我的注释也算是比较详细了,切换文件夹一类的改成自己电脑上的相应路径就好,纯属个人习惯。
思路很简单,先定义参数,后定义模型。接着在循环中不断求解状态微分量,更新,引入状态量,模型就“动起来了”
% 尝试用之前现有的数据实现传统的跟踪控制器设计
% 状态空间模型步长加入控制律仿真
% 《面向控制的高超声速飞行器一体化设计》张勇
% 2021年2月6日  WJJ
%状态空间模型解算
% 首先套用论文中的刚体模型系数矩阵
clear all;
clc;
close all;
%% 状态量初始化
cd ('D:\OneDrive - 徐州开放大学\NPU\program\Morphing');

% 论文中的平衡点输入、状态 8Ma,26000m
uStable = [0.323;0.203];
xStable = [2392.48,0.020,0,26000,0.020];
xInitial = [2425,0.015,0,26100,0.015];          % 初始状态
% V = xStable(1)+ 500;                   %初始化状态
% alpha = xStable(2)+ 4;
% omegaz = xStable(3)+ 1;
% height = xStable(4)+ 2000;
% theta = xStable(5)+ 3;
V = xInitial(1);                   %初始化状态
alpha = xInitial(2);
omegaz = xInitial(3);
height = xInitial(4);
theta = xInitial(5);
deltat = uStable(1);            %初始化控制输入
deltae = uStable(2);

% 状态矩阵A
A = [-0.0036, -11.929, 0, -0.0000026, -9.727;...
-0.0000015, -0.1087, 1, 0, 0;...
-0.0003, 16.122, 0, 0, 0;...
0, -2392.48, 0, 0, 2392.48;...
0, 0, 1, 0, 0];

% 控制矩阵B
B=[ 14.2399, -0.0014, 0.1355, 0, 0;
-16.669, -0.0166, -8.273, 0, 0]';

C = eye(5);           %全输出
D = zeros(5,2);

states = {'V','alpha','omegaz','height','theta'};   %定义状态变量速度、弹道倾角、高度、攻角、俯仰角速度
inputs = {'sigma','deltae'};        %定义输入变量 水平舵偏角与油门阈值
outputs = {'V','theta','height','alpha','omegaz'};  %定义输出

sys = ss(A,B,C,D,'statename',states,'inputname',inputs,'outputname',outputs);   %输出并显示系统状态方程模型

co = ctrb(A,B);      %检验系统的能控性,若满秩则能控  可控
ob = obsv(A,C);    %检验系统的可观性,若满秩则可观   能观


% 论文中的LQR状态反馈增益矩阵
Klqr =[-0.003, 1.1729, -0.0114, 0, -1.2358;...
-0.0005, -0.7145, 0.9934, 0.0003, 4.8024];


%   Simulation parameters
step = 0.1;               %应该是步长
t = 0;                      %时间
dR  = -1;               %后面重新赋值了,相对距离
n = 1;                      %步数
temp = 0;               %和舵偏有关 初始舵偏角
%% 仿真循环
while (t < 500 && height > 0)
%       数据解算
    Vehicle_states(n,:) = [V;alpha;omegaz;height;theta];     %状态量初始化
    Vehicle_del_states(n,:) = Vehicle_states(n,:) - xStable;            %状态变化量初始化
%     Control_del_states(n,:) = [deltat;deltae] - uStable;    %控制变化量初始化
    Control_del_states(n,:) = Klqr * Vehicle_del_states(n,:)';           %尝试控制量变化量直接用公式解算出来,
    Del_states(n,:) = A * Vehicle_del_states(n,:)' + B * Control_del_states(n,:)';
%     Control_states(n,:) = uStable + Klqr * Vehicle_del_states(n,:)';          %控制律更新解算
%     deltae = deltae + unifrnd (-1, 1);       %加入扰动
%     deltat = deltat + unifrnd (-4, 4);
    %   状态更新
    del_V = Del_states(n,1);
    del_alpha = Del_states(n,2);
    del_omegaz = Del_states(n,3);
    del_height = Del_states(n,4);
    del_theta = Del_states(n,5);
    states_old = [V;alpha;omegaz;height;theta];      %导弹参数 速度 弹道倾角 高度 攻角 俯仰角速度
    del = [del_V;del_alpha;del_omegaz;del_height;del_theta];                 %微分量
    states_new = states_old + del * step;           %更新 赋值 old 和del一个行向量一个列向量导致出来是矩阵
    V = states_new(1);
    theta = states_new(5);
    height = states_new(4);
    alpha = states_new(2);
    omegaz = states_new(3);
    %  控制更新
    Control_states(n,:) = Control_del_states(n,:) + uStable';        %实际控制量
%     deltat = Control_states(n,1);
%     deltae = Control_states(n,2);
%     这一部分其实可以忽略,后来发现其实没什么用
%     舵偏角约束
    if deltae <= -30
        deltae = -30;
    end
    if deltae >= 30
        deltae = 30;
    end
%     油门开度约束
    if deltat <= 0
        deltat = 0;
    end
    if deltae >= 100
        deltae = 100;
    end

    %  时间更新
    Time(n) = t;   %时间记录
    t = t + step;  %仿真步长
    n = n + 1;  %计数+1
end
%%  绘图
Drawcon;
绘图子程序,后来习惯放在额外的程序中增加通用性,调试起来也方便,放到同一个文件夹下即可,平时我论文里用图也大都是这种格式,经过了一番摸索,颜值尚可。
figure;
% 速度
subplot(5,1,1);plot(Time,Vehicle_states(:,1),'linewidth',1.5);
%axis([0 100 1400 1600]) ;
grid on;
% title(['速度为 ',num2str(v),' m/s时的响应曲线']);
% title(['Velocity =  ',num2str(V),' m/s'],'Fontname', 'Times New Roman','FontSize',16);
xlabel('$T(s)$','FontName','Times New Roman','FontSize',14,'Interpreter','latex');
ylabel('$V(m/s)$','FontName','Times New Roman','FontSize',14,'Interpreter','latex');
set(gca,'FontName','Times New Roman','FontSize',14,'linewidth',1.5);
% 弹道倾角
subplot(5,1,2);plot(Time,Vehicle_states(:,2),'linewidth',1.5);
%axis([0 100 -1 1]) ;
grid on;
% title('弹道倾角响应曲线');
% title('Pitch angle','Fontname', 'Times New Roman','FontSize',16);
xlabel('$T(s)$','FontName','Times New Roman','FontSize',14,'Interpreter','latex');
ylabel('$\alpha(^\circ)$','FontName','Times New Roman','FontSize',14,'Interpreter','latex');

set(gca,'FontName','Times New Roman','FontSize',14,'linewidth',1.5);
% 高度
subplot(5,1,3);plot(Time,Vehicle_states(:,3),'linewidth',1.5);
%axis([0 100 18500 21500]) ;
grid on;
% title(['高度为 ',num2str(h),' m时的响应曲线']);
% title(['Altitude =  ',num2str(h),' m'],'Fontname', 'Times New Roman','FontSize',16);
xlabel('$T(s)$','FontName','Times New Roman','FontSize',14,'Interpreter','latex');
ylabel('$\omega_z(^\circ/s)$','FontName','Times New Roman','FontSize',14,'Interpreter','latex');

set(gca,'FontName','Times New Roman','FontSize',14,'linewidth',1.5);
% 攻角
subplot(5,1,4);plot(Time,Vehicle_states(:,4),'linewidth',1.5);
%axis([0 100 -1 1]) ;
grid on;
% title('攻角响应曲线');
% title('Angle of attack','Fontname', 'Times New Roman','FontSize',16);
xlabel('$T(s)$','FontName','Times New Roman','FontSize',14,'Interpreter','latex');
ylabel('$h(m)$','FontName','Times New Roman','FontSize',14,'Interpreter','latex');
set(gca,'FontName','Times New Roman','FontSize',14,'linewidth',1.5);
% 俯仰角速度
subplot(5,1,5);plot(Time,Vehicle_states(:,5),'linewidth',1.5);
%axis([0 100 -1 1]) ;
grid on;
% title('俯仰角速度响应曲线');
% title('Pitch rate','Fontname', 'Times New Roman','FontSize',14);
xlabel('$T(s)$','FontName','Times New Roman','FontSize',14,'Interpreter','latex');
ylabel('$\theta(^\circ)$','FontName','Times New Roman','FontSize',14,'Interpreter','latex');
set(gca,'FontName','Times New Roman','FontSize',14,'linewidth',1.5);

figure;
% 速度
subplot(5,1,1);plot(Time,Del_states(:,1),'linewidth',1.5);
%axis([0 100 1400 1600]) ;
grid on;
% title(['速度为 ',num2str(v),' m/s时的响应曲线']);
% title(['Del_Velocity =  ',num2str(V),' m/s'],'Fontname', 'Times New Roman','FontSize',16);
xlabel('$T(s)$','FontName','Times New Roman','FontSize',14,'Interpreter','latex');
ylabel('$\dot{V}(m/s)$','FontName','Times New Roman','FontSize',14,'Interpreter','latex');
set(gca,'FontName','Times New Roman','FontSize',14,'linewidth',1.5);
% 弹道倾角
subplot(5,1,2);plot(Time,Del_states(:,2),'linewidth',1.5);
%axis([0 100 -1 1]) ;
grid on;
% title('弹道倾角响应曲线');
% title('Del_Pitch angle','Fontname', 'Times New Roman','FontSize',16);
xlabel('$T(s)$','FontName','Times New Roman','FontSize',14,'Interpreter','latex');
ylabel('$\dot{\alpha}(^\circ)$','FontName','Times New Roman','FontSize',14,'Interpreter','latex');

set(gca,'FontName','Times New Roman','FontSize',14,'linewidth',1.5);
% 高度
subplot(5,1,3);plot(Time,Del_states(:,3),'linewidth',1.5);
%axis([0 100 18500 21500]) ;
grid on;
% title(['高度为 ',num2str(h),' m时的响应曲线']);
% title(['Del_Altitude =  ',num2str(h),' m'],'Fontname', 'Times New Roman','FontSize',16);
xlabel('$T(s)$','FontName','Times New Roman','FontSize',14,'Interpreter','latex');
ylabel('$\dot{\omega_z}(^\circ/s)$','FontName
