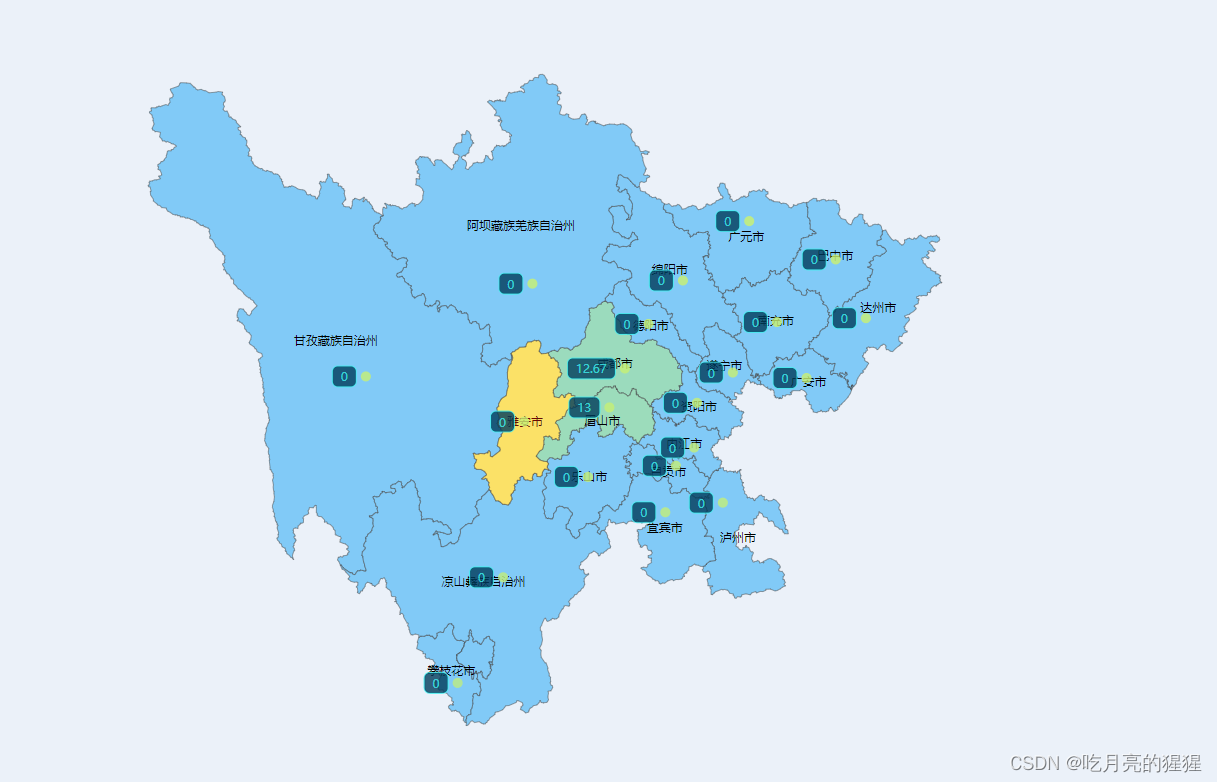
echart在开发地图时,会遇到下钻显示子区域地图数据。比如四川省,下钻到市级成都市,再下钻到区级。下载地址:DataV.GeoAtlas地理小工具系列
1、首先需要下载对应的地图,如果是联网的可以直接下载一个,实现下钻,可自行去搜索或者实现,本文主要为离线地图
2、下载需要的对应地图包后,进入下一步编辑
3、还需要拿到各个地区的经纬度,可以到网上去经纬度地方上去搜然后点击后获取,也可以在我们做的echarts地图上点击获取
最终样式
//获取方法
  myChart.on('click', (params) => {

        this.Show = 0
        // 获取点击的经纬度坐标时使用
        // console.log(myChart.convertFromPixel('geo', [params.event.offsetX, params.event.offsetY]));
        if (params.componentSubType === 'map') {

          try {

            this.chinaJson = require(`@/assets/MapData/${
     params.name}.json`)
            this.ClickName = params.name
            this.cityList.forEach(item =>{

            if(item.xzqhmc === this.ClickName){

              this.getDialogData(item.xzqhszDm)
              this.Restcenter()
            }
            })
          } catch (r) {

            // this.$message({

            //   message: '无本地资源',
            //   type: 'warning'
            // });
          }

        }
      })
```javascript
//放echarts的地方
<div id="main" :style="{ height: '100%', width: '100%', }" ref="myEchart"></div>
``
//引入 在scrit代码块内引入
import * as echarts from 'echarts';
//在data内引入下载的地图图片
ClickName: '四川', //空代表还没有点击城市 初始进入时的地图显示
chinaJson: require("@/assets/MapData/四川省.json"),
//echarts的初始化
init() {

      if (this.myChart.id !== undefined) {

        this.myChart.dispose(); //销毁  这是因为多次点击会出现渲染的问题,需要先销毁再渲染
      }
      let myChart = echarts.init(document.getElementById('main'), null, {
    renderer: 'svg' });//这里是让地图的清晰度更高
      echarts.registerMap('sichuan', this.chinaJson);
      this.myChart = myChart
      //点击时间监听
      myChart.on('click', (params) => {

        // 这个是项目用到的,可以根据需要保留this.Show = 0
        // 获取点击的经纬度坐标时使用
        // console.log(myChart.convertFromPixel('geo', [params.event.offsetX, params.event.offsetY]));
        if (params.componentSubType === 'map') {

          try {

            this.chinaJson = require(`@/assets/MapData/${
     params.name}.json`)
            this.ClickName = params.name
            this.cityList.forEach(item =>{

            if(item.xzqhmc === this.ClickName){

              this.getDialogData(item.xzqhszDm)
              this.Restcenter()
            }
            })
          } catch (r) {

            // this.$message({

            //   message: '无本地资源',
            //   type: 'warning'
            // });
          }

        }
      })
      window.addEventListener('resize', function () {

        myChart.resize();
      });
      echarts.registerMap("js", this.chinaJson);
      // 柱状图左边数量显示
      let scatterData = this.mapData.map((item) => {

        return [
          this.center[item.name][0],
          this.center[item.name][1],
        ];
      });
      let option =
        {

          backgroundColor: "rgba(0,0,0,0)",
          tooltip: {

            trigger: 'item',
            show: true,
            enterable: true,
            textStyle: {

              fontSize: 20,
              color: '#fff'
            },
            backgroundColor: 'rgba(0,0,0,0.5)',
            formatter: function (item) {

              let tipHtml = "";
              //提示内容
              tipHtml = item
              return tipHtml;
            },
          },
          visualMap: {

            min: 0,
            max:100,
            text: ['高', '低'],
            realtime: false,
            calculable: true,
            inRange: {

              color: ['lightskyblue', 'yellow', 'orangered']
            }
          },
          // 地图图层样式
          geo: [
            {

              map: "js",
              aspectScale: 0.9,
              // roam: false, //是否允许缩放
              roam: true,
              zoom: 1, //默认显示级别
              label: {
    show: true },
              emphasis: {

                label: {
    show: true },
                textStyle: {

                  color: '#444',
                  fontSize: 8
                },
              },
              zlevel: 3,
            },
          ],
          series: [
            // 颜色图层
          {

            type: "map",
              coordinateSystem: "geo",
              geoIndex: 0,
              zlevel: 5,
              label: {

                show: true,
              },
              map: 'china', // 自定义扩展图表类型
              // normal: {label: {show: true}},
              emphasis: {

                label: {
    show: true },
                textStyle: {

                  color: '#444',
                  fontSize: 8
                }
              },
              data: this.mapData,
            },
            // 柱形左边数量显示
            {

              type: "scatter",
              coordinateSystem: "geo",
              geoIndex: 0,
              zlevel: 5,
              label: {

                show: !0,
                position: "left",
                formatter: (params) => this.mapData[params.dataIndex].value,
                padding: [4, 8],
                backgroundColor: "#003F5E", //数字显示框颜色
                borderRadius: 5,
                borderColor: "#67F0EF",
                borderWidth: 1,
                color: "#67F0EF",
              },
              silent: true,
              data: scatterData,
            },
          ],
        }
      myChart.setOption(option, true);
    },
完整的页面代码,可以直接使用,注意引入
<template>
  <div class="MapEcharts">
    <el-button size="medium" v-if="this.history.length === 0" @click="$router.back()" class="sucessbutton" type="text">
          <SvgIcon icon-name="rollback" class="popoverIcon"></SvgIcon>
          返回
        </el-button>
    <el-button v-if="this.history.length > 0" type="text" class="sucessbutton"
      @click="datas()">
      <SvgIcon icon-name="rollback" class="popoverIcon"></SvgIcon>
      返回上一级</el-button>
    <div id="main" :style="{ height: '100%', width: '100%', }" ref="myEchart"></div>
  </div>
</template>

<script>

import * as echarts from 'echarts';
import SvgIcon from '@/components/public/SvgIcon' //图标可以去掉这个
import {
   mixins} from '@/mixins/mixins' //这是其他区域的中心点放在后面了

export default {

  name: 'MapData',
  data() {

    return {

      historyOld:'',
      Show:0,
