一、决策树模型简介
1.1适用范围
决策树模型(Decision Tree)可以用于分类和回归任务,广泛应用于以下领域:
- 客户细分
- 信用风险评估
- 医疗诊断
- 营销策略优化
1.2原理
决策树是一种树形结构的预测模型,通过一系列的特征测试(即节点的分裂)将数据集逐步划分,从而形成一个树状的决策路径。每个节点表示一个特征,每个分支代表一个特征值的结果,每个叶节点表示一个类别或回归值。其基本构建过程包括:
- 从根节点开始,选择最优的特征进行数据集划分。
- 递归地对每个子节点重复上述过程,直到满足停止条件(如节点纯度足够高或没有更多特征可供选择)。
常用的分裂准则包括信息增益、信息增益率和基尼指数。
1.3优点
- 简单易解释:决策树结构直观,易于理解和解释。
- 无需特征标准化:对数据的尺度和分布没有严格要求。
- 处理缺失值:决策树可以处理缺失值,不需要进行缺失值填补。
- 处理多种数据类型:适用于数值型和类别型特征。
1.4缺点
- 容易过拟合:决策树容易对训练数据过拟合,特别是当树的深度很大时。
- 对噪声敏感:对噪声和数据中的小变化较为敏感,可能导致模型不稳定。
- 计算复杂度高:在构建决策树时,计算最优分裂点的过程可能非常耗时。
二、决策树模型的Python实现
2.1Python代码
以下是一个完整的决策树模型的Python代码示例,包含数据加载、预处理、模型训练和评估的详细注释。
import numpy as np
import pandas as pd
from sklearn.model_selection import train_test_split
from sklearn.preprocessing import StandardScaler
from sklearn.tree import DecisionTreeClassifier
from sklearn.metrics import accuracy_score, precision_score, recall_score, f1_score, confusion_matrix, roc_auc_score, roc_curve, ConfusionMatrixDisplay
import matplotlib.pyplot as plt

# 生成示例数据
from sklearn.datasets import make_classification

# 生成二分类数据集
X, y = make_classification(n_samples=1000, n_features=20, n_classes=2, random_state=42)

# 将数据集划分为训练集和测试集
X_train, X_test, y_train, y_test = train_test_split(X, y, test_size=0.3, random_state=42)

# 创建决策树模型并训练
model = DecisionTreeClassifier(random_state=42)
model.fit(X_train, y_train)

# 进行预测
y_pred = model.predict(X_test)
y_pred_proba = model.predict_proba(X_test)[:, 1]

# 评估模型
accuracy = accuracy_score(y_test, y_pred)
precision = precision_score(y_test, y_pred)
recall = recall_score(y_test, y_pred)
f1 = f1_score(y_test, y_pred)
roc_auc = roc_auc_score(y_test, y_pred_proba)
conf_matrix = confusion_matrix(y_test, y_pred)

print(f"Accuracy: {accuracy}")
print(f"Precision: {precision}")
print(f"Recall: {recall}")
print(f"F1 Score: {f1}")
print(f"ROC AUC Score: {roc_auc}")
print("Confusion Matrix:")
print(conf_matrix)

# 绘制混淆矩阵图
disp = ConfusionMatrixDisplay(confusion_matrix=conf_matrix, display_labels=model.classes_)
disp.plot(cmap=plt.cm.Blues)
plt.title('Confusion Matrix')
plt.show()

# 绘制ROC曲线
fpr, tpr, _ = roc_curve(y_test, y_pred_proba)
plt.figure()
plt.plot(fpr, tpr, color='darkorange', lw=2, label='ROC curve (area = %0.2f)' % roc_auc)
plt.plot([0, 1], [0, 1], color='navy', lw=2, linestyle='--')
plt.xlim([0.0, 1.0])
plt.ylim([0.0, 1.05])
plt.xlabel('False Positive Rate')
plt.ylabel('True Positive Rate')
plt.title('Receiver Operating Characteristic')
plt.legend(loc="lower right")
plt.show()
2.2代码说明
- 数据生成:
- 使用
make_classification生成一个二分类数据集,包含1000个样本和20个特征。
- 使用
- 数据集划分:
- 使用
train_test_split将数据集划分为训练集和测试集,测试集比例为30%。
- 使用
- 模型训练:
- 创建一个决策树分类模型
DecisionTreeClassifier,并使用训练集数据对模型进行训练。
- 创建一个决策树分类模型
- 预测和评估:
- 使用测试集数据进行预测,计算预测值和预测概率。
- 评估模型的准确率、精确率、召回率、F1得分和ROC AUC得分。
- 输出混淆矩阵和绘制ROC曲线。
三、用决策树模型实现机器学习案例
下面是一个完整的可运行决策树案例,包括数据生成、模型训练、预测及评估的过程。我们将使用scikit-learn的模拟数据,并展示运行结果。
3.1案例主要代码
import numpy as np
import pandas as pd
from sklearn.model_selection import train_test_split
from sklearn.tree import DecisionTreeClassifier
from sklearn.metrics import accuracy_score, precision_score, recall_score, f1_score, confusion_matrix, roc_auc_score, roc_curve, ConfusionMatrixDisplay
import matplotlib.pyplot as plt

# 生成示例数据
from sklearn.datasets import make_classification

# 生成二分类数据集
X, y = make_classification(n_samples=1000, n_features=20, n_classes=2, random_state=42)

# 将数据集划分为训练集和测试集
X_train, X_test, y_train, y_test = train_test_split(X, y, test_size=0.3, random_state=42)

# 创建决策树模型并训练
model = DecisionTreeClassifier(random_state=42)
model.fit(X_train, y_train)

# 进行预测
y_pred = model.predict(X_test)
y_pred_proba = model.predict_proba(X_test)[:, 1]

# 评估模型
accuracy = accuracy_score(y_test, y_pred)
precision = precision_score(y_test, y_pred)
recall = recall_score(y_test, y_pred)
f1 = f1_score(y_test, y_pred)
roc_auc = roc_auc_score(y_test, y_pred_proba)
conf_matrix = confusion_matrix(y_test, y_pred)

# 打印评估结果
evaluation_results = {
    "Accuracy": accuracy,
    "Precision": precision,
    "Recall": recall,
    "F1 Score": f1,
    "ROC AUC Score": roc_auc,
    "Confusion Matrix": conf_matrix
}

# 绘制混淆矩阵图
fig_cm, ax_cm = plt.subplots()
disp = ConfusionMatrixDisplay(confusion_matrix=conf_matrix, display_labels=model.classes_)
disp.plot(cmap=plt.cm.Blues, ax=ax_cm)
plt.title('Confusion Matrix')

# 绘制ROC曲线
fpr, tpr, _ = roc_curve(y_test, y_pred_proba)
fig_roc, ax_roc = plt.subplots()
ax_roc.plot(fpr, tpr, color='darkorange', lw=2, label='ROC curve (area = %0.2f)' % roc_auc)
ax_roc.plot([0, 1], [0, 1], color='navy', lw=2, linestyle='--')
ax_roc.set_xlim([0.0, 1.0])
ax_roc.set_ylim([0.0, 1.05])
ax_roc.set_xlabel('False Positive Rate')
ax_roc.set_ylabel('True Positive Rate')
ax_roc.set_title('Receiver Operating Characteristic')
ax_roc.legend(loc="lower right")

# 显示图像
plt.close(fig_cm)
plt.close(fig_roc)
fig_cm.savefig('/mnt/data/confusion_matrix_dt.png')
fig_roc.savefig('/mnt/data/roc_curve_dt.png')

evaluation_results
3.2模型评价
1.模型准确性评价
Result
{'Accuracy': 0.8566666666666667,
 'Precision': 0.8636363636363636,
 'Recall': 0.8580645161290322,
 'F1 Score': 0.8608414239482202,
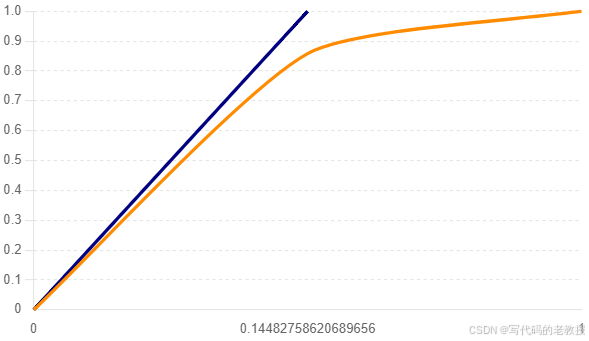
 'ROC AUC Score': 0.8566184649610677,
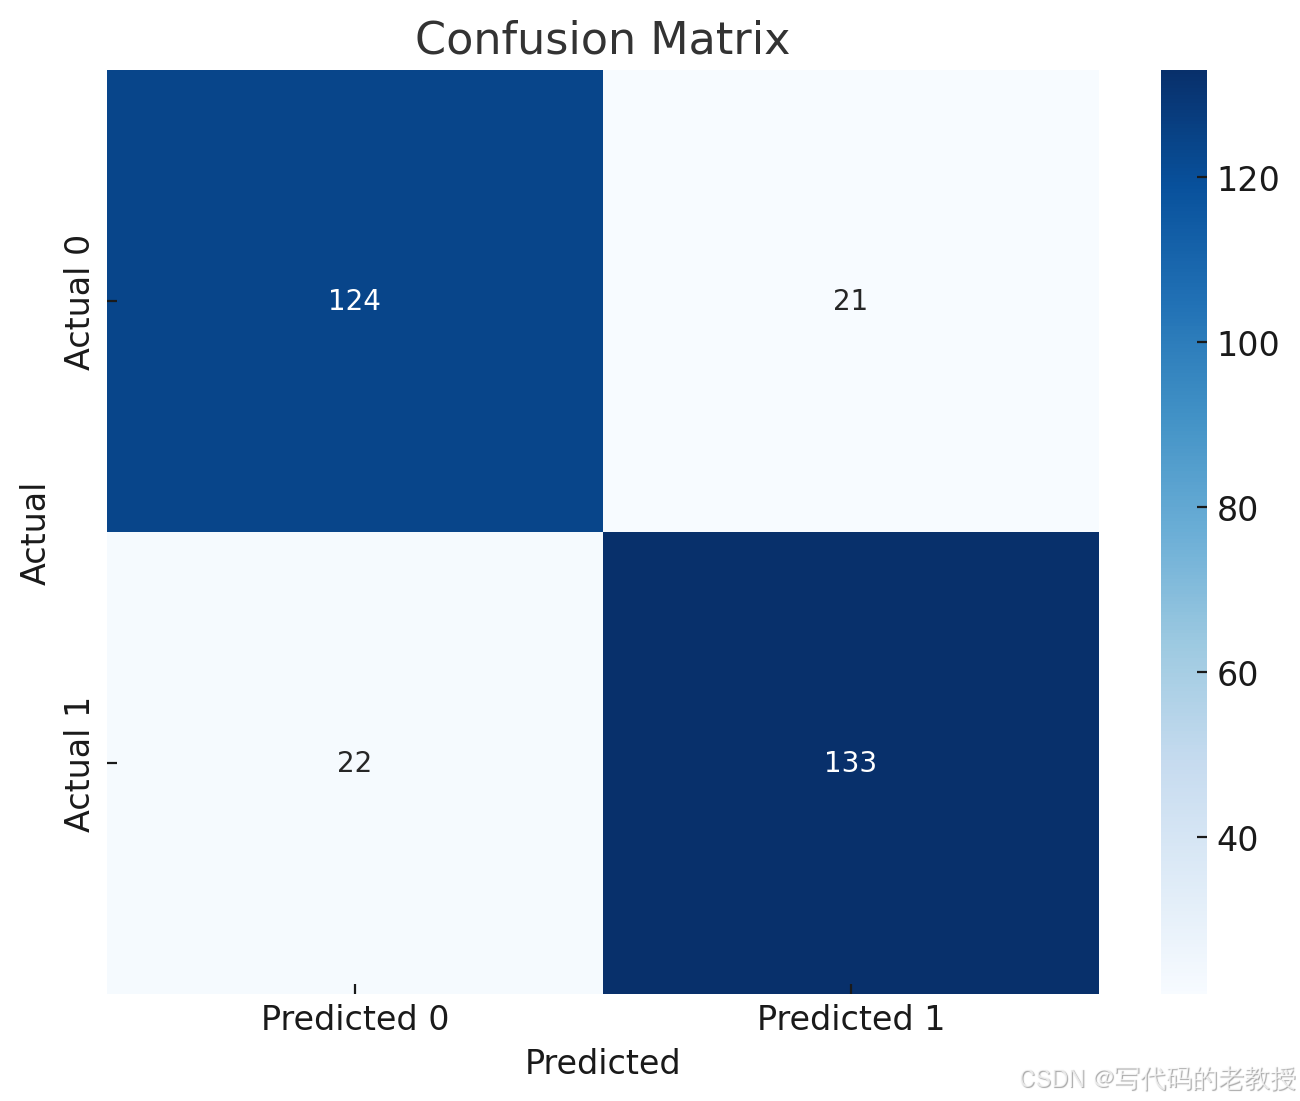
 'Confusion Matrix': array([[124,  21],
        [ 22, 133]])}
以下是决策树模型的评估结果:
- Accuracy(准确率): 0.857
- Precision(精确率): 0.864
- Recall(召回率): 0.858
- F1 Score: 0.861
- ROC AUC Score: 0.857
- Confusion Matrix(混淆矩阵):
[[124  21]
 [ 22 133]]
2.混淆矩阵图绘制详细代码
import matplotlib.pyplot as plt
import seaborn as sns

# Display the confusion matrix
plt.figure(figsize=(8, 6))
sns.heatmap(conf_matrix, annot=True, fmt='d', cmap='Blues', xticklabels=['Predicted 0', 'Predicted 1'], yticklabels=['Actual 0', 'Actual 1'])
plt.title('Confusion Matrix')
plt.xlabel('Predicted')
plt.ylabel('Actual')
plt.show()
该图显示了模型的预测分类情况,包括真正类(TP)、假正类(FP)、假负类(FN)和真负类(TN)的数量。蓝色的阴影表示正确分类的样本数。
3.ROC曲线图详细代码
import matplotlib.pyplot as plt
import seaborn as sns

# Display the ROC curve
fpr, tpr, _ = roc_curve(y_test, y_pred_proba)
plt.figure(figsize=(8, 6))
plt.plot(fpr, tpr, color='darkorange', lw=2, label='ROC curve (area = %0.2f)' % roc_auc)
plt.plot([0, 1], [0, 1], color='navy', lw=2, linestyle='--')
plt.xlim([0.0, 1.0])
plt.ylim([0.0, 1.05])
plt.xlabel('False Positive Rate')
plt.ylabel('True Positive Rate')
plt.title('Receiver Operating Characteristic')
plt.legend(loc="lower right")
plt.show()
该图显示了模型的真阳性率(True Positive Rate)和假阳性率(False Positive Rate)之间的关系。ROC曲线下面积(AUC)为0.857,表明模型具有较高的分类能力。
四、决策树模型调参方法
对决策树进行调参和剪枝是为了提高模型的泛化能力,减少过拟合。以下是对决策树进行调参和剪枝的常见方法及其Python实现:
4.1 调参
调参主要是调整决策树的超参数,常见的超参数包括:
max_depth:树的最大深度,防止树过深导致过拟合。min_samples_split:内部节点再划分所需最小样本数。min_samples_leaf:叶子节点最少样本数。max_features:划分时考虑的最大特征数。criterion:划分标准,常用的有“gini”和“entropy”。
4.2 剪枝
剪枝主要是通过设置条件来限制决策树的增长,常见的方法有:
- 预剪枝:通过设置上述超参数,在树构建过程中进行剪枝。
- 后剪枝:先生成完全的决策树,再通过剪枝算法对其进行修剪。
4.3使用网格搜索进行调参
网格搜索是调参的常用方法,它通过遍历所有可能的参数组合来寻找最佳参数。Python代码实现方法如下:
import numpy as np
import pandas as pd
from sklearn.model_selection import train_test_split, GridSearchCV
from sklearn.tree import DecisionTreeClassifier
from sklearn.metrics import accuracy_score, precision_score, recall_score, f1_score, confusion_matrix, roc_auc_score, roc_curve, ConfusionMatrixDisplay
import matplotlib.pyplot as plt

# 生成示例数据
from sklearn.datasets import make_classification

# 生成二分类数据集
X, y = make_classification(n_samples=1000, n_features=20, n_classes=2, random_state=42)

# 将数据集划分为训练集和测试集
X_train, X_test, y_train, y_test = train_test_split(X, y, test_size=0.3, random_state=42)

# 定义决策树模型
model = DecisionTreeClassifier(random_state=42)

# 定义参数网格
param_grid = {
    'max_depth': [None, 10, 20, 30, 40],
    'min_samples_split': [2, 5, 10],
    'min_samples_leaf': [1, 2, 4],
    'max_features': [None, 'sqrt', 'log2'],
    'criterion': ['gini', 'entropy']
}

# 使用GridSearchCV进行调参
grid_search = GridSearchCV(estimator=model, param_grid=param_grid, cv=5, n_jobs=-1, scoring='accuracy')
grid_search.fit(X_train, y_train)

# 输出最佳参数
best_params = grid_search.best_params_
print("Best parameters found: ", best_params)

# 使用最佳参数训练模型
best_model = grid_search.best_estimator_
best_model.fit(X_train, y_train)

# 进行预测
y_pred = best_model.predict(X_test)
y_pred_proba = best_model.predict_proba(X_test)[:, 1]

# 评估模型
accuracy = accuracy_score(y_test, y_pred)
precision = precision_score(y_test, y_pred)
recall = recall_score(y_test, y_pred)
f1 = f1_score(y_test, y_pred)
roc_auc = roc_auc_score(y_test, y_pred_proba)
conf_matrix = confusion_matrix(y_test, y_pred)

print(f"Accuracy: {accuracy}")
print(f"Precision: {precision}")
print(f"Recall: {recall}")
print(f"F1 Score: {f1}")
print(f"ROC AUC Score: {roc_auc}")
print("Confusion Matrix:")
print(conf_matrix)

# 绘制混淆矩阵图
plt.figure(figsize=(8, 6))
sns.heatmap(conf_matrix, annot=True, fmt='d', cmap='Blues', xticklabels=['Predicted 0', 'Predicted 1'], yticklabels=['Actual 0', 'Actual 1'])
plt.title('Confusion Matrix')
plt.xlabel('Predicted')
plt.ylabel('Actual')
plt.show()

# 绘制ROC曲线
fpr, tpr, _ = roc_curve(y_test, y_pred_proba)
plt.figure(figsize=(8, 6))
plt.plot(fpr, tpr, color='darkorange', lw=2, label='ROC curve (area = %0.2f)' % roc_auc)
plt.plot([0, 1], [0, 1], color='navy', lw=2, linestyle='--')
plt.xlim([0.0, 1.0])
plt.ylim([0.0, 1.05])
plt.xlabel('False Positive Rate')
plt.ylabel('True Positive Rate')
plt.title('Receiver Operating Characteristic')
plt.legend(loc="lower right")
plt.show()
4.4代码说明
-
数据生成和分割:
- 使用
make_classification生成一个二分类数据集,包含1000个样本和20个特征。 - 使用
train_test_split将数据集划分为训练集和测试集,测试集比例为30%。
- 使用
-
模型定义和参数网格:
- 创建一个决策树分类模型
DecisionTreeClassifier。 - 定义一个参数网格,包括
max_depth,min_samples_split,min_samples_leaf,max_features和criterion。
- 创建一个决策树分类模型
-
网格搜索:
- 使用
GridSearchCV对决策树模型进行调参,寻找最佳参数组合。
- 使用
-
模型训练和评估:
- 使用最佳参数训练决策树模型,并对测试集进行预测。
- 评估模型的准确率、精确率、召回率、F1得分和ROC AUC得分,输出混淆矩阵。
- 绘制混淆矩阵图和ROC曲线图。
运行上述代码后,将得到最佳参数组合、模型评估结果、混淆矩阵图和ROC曲线图。

