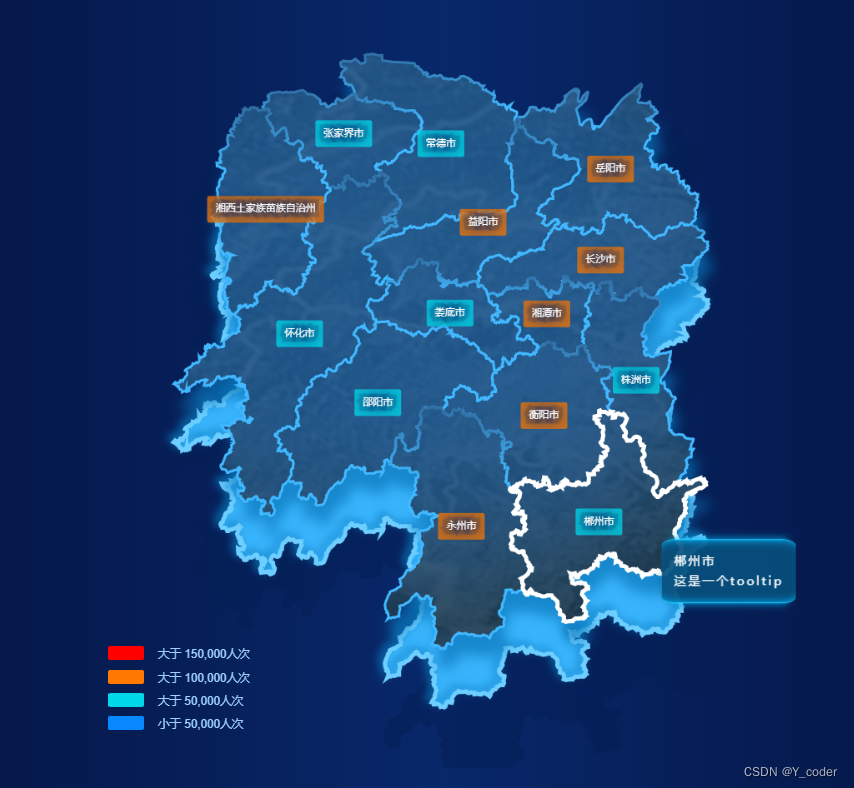
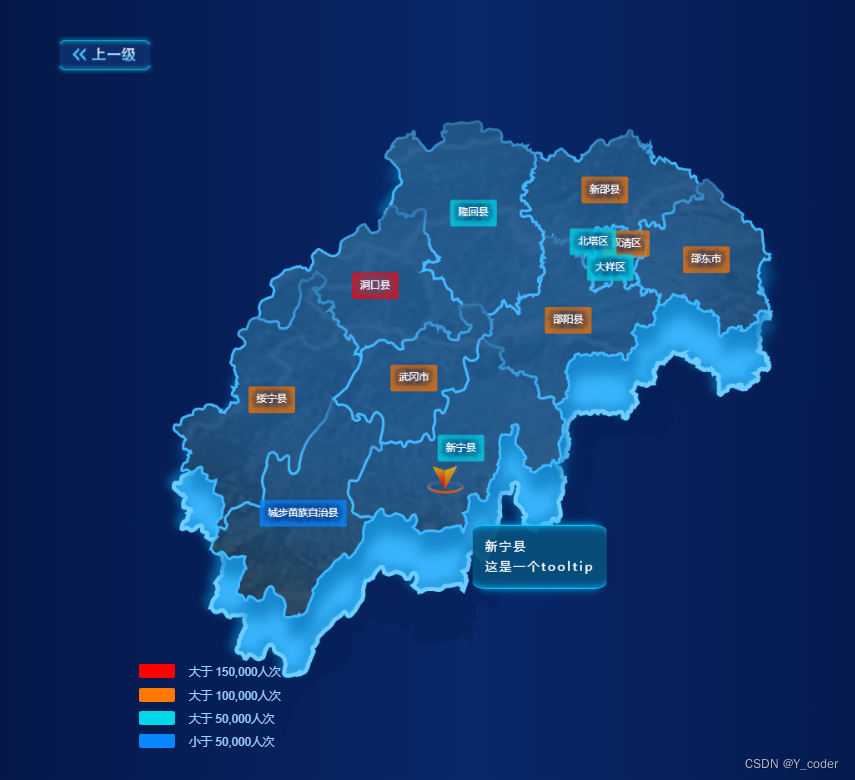
最终效果
标题环境搭建
这里忽略创建vue项目的操作过程,请自行搭建 vue2 项目、less 环境
安装下载 echarts
这里我们选择npm下载
npm install echarts
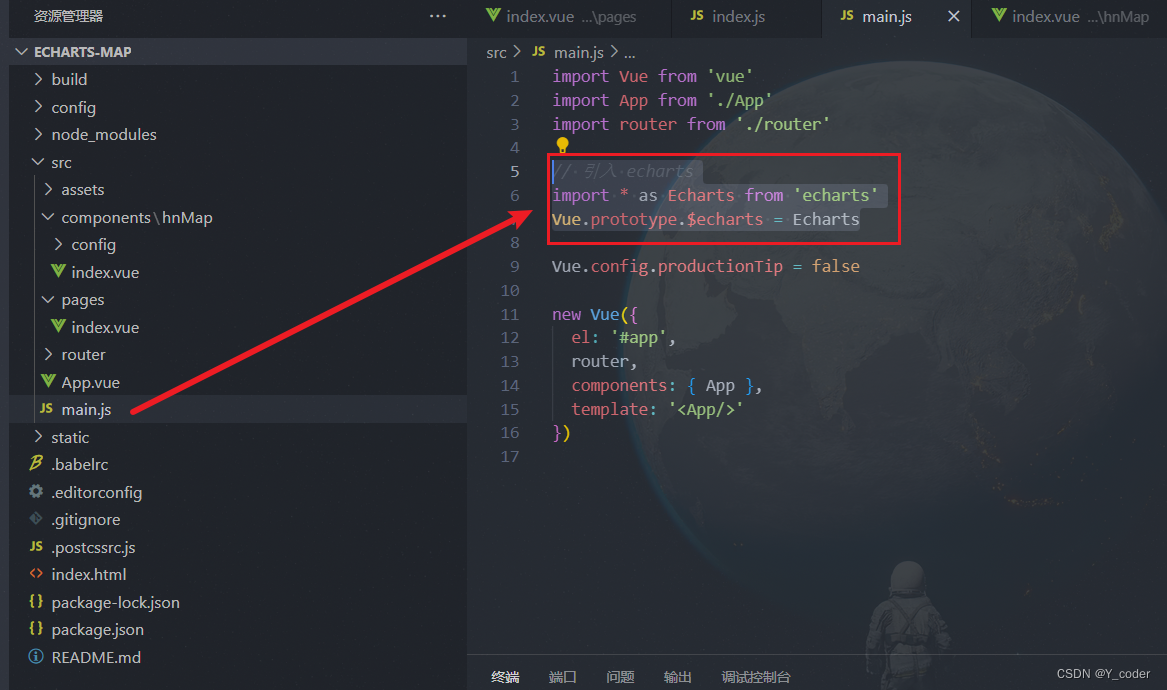
安装成功后,在 main.js 中把echarts配置到this上
// 引入 echarts
import * as Echarts from 'echarts'
Vue.prototype.$echarts = Echarts
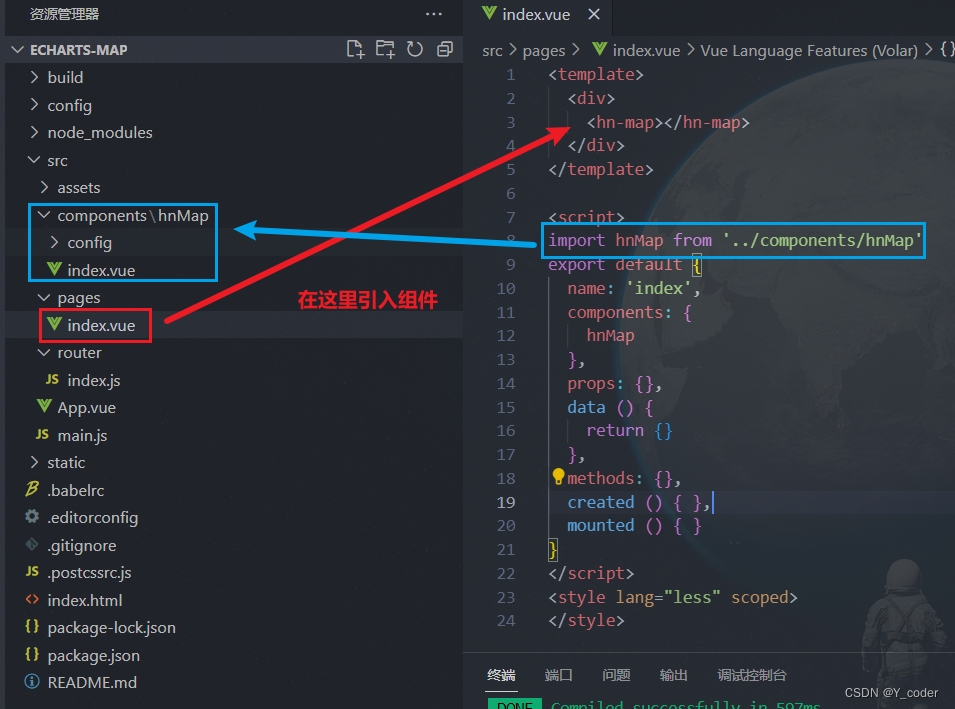
这里我建立了一个地图的组件,放在hnMap中
静态地图核心代码
获取地图渲染json文件
这里我是通过下述的网址下载需要的地图 json 文件到本地 mapJson 目录下
地图数据下载地址:地图Json数据下载
另外,因为我这里需要下层的阴影(蓝色阴影部分不需要地图内部的轮廓所以需要两种地图格式)
// 获取地图渲染json文件
async registerMapJson () {
  try {
  	// 上层实际的地图轮廓
    const mapFullResources = require(`./mapJson/${this.mapAreaCode}_full.json`)
    // 下层阴影轮廓(不带内部轮廓信息)
    const mapResources = require(`./mapJson/${this.mapAreaCode}.json`)
    // 注册 map
    this.$echarts.registerMap("mapFullJson", mapFullResources);
    this.$echarts.registerMap("mapJson", mapResources);
  } catch (error) {
    throw new Error('地图加载失败,请刷新重试');
  }
},
地图样式核心代码
地图的样式就是通过下述的 option 对象配置的
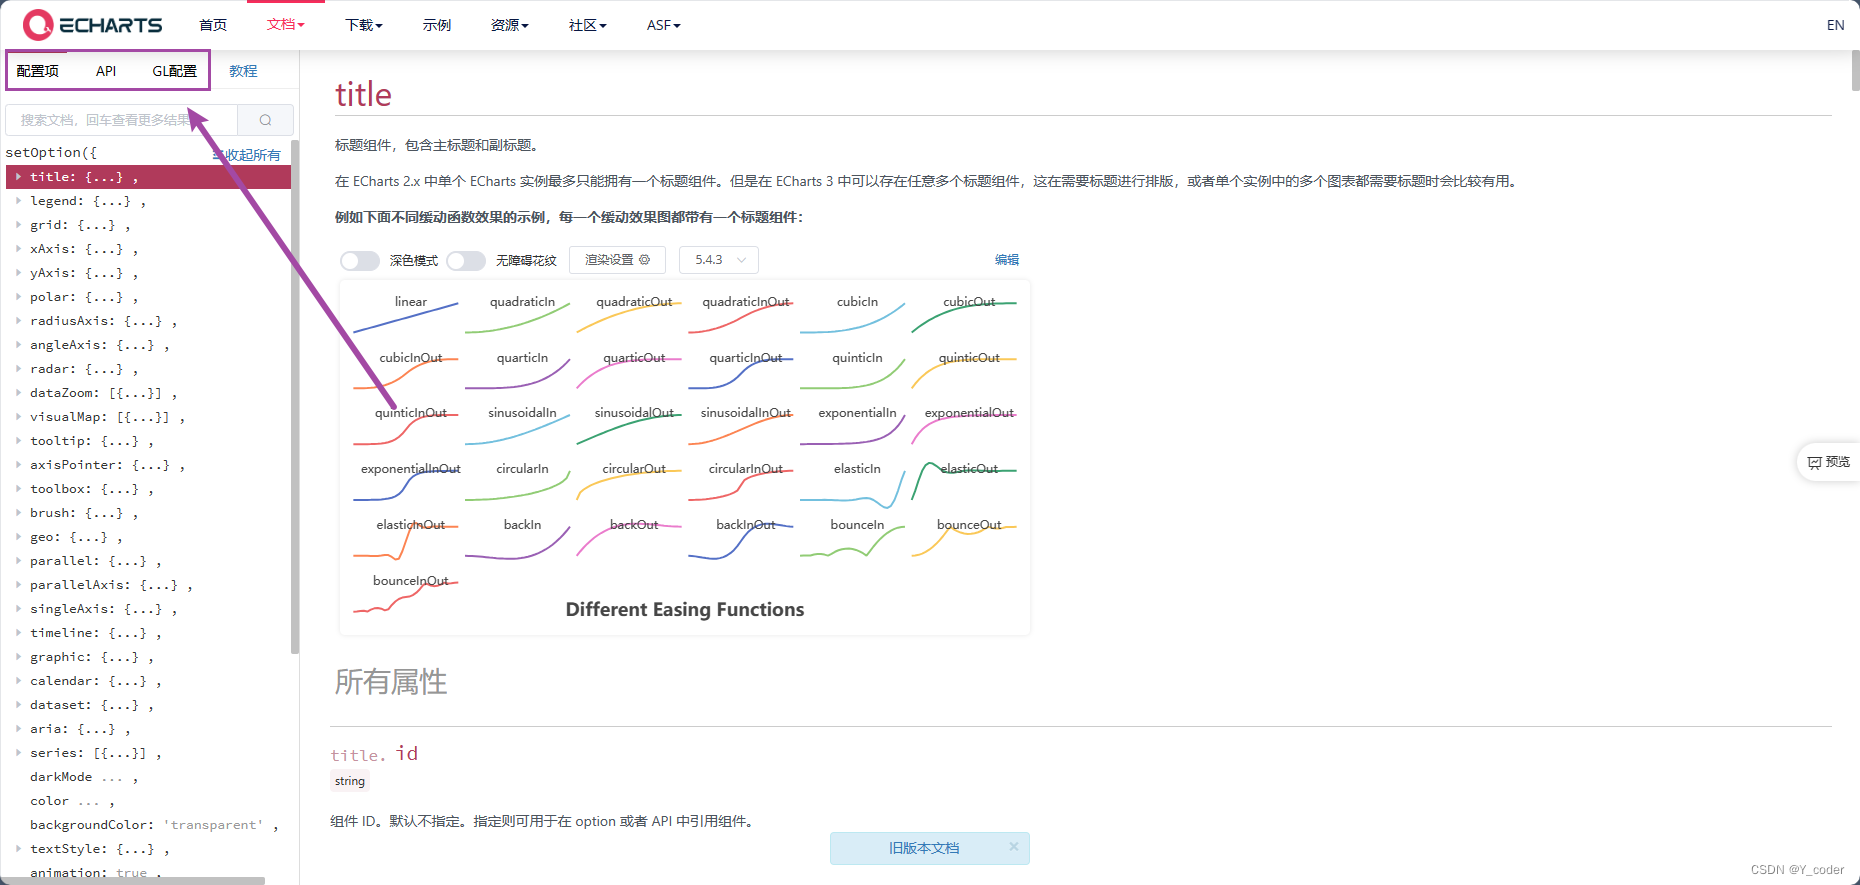
更详细的文档可见官网echarts官网
主要是配置项、API、GL配置这三项,一般都可以找到详细的解释
// 设置初始化的地图样式
async setInitOption () {
  let option = {
    tooltip: {
      trigger: 'item',
      formatter: (params) => {
        return `
          <div style="
            line-height: 24px;
            padding: 13px 15px;
            border-top: 1px solid #16D0FE;
            border-bottom: 1px solid #16D0FE;
            background-color: rgba(6,79,124,0.92);
            box-shadow: inset 0 -10px 10px -10px #00B5FF, 0 10px 10px -10px #00B5FF,inset 0 10px 10px -10px #00B5FF, 0 -10px 10px -10px #00B5FF;
            letter-spacing: 0.2em;
            border-radius: 10%;
          ">
            <div>${params.name}</div>
            <div>这是一个tooltip</div>
          </div>
        `;
      },
      textStyle: {
        color: '#ffffff',
        fontSize: 14,
      },
      padding: 0,
      borderRadius: 20,
      borderColor: 'transparent',
      backgroundColor: 'transparent'
    },
    // 地图渲染层级通过 z 属性来控制
    geo: [
      { // 整个地图最外部轮廓的外阴影
        map: 'mapJson',
        z: 3,
        roam: false,
        aspectScale: 0.9, //长宽比
        zoom: 1.1,
        tooltip: {
          show: false,
        },
        label: {
          show: false, // 是否显示对应地名
        },
        layoutCenter: ['50%', '50%'],
        // 如果宽高比大于 1 则宽度为 100,如果小于 1 则高度为 100,保证了不超过 100x100 的区域
        layoutSize: 650,
        emphasis: { // 对应的鼠标悬浮效果
          disabled: true,
        },
        select: {
          disabled: true
        },
        itemStyle: {
          normal: {
            areaColor: '#2f9fe7',
            shadowColor: 'rgba(9, 117, 185,0.7)',
            shadowBlur: 15,
            borderWidth: 0,
            shadowOffsetY: 25,
            shadowOffsetX: 5,
          },
          emphasis: {
            disabled: true, //是否可以被选中
          },
        },
      }, { // 中间部分的蓝色阴影-主体部分
        map: 'mapJson', // 表示中国地图
        roam: false,
        z: 2,
        aspectScale: 0.9, //长宽比
        zoom: 1.1,
        tooltip: {
          show: false,
        },
        label: {
          show: false, // 是否显示对应地名
        },
        layoutCenter: ['50%', '57%'],
        // 如果宽高比大于 1 则宽度为 100,如果小于 1 则高度为 100,保证了不超过 100x100 的区域
        layoutSize: 650,
        emphasis: { // 对应的鼠标悬浮效果
          disabled: true,
        },
        select: {
          disabled: true
        },
        itemStyle: {
          normal: {
            areaColor: '#38b4fc',
            borderColor: '#6dceff',
            borderWidth: 5,
            // 内部阴影
            shadowColor: 'rgba(9, 117, 185,0.7)',
            shadowBlur: 10,
            shadowOffsetY: -5,
            shadowOffsetX: -5,
          },
          emphasis: {
            disabled: true, //是否可以被选中
          },
        },
      }, { // 最下层阴影
        map: 'mapJson', // 表示中国地图
        roam: false,
        z: 1,
        aspectScale: 0.9, //长宽比
        zoom: 1.3,
        tooltip: {
          show: false,
        },
        label: {
          show: false, // 是否显示对应地名
        },
        layoutCenter: ['51%', '60%'],
        // 如果宽高比大于 1 则宽度为 650,如果小于 1 则高度为 650,保证了不超过 650x650 的区域
        layoutSize: 650,
        emphasis: { // 对应的鼠标悬浮效果
          disabled: true,
        },
        select: {
          disabled: true
        },
        itemStyle: {
          normal: {
            areaColor: 'rgba(4, 29, 83,0.5)',
            borderWidth: 0,
          },
          emphasis: {
            disabled: true, //是否可以被选中
          },
        },
      }
    ],
    series: [
      {
        type: 'map',
        map: 'mapFullJson',
        // data: this.mapData,
        zoom: 1.1,
        z: 4,
        layoutCenter: ['50%', '50%'],
        // 如果宽高比大于 1 则宽度为 100,如果小于 1 则高度为 100,保证了不超过 100x100 的区域
        layoutSize: 650,
        aspectScale: 0.9, //长宽比
        roam: false,
        label: {
          show: true,
          fontSize: 14,
          lineHeight: 16,
          padding: 0,
          borderRadius: 5,
          formatter: function (params) {
            // 这里模拟data里的数据
            var min = 40000;
            var max = 160000;
            const value = Math.floor(Math.random() * (max - min + 1)) + min;
            const areaname = params.name
            if (value >= 150000) {
              return `{red|${areaname}}`
            } else if (value >= 100000) {
              return `{orange|${areaname}}`
            } else if (value >= 50000) {
              return `{green|${areaname}}`
            } else {
              return `{blue|${areaname}}`
            }
          },
          rich: {
            // 四种标签样式
            red: {
              color: "#fff",
              padding: 10,
              borderRadius: 3,
              textBorderWidth: 10,
              textShadowBlur: 15,
              textBorderColor: 'rgba(41, 102, 155, 0.2)',
              textShadowColor: 'rgba(41, 102, 155, 1)',
              backgroundColor: 'rgba(255, 0, 0, 0.7)',
            },
            orange: {
              color: "#fff",
              padding: 10,
              borderRadius: 3,
              textBorderColor: 'rgba(3, 40, 103, 0.2)',
              textBorderWidth: 10,
              textShadowColor: 'rgba(3, 40, 103, 1)',
              textShadowBlur: 15,
              backgroundColor: 'rgba(236, 116, 9, 0.8)',
            },
            green: {
              color: "#fff",
              padding: 10,
              borderRadius: 3,
              textBorderColor: 'rgba(3, 40, 103, 0.2)',
              textBorderWidth: 10,
              textShadowColor: 'rgba(3, 40, 103, 1)',
              textShadowBlur: 15,
              backgroundColor: 'rgba(0, 215, 233, 0.8)',
            },
            blue: {
              color: "#fff",
              padding: 10,
              textBorderColor: 'rgba(3, 40, 103, 0.2)',
              textBorderWidth: 10,
              textShadowColor: 'rgba(3, 40, 103, 1)',
              textShadowBlur: 15,
              backgroundColor: 'rgba(8, 136, 255, 0.8)',
            },
          },
        },
        select: {
          disabled: true
        },
        itemStyle: {
          normal: {
            borderColor: {
              type: 'linear',
              x: 0,
              y: 0,
              x2: 0,
              y2: 1,
              colorStops: [{
                offset: 0, color: '#306ca1'
              }, {
                offset: 0.3, color: '#41b8ff'
              }],
            },
            borderWidth: 3,
            areaColor: {
              image: wlImg
            }
          },
          emphasis: {
            areaColor: {
              image: wlImg
            },
            borderColor: '#fff',
            borderWidth: 5,
          },
        },
      },
    ],
    animation: false,
  }
  this.option = option
  return option
},
初始化,渲染地图
// 初始化,渲染地图
renderMap () {
  if (this.myChart) {
    this.myChart.dispose(); // 销毁之前的 echarts 实例
    this.myChart.off('click'); // 解绑 click 事件监听器
  }
  // 保存新的 echarts 实例
  const myChart = this.$echarts.init(document.getElementById("mapEchart"));
  this.myChart = myChart
  myChart.clear()
  myChart.setOption(this.option);
},
根据地区名设置当前位置的定位图标
其实就是使用 scatter 图例,把 symbol 设置为本地的图片就好了
// 定位图标
const markImg = require('./images/mark.png')
setMarkSymbol (selectedAreaName) {
  this.option.series[1] = {
    type: 'scatter',
    coordinateSystem: 'geo',
    z: 12,
    data: [ // 描点数据
      {
        name: selectedAreaName,
        value: mapAddr[selectedAreaName],
      }
    ],
    symbol: `image://${markImg}`,
    symbolSize: [44, 33],
  }
  this.myChart.setOption(this.option);
},
单击下钻事件
其实地图下钻就只需要重新获取点击地址的地图 Json 文件,然后再重新渲染 echarts 即可
// 单击下钻事件
clickMapItem (e) {
  const selectedAreaName = e.name
  const selectedAreaCode = areaCode[selectedAreaName]
  if (selectedAreaCode) {
    // 点击的是市一级的话,下钻重新渲染地图
    this.mapAreaCode = selectedAreaCode
    this.initMapChart()
  } else {
    // 区县一级的话显示定位图标
    this.setMarkSymbol(selectedAreaName)
  }
},
返回省级地图
这里的返回我是直接偷懒做的返回省级地图,当然如果你要做上一级地图的话,只需要用一个数组保存你的地址路径,然后类似下钻功能重新渲染地图。
backToHome () {
  this.mapAreaCode = '430000'
  this.initMapChart()
}
完整 Vue 代码
如果需要源码可以进行资源下载
下载完成后npm install ,再 npm run dev 运行就好啦,如果有任何问题可以问我~
<template>
  <div style="position: relative;">
    <!-- 左上角返回按钮 -->
    <div class="back-box" @click="backToHome" v-show="mapAreaCode != 430000">
      <img src="./images/返回.png">
    </div>
    <!-- 建立一个div用于放地图 canvas -->
    <div style="height: 1000px;width: 1000px;" id="mapEchart"></div>
    <!-- 左下角图例 -->
    <div class="map-tips">
      <div class="map-tips-item" style="display: flex">
        <div class="map-bar" style="background-color: #FF0000"></div>
        <span>大于 150,000人次 </span>
      </div>
      <div class="map-tips-item" style="display: flex">
        <div class="map-bar" style="background-color: #FF7800FF"></div>
        <span>大于 100,000人次 </span>
      </div>
      <div class="map-tips-item" style="display: flex">
        <div class="map-bar" style="background-color: #00D7E9FF"></div>
        <span>大于 50,000人次 </span>
      </div>
      <div class="map-tips-item" style="display: flex">
        <div class="map-bar" style="background-color: #0888FFFF"></div>
        <span>小于 50,000人次 </span>
      </div>
    </div>
  </div>
</template>

<script>
import areaCode from "./config/areaCode";
import mapAddr from "./config/mapAddr";
// 地图纹理
const wlImg = require('./images/纹理.png')
// 定位图标
const markImg = require('./images/mark.png')
export default {
  name: 'hnMap',
  components: {},
  props: {},
  data () {
    return {
      mapAreaCode: '430000', //当前地图展示的行政区划代码(默认为湖南省)
      myChart: null, // echarts 实例
      mapData: [], // 地图上显示的项目申报数据
      debounceTimer: null, // 用于防抖的计时器
    }
  },
  mounted () {
    this.initMapChart()
  },
  methods: {
    async initMapChart () {
      // 获取地图渲染json文件
      await this.registerMapJson()
      // 设置初始化的地图样式
      await this.setInitOption()
      // 初始化,渲染地图
      this.renderMap()
      // 添加点击事件的监听事件
      this.setClickListener()
    },
    // 获取地图渲染json文件
    async registerMapJson () {
      try {
        const mapFullResources = require(`./mapJson/${this.mapAreaCode}_full.json`)
        const mapResources = require(`./mapJson/${this.mapAreaCode}.json`)
        this.$echarts.registerMap("mapFullJson", mapFullResources);
        this.$echarts.registerMap("mapJson", mapResources);
      } catch (error) {
        throw new Error('地图加载失败,请刷新重试');
      }
    },
    // 设置初始化的地图样式
    async setInitOption () {
      let option = {
        tooltip: {
          trigger: 'item',
          formatter: (params) => {
            return `
              <div style="
                line-height: 24px;
                padding: 13px 15px;
                border-top: 1px solid #16D0FE;
                border-bottom: 1px solid #16D0FE;
                background-color: rgba(6,79,124,0.92);
                box-shadow: inset 0 -10px 10px -10px #00B5FF, 0 10px 10px -10px #00B5FF,inset 0 10px 10px -10px #00B5FF, 0 -10px 10px -10px #00B5FF;
                letter-spacing: 0.2em;
                border-radius: 10%;
              ">
                <div>${params.name}</div>
                <div>这是一个tooltip</div>
              </div>
            `;
          },
          textStyle: {
            color: '#ffffff',
            fontSize: 14,
          },
          padding: 0,
          borderRadius: 20,
          borderColor: 'transparent',
          backgroundColor: 'transparent'
        },
        // 地图渲染层级通过 z 属性来控制
        geo: [
          { // 整个地图最外部轮廓的外阴影
            map: 'mapJson',
            z: 3,
            roam: false,
            aspectScale: 0.9, //长宽比
            zoom: 1.1,
            tooltip: {
              show: false,
            },
            label: {
              show: false, // 是否显示对应地名
            },
            layoutCenter: ['50%', '50%'],
            // 如果宽高比大于 1 则宽度为 100,如果小于 1 则高度为 100,保证了不超过 100x100 的区域
            layoutSize: 650,
            emphasis: { // 对应的鼠标悬浮效果
              disabled: true,
            },
            select: {
              disabled: true
            },
            itemStyle: {
              normal: {
                areaColor: '#2f9fe7',
                shadowColor: 'rgba(9, 117, 185,0.7)',
                shadowBlur: 15,
                borderWidth: 0,
                shadowOffsetY: 25,
                shadowOffsetX: 5,
              },
              emphasis: {
                disabled: true, //是否可以被选中
              },
            },
          }, { // 中间部分的蓝色阴影-主体部分
            map: 'mapJson', // 表示中国地图
            roam: false,
            z: 2,
            aspectScale: 0.9, //长宽比
            zoom: 1.1,
            tooltip: {
              show: false,
            },
            label: {
              show: false, // 是否显示对应地名
            },
            layoutCenter: ['50%', '57%'],
            // 如果宽高比大于 1 则宽度为 100,如果小于 1 则高度为 100,保证了不超过 100x100 的区域
            layoutSize: 650,
            emphasis: { // 对应的鼠标悬浮效果
              disabled: true,
            },
            select: {
              disabled: true
            },
            itemStyle: {
              normal: {
                areaColor: '#38b4fc',
                borderColor: '#6dceff',
                borderWidth: 5,
                // 内部阴影
                shadowColor: 'rgba(9, 117, 185,0.7)',
                shadowBlur: 10,
                shadowOffsetY: -5,
                shadowOffsetX: -5,
              },
              emphasis: {
                disabled: true, //是否可以被选中
              },
            },
          }, { // 最下层阴影
            map: 'mapJson', // 表示中国地图
            roam: false,
            z: 1,
            aspectScale: 0.9, //长宽比
            zoom: 1.3,
            tooltip: {
              show: false,
            },
            label: {
              show: false, // 是否显示对应地名
            },
            layoutCenter: ['51%', '60%'],
            // 如果宽高比大于 1 则宽度为 650,如果小于 1 则高度为 650,保证了不超过 650x650 的区域
            layoutSize: 650,
            emphasis: { // 对应的鼠标悬浮效果
              disabled: true,
            },
            select: {
              disabled: true
            },
            itemStyle: {
              normal: {
                areaColor: 'rgba(4, 29, 83,0.5)',
                borderWidth: 0,
              },
              emphasis: {
                disabled: true, //是否可以被选中
              },
            },
          }
        ],
        series: [
          {
            type: 'map',
            map: 'mapFullJson',
            // data: this.mapData,
            zoom: 1.1,
            z: 4,
            layoutCenter: ['50%', '50%'],
            // 如果宽高比大于 1 则宽度为 100,如果小于 1 则高度为 100,保证了不超过 100x100 的区域
            layoutSize: 650,
            aspectScale: 0.9, //长宽比
            roam: false,
            label: {
              show: true,
              fontSize: 14,
              lineHeight: 16,
              padding: 0,
              borderRadius: 5,
              formatter: function (params) {
                // 这里模拟data里的数据
                var min = 40000;
                var max = 160000;
                const value = Math.floor(Math.random() * (max - min + 1)) + min;
                const areaname = params.name
                if (value >= 150000) {
                  return `{red|${areaname}}`
                } else if (value >= 100000) {
                  return `{orange|${areaname}}`
                } else if (value >= 50000) {
                  return `{green|${areaname}}`
                } else {
                  return `{blue|${areaname}}`
                }
              },
              rich: {
                // 四种标签样式
                red: {
                  color: "#fff",
                  padding: 10,
                  borderRadius: 3,
                  textBorderWidth: 10,
                  textShadowBlur: 15,
                  textBorderColor: 'rgba(41, 102, 155, 0.2)',
                  textShadowColor: 'rgba(41, 102, 155, 1)',
                  backgroundColor: 'rgba(255, 0, 0, 0.7)',
                },
                orange: {
                  color: "#fff",
                  padding: 10,
                  borderRadius: 3,
                  textBorderColor: 'rgba(3, 40, 103, 0.2)',
                  textBorderWidth: 10,
                  textShadowColor: 'rgba(3, 40, 103, 1)',
                  textShadowBlur: 15,
                  backgroundColor: 'rgba(236, 116, 9, 0.8)',
                },
                green: {
                  color: "#fff",
                  padding: 10,
                  borderRadius: 3,
                  textBorderColor: 'rgba(3, 40, 103, 0.2)',
                  textBorderWidth: 10,
                  textShadowColor: 'rgba(3, 40, 103, 1)',
                  textShadowBlur: 15,
                  backgroundColor: 'rgba(0, 215, 233, 0.8)',
                },
                blue: {
                  color: "#fff",
                  padding: 10,
                  textBorderColor: 'rgba(3, 40, 103, 0.2)',
                  textBorderWidth: 10,
                  textShadowColor: 'rgba(3, 40, 103, 1)',
                  textShadowBlur: 15,
                  backgroundColor: 'rgba(8, 136, 255, 0.8)',
                },
              },
            },
            select: {
              disabled: true
            },
            itemStyle: {
              normal: {
                borderColor: {
                  type: 'linear',
                  x: 0,
                  y: 0,
                  x2: 0,
                  y2: 1,
                  colorStops: [{
                    offset: 0, color: '#306ca1'
                  }, {
                    offset: 0.3, color: '#41b8ff'
                  }],
                },
                borderWidth: 3,
                areaColor: {
                  image: wlImg
                }
              },
              emphasis: {
                areaColor: {
                  image: wlImg
                },
                borderColor: '#fff',
                borderWidth: 5,
              },
            },
          },
        ],
        animation: false,
      }
      this.option = option
      return option
    },
    // 初始化,渲染地图
    renderMap () {
      if (this.myChart) {
        this.myChart.dispose(); // 销毁之前的 echarts 实例
        this.myChart.off('click'); // 解绑 click 事件监听器
      }
      // 保存新的 echarts 实例
      const myChart = this.$echarts.init(document.getElementById("mapEchart"));
      this.myChart = myChart
      myChart.clear()
      myChart.setOption(this.option);
    },
    // 添加点击事件监听(防抖)
    setClickListener () {
      this.myChart.on('click', (e) => {

        // 如果点击的是最下面的阴影层,不进行任何操作,因为geo层使用的是不带内部轮廓的json地图
        if (e.componentType === 'geo') {
          return
        }

        this.debounce(this.clickMapItem(e))

      });
    },
    // 防抖函数
    debounce (func, delay = 1000) {
      return (...args) => {
        clearTimeout(this.debounceTimer);
        this.debounceTimer = setTimeout(() => {
          func.call(this, ...args);
        }, delay);
      };
    },
    // 单击事件
    clickMapItem (e) {
      const selectedAreaName = e.name
      const selectedAreaCode = areaCode[selectedAreaName]
      if (selectedAreaCode) {
        // 点击的是市一级的话,下钻重新渲染地图
        this.mapAreaCode = selectedAreaCode
        this.initMapChart()
      } else {
        // 区县一级的话显示定位图标
        this.setMarkSymbol(selectedAreaName)
      }
    },
    /**
     * 根据地区名设置当前位置的定位图标
     * @param {String} selectedAreaName 需要显示定位图标的地区名
     */
    setMarkSymbol (selectedAreaName) {
      this.option.series[1] = {
        type: 'scatter',
        coordinateSystem: 'geo',
        z: 12,
        data: [ // 描点数据
          {
            name: selectedAreaName,
            value: mapAddr[selectedAreaName],
          }
        ],
        symbol: `image://${markImg}`,
        symbolSize: [44, 33],
      }
      this.myChart.setOption(this.option);
    },
    backToHome () {
      this.mapAreaCode = '430000'
      this.initMapChart()
    }
  },
}
</script>
<style lang="less" scoped>
.back-box {
  z-index: 999;
  position: absolute;
  top: 100px;
  cursor: pointer;
}
.map-tips-item {
  display: flex;
  margin-top: 10px;
}
.map-tips {
  position: absolute;
  bottom: 36px;
  left: 10%;
  z-index: 99;
  font-size: 14px;
  color: #9fd1ffff;
  height: 120px;
  width: 200px;
}
.map-bar {
  width: 44px;
  height: 17px;
  margin-right: 16px;
  border-radius: 8%;
}
</style>