echarts 柱状图隐藏x、y轴的内容,隐藏x,y轴坐标轴、刻度线、隐藏x、y轴坐标轴的数值
1.隐藏x轴坐标轴,在xAxis下使用axisLine属性为false,相反显示则是true
axisLine:{
"show":false
},

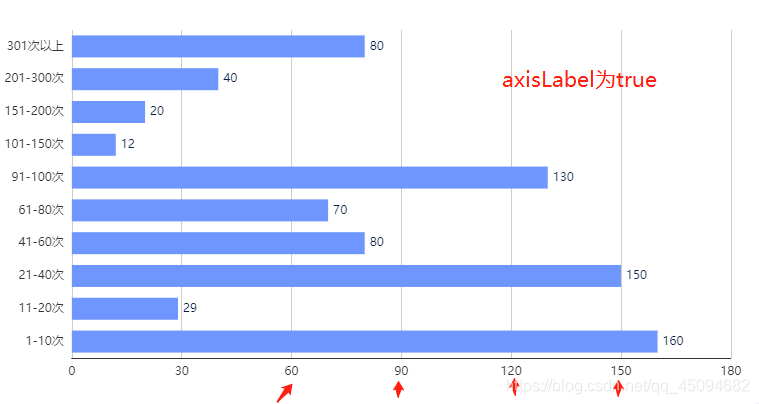
2.隐藏x轴坐标轴的数值,在xAxis下使用axisLabel属性为false,相反显示则是true
axisLabel:{ show: true },

3.隐藏x轴坐标轴刻度线,在xAxis下使用axisTick属性为false,相反显示则是true
axisTick: {
show:true
},

4.X轴整体代码
xAxis: {
show:true,
type: 'value',
splitLine:{
show:true
},
"axisLine":{
"show":true
},
axisLabel:{ show: true },
axisTick: {
show:true,
alignWithLabel: true,
},
},

5.如图是不想显示的x轴代码

全部代码如下
<div id="main5" style="width: 100%;height: 434px;"></div>
var chartFnc = {
init: function() {;
this.chartGraphFnc();
},
chartGraphFnc: function () {
var myChart = echarts.init(document.getElementById('main5'));
var option = {
grid: {
left: '3%',
right: '4%',
bottom: '6%',
width:"auto",
containLabel: true
},
xAxis: {
show:true,
type: 'value',
splitLine:{
show:true
},
"axisLine":{
"show":false
},
axisLabel:{
show: false
},
axisTick: {
show:false
},
},
yAxis: {
type: 'category',
data: ['1-10次', '11-20次', '21-40次', '41-60次', '61-80次', '91-100次', '101-150次', '151-200次', '201-300次', '301次以上'],
axisLine:{
show:false
},
axisTick: {
show:false,
alignWithLabel: true,
},
splitArea : {show : false},
},
series: [{
data: [160, 29, 150, 80, 70, 130,12,20,40,80],
type: 'bar',
showBackground: true,
backgroundStyle: {
color: 'rgba(180, 180, 180, 0.2)'
},
barWidth : 22,
itemStyle:{
normal: {
label: {
show: true,
position: 'right',
textStyle: {
fontSize : '12',
color: '#0A1F44'
}
},
color: '#6f96fe'
}
},
}]
};
myChart.setOption(option);
},
}
chartFnc.init();
});
注:如果想改变y轴内容,则跟x轴相反,放到yAxis里即可!!!


