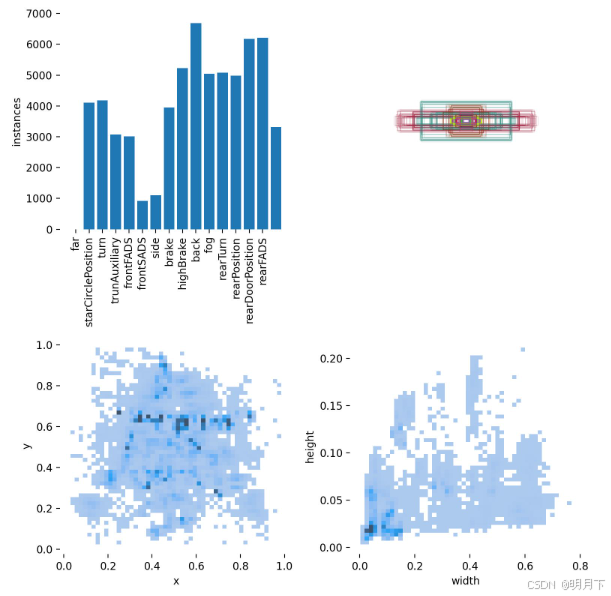
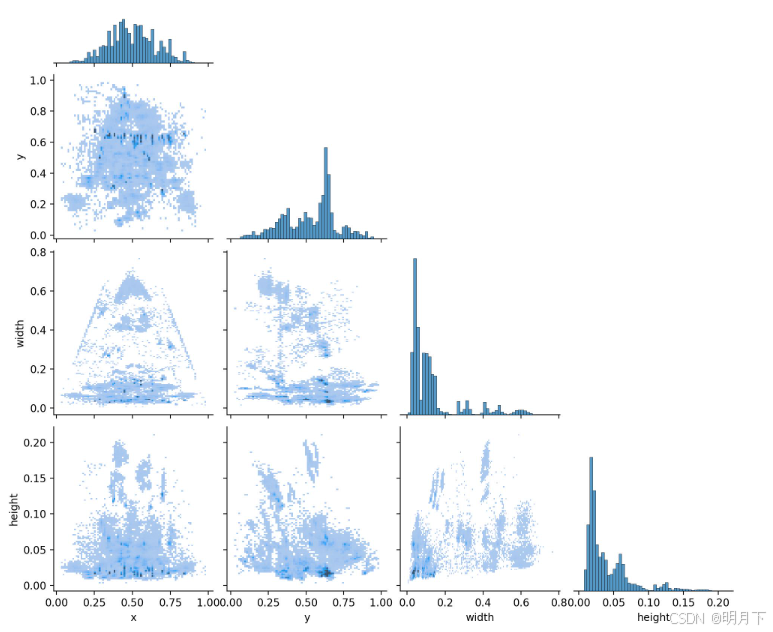
yolo的数据可视化很详细,coco格式没有。所以写了一个接口。
输入:coco格式的instances.json
输出:生成像yolo那样的标注文件统计并可视化
import os
import random
import numpy as np
import pandas as pd
import matplotlib
import matplotlib.pyplot as plt
import seaborn as sn
from glob import glob
from PIL import Image, ImageDraw
import json
"""

功能:
    读取instances.json
    生成像yolo那样的标注文件统计并可视化

"""

def convert(size, box):
    # size(img_width, img_height)
    # box=[x_min, y_min, width, height]
    # coco转yolo
    dw = 1. / (size[0])
    dh = 1. / (size[1])
    x = box[0] + box[2] / 2.0
    y = box[1] + box[3] / 2.0
    w = box[2]
    h = box[3]
    #round函数确定(xmin, ymin, xmax, ymax)的小数位数
    x = round(x * dw, 6)
    w = round(w * dw, 6)
    y = round(y * dh, 6)
    h = round(h * dh, 6)
    return (x, y, w, h)

def plot_labels(labels, names=(), save_dir='',colors=[0,0,255]):
    # plot dataset labels
    print('Plotting labels... ')
    c, b = labels[:, 0], labels[:, 1:].transpose()  # classes, boxes
    nc = int(c.max() + 1)  # number of classes
    x = pd.DataFrame(b.transpose(), columns=['x', 'y', 'width', 'height'])

    # seaborn correlogram
    sn.pairplot(x, corner=True, diag_kind='auto', kind='hist', diag_kws=dict(bins=50), plot_kws=dict(pmax=0.9))
    plt.savefig(os.path.join(save_dir, 'labels_correlogram.jpg'), dpi=200)
    plt.close()

    # matplotlib labels
    matplotlib.use('svg')  # faster
    ax = plt.subplots(2, 2, figsize=(8, 8), tight_layout=True)[1].ravel()
    y = ax[0].hist(c, bins=np.linspace(0, nc, nc + 1) - 0.5, rwidth=0.8)
    # [y[2].patches[i].set_color([x / 255 for x in colors(i)]) for i in range(nc)]  # update colors bug #3195
    ax[0].set_ylabel('instances')
    if 0 < len(names) < 30:
        ax[0].set_xticks(range(len(names)))
        ax[0].set_xticklabels(names, rotation=90, fontsize=10)
    else:
        ax[0].set_xlabel('classes')
    sn.histplot(x, x='x', y='y', ax=ax[2], bins=50, pmax=0.9)
    sn.histplot(x, x='width', y='height', ax=ax[3], bins=50, pmax=0.9)

    # rectangles
    labels[:, 1:3] = 0.5  # center
    labels[:, 1:] = xywh2xyxy(labels[:, 1:]) * 2000
    img = Image.fromarray(np.ones((2000, 2000, 3), dtype=np.uint8) * 255)
    for cls, *box in labels[:1000]:
        ImageDraw.Draw(img).rectangle(box, width=1, outline=colors[int(cls)-1])  # plot
    ax[1].imshow(img)
    ax[1].axis('off')

    for a in [0, 1, 2, 3]:
        for s in ['top', 'right', 'left', 'bottom']:
            ax[a].spines[s].set_visible(False)

    plt.savefig(os.path.join(save_dir, 'labels.jpg'), dpi=200)
    matplotlib.use('Agg')
    plt.close()

def xywh2xyxy(x):
    # Convert nx4 boxes from [x, y, w, h] to [x1, y1, x2, y2] where xy1=top-left, xy2=bottom-right
    y = np.copy(x)
    y[:, 0] = x[:, 0] - x[:, 2] / 2  # top left x
    y[:, 1] = x[:, 1] - x[:, 3] / 2  # top left y
    y[:, 2] = x[:, 0] + x[:, 2] / 2  # bottom right x
    y[:, 3] = x[:, 1] + x[:, 3] / 2  # bottom right y
    return y


def main(json_name,save_root,data_name):


    # 获取当前数据集中所有json文件

    with open(json_name, 'r', encoding='utf-8') as file:
        result = json.load(file)

    # 每个类别一个颜色
    category=[]
    for i in result['categories']:
        category.append(i['name'])# 类别
    num_classes = len(category)  # 类别数
    colors = [(random.randint(0,255),random.randint(0,255),random.randint(0,255)) for _ in range(num_classes)]  # 每个类别生成一个随机颜色

    # 统计标注信息
    shapes = []  # 标注框
    ids = []  # 类别名的索引
    for i in result['annotations']:
        img_height=result['images'][i['image_id']-1]['height']
        img_width=result['images'][i['image_id']-1]['width']
        label_id=i['category_id']
        ids.append([label_id])
        (x, y, w, h)=convert([img_width, img_height], i['bbox'])
        shapes.append([x, y, w, h])
    shapes = np.array(shapes)
    ids = np.array(ids)
    lbs = np.hstack((ids, shapes))
    plot_labels(labels=lbs, names=np.array(category),save_dir=os.path.join(save_root,data_name),colors=colors)

    print("可视化已保存:", os.path.join(save_root,data_name, "label.jpg"))


if __name__ == "__main__":
	json_name = os.path.join(path,data_name,'annotations','instances.json')
	save_root='保存路径'
	data_name='数据集的名称'
    main(json_name,save_root,data_name)
labels.jpg
labels_correlogram.jpg

