import pandas as pd
import numpy as np
import matplotlib. pyplot as plt
from sklearn. preprocessing import MinMaxScaler
from keras. models import Sequential
from keras. layers import Dense, LSTM, Dropout
from keras. optimizers import SGD
dataset = pd. read_csv( "datasets_8388_11883_IBM_2006-01-01_to_2018-01-01.csv" , index_col= 'Date' , parse_dates= [ 'Date' ] )
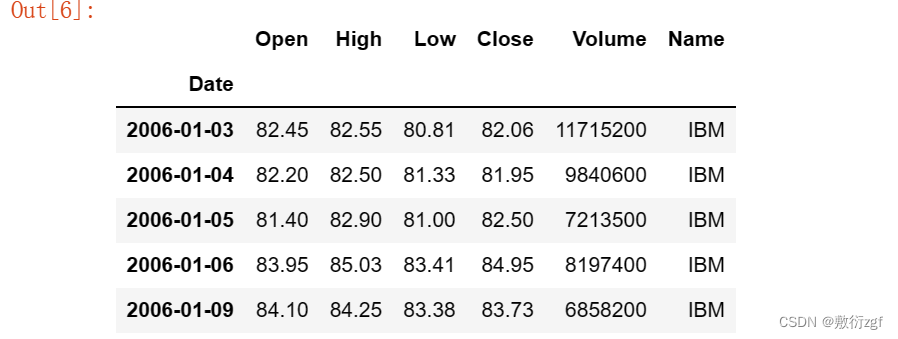
dataset. head( )
dataset. shape
train_set = dataset[ : '2016' ] . iloc[ : , 1 : 2 ] . values
test_set = dataset[ '2017' : ] . iloc[ : , 1 : 2 ] . values
train_set. shape
test_set. shape
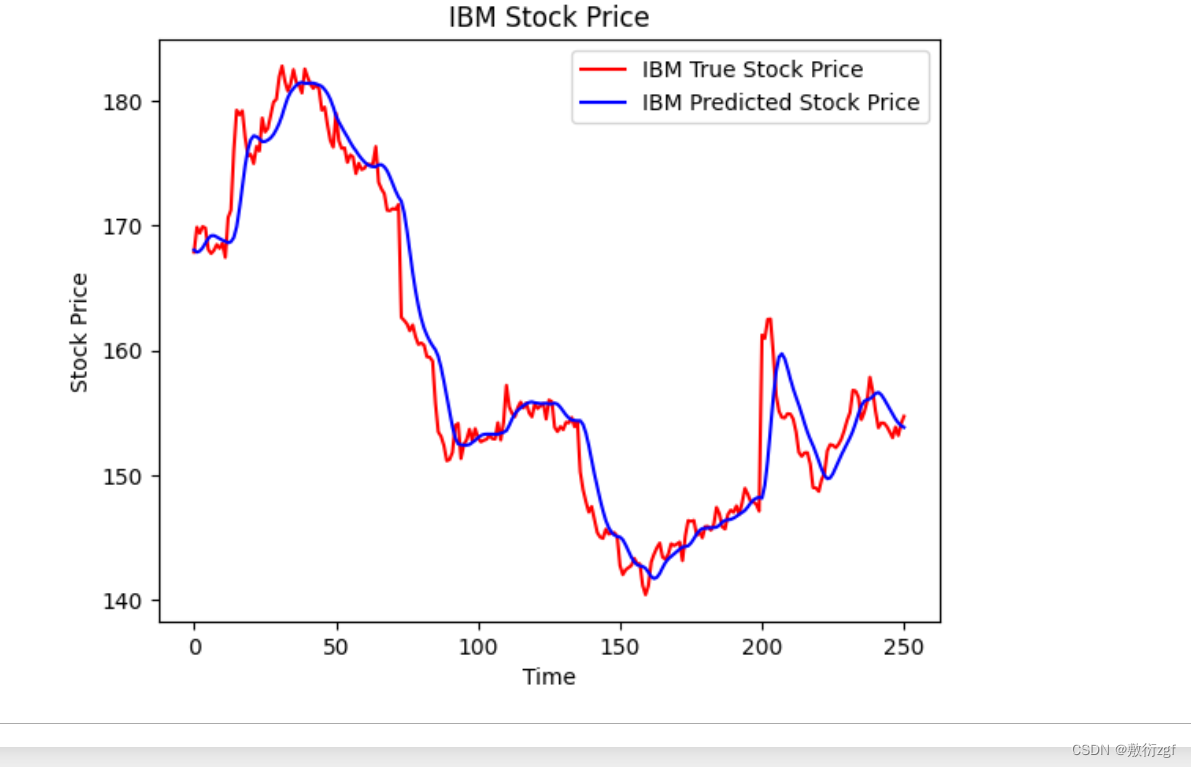
def plot_predictions ( test_result, predict_result) :
"""
test_result:真实值
predict_result: 预测值
"""
plt. plot( test_result, color= 'red' , label= 'IBM True Stock Price' )
plt. plot( predict_result, color= 'blue' , label= 'IBM Predicted Stock Price' )
plt. title( 'IBM Stock Price' )
plt. xlabel( 'Time' )
plt. ylabel( 'Stock Price' )
plt. legend( )
plt. show( )
dataset[ 'High' ] [ : '2016' ] . plot( figsize= ( 16 , 4 ) , legend= True )
dataset[ 'High' ] [ '2017' : ] . plot( figsize= ( 16 , 4 ) , legend= True )
plt. title( 'IBM Stock Price' )
plt. legend( [ 'Train set(before 2016)' , 'Test set(after 2017)' ] )
plt. show( )
sc = MinMaxScaler( feature_range = [ 0 , 1 ] )
train_set_scaled = sc. fit_transform( train_set)
X_train = [ ]
y_train = [ ]
for i in range ( 60 , 2769 ) :
X_train. append( train_set_scaled[ i- 60 : i, 0 ] )
y_train. append( train_set_scaled[ i, 0 ] )
X_train, y_train = np. array( X_train) , np. array( y_train)
X_train. shape
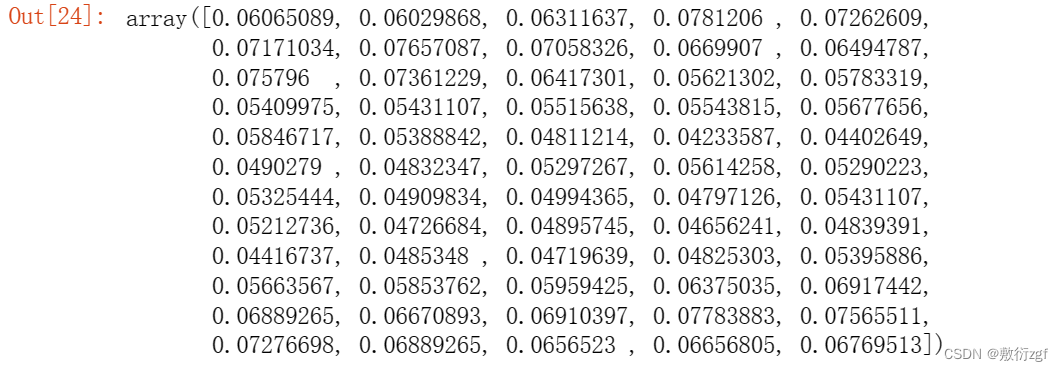
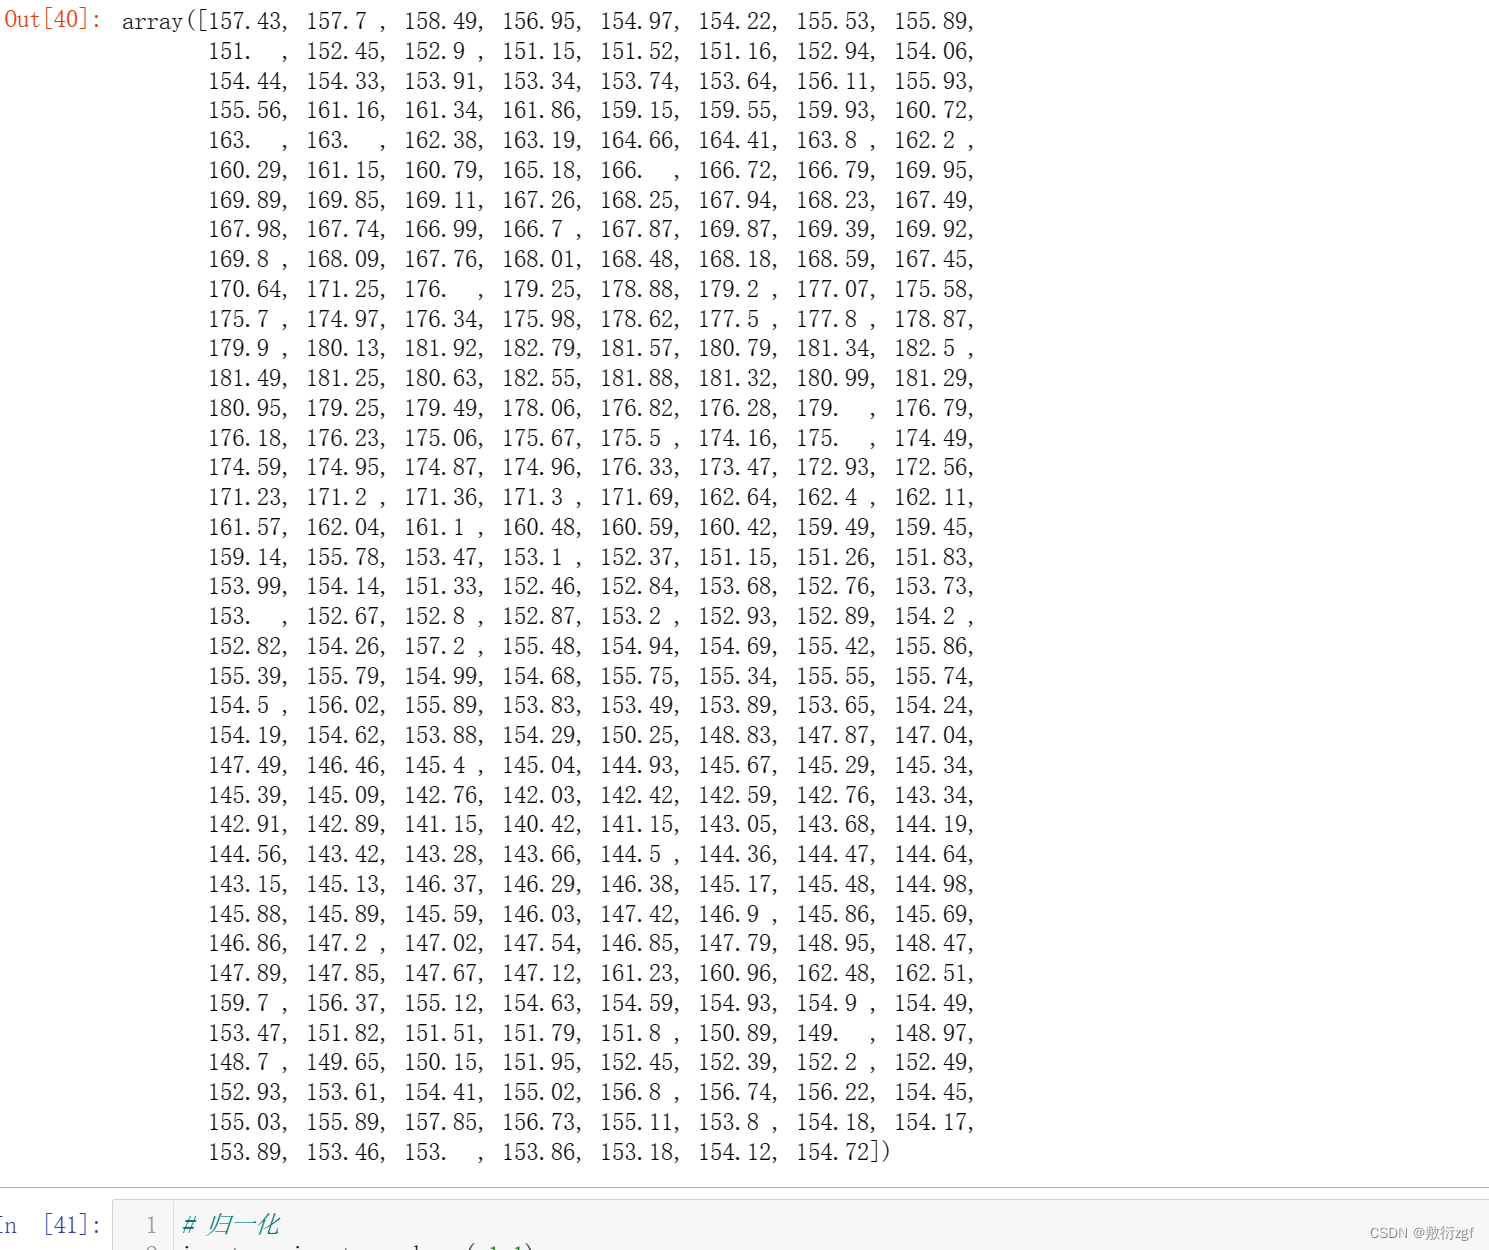
X_train[ 0 ]
X_train = np. reshape( X_train, ( X_train. shape[ 0 ] , X_train. shape[ 1 ] , 1 ) )
X_train. shape
model = Sequential( )
model. add( LSTM( 128 , return_sequences= True , input_shape= ( X_train. shape[ 1 ] , 1 ) ) )
model. add( Dropout( 0.2 ) )
model. add( LSTM( 128 , return_sequences= True ) )
model. add( Dropout( 0.2 ) )
model. add( LSTM( 128 ) )
model. add( Dropout( 0.2 ) )
model. add( Dense( units= 1 ) )
model. compile ( optimizer= 'rmsprop' , loss= 'mse' )
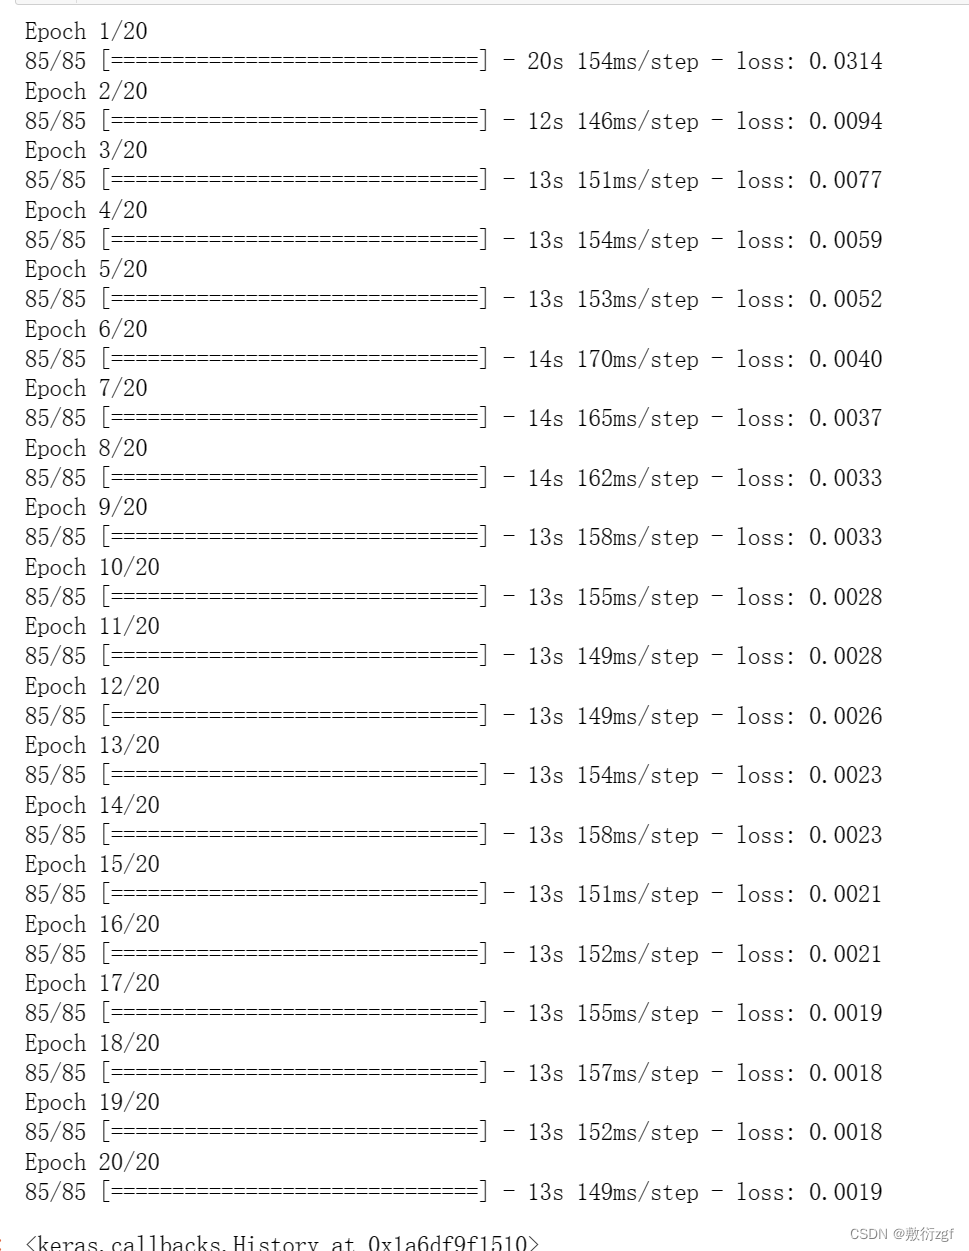
model. fit( X_train, y_train, epochs= 20 , batch_size= 32 )
dataset_total = pd. concat( ( dataset[ 'High' ] [ : '2016' ] , dataset[ 'High' ] [ '2017' : ] ) , axis = 0 )
dataset_total. shape
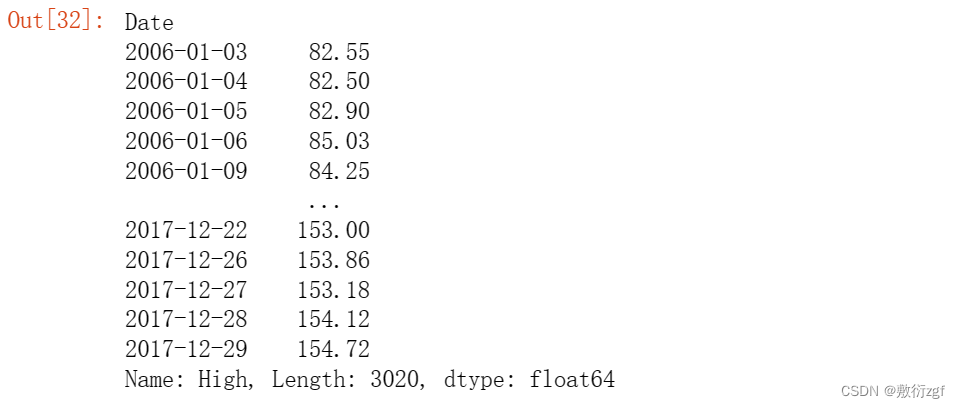
dataset_total
inputs = dataset_total[ len ( train_set) : ] . values
inputs = inputs. reshape( - 1 , 1 )
inputs. shape
inputs_scaled = sc. fit_transform( inputs)
dataset_total = pd. concat( ( dataset[ 'High' ] [ : '2016' ] , dataset[ 'High' ] [ '2017' : ] ) , axis= 0 )
inputs = dataset_total[ len ( dataset_total) - len ( test_set) - 60 : ] . values
inputs
inputs = inputs. reshape( - 1 , 1 )
inputs = sc. transform( inputs)
inputs. shape
X_test = [ ]
for i in range ( 60 , 311 ) :
X_test. append( inputs[ i- 60 : i, 0 ] )
X_test = np. array( X_test)
X_test. shape
X_test = np. reshape( X_test, ( X_test. shape[ 0 ] , X_test. shape[ 1 ] , 1 ) )
X_test. shape
predict_test = model. predict( X_test)
predict_test. shape
predict_stock_price = sc. inverse_transform( predict_test)
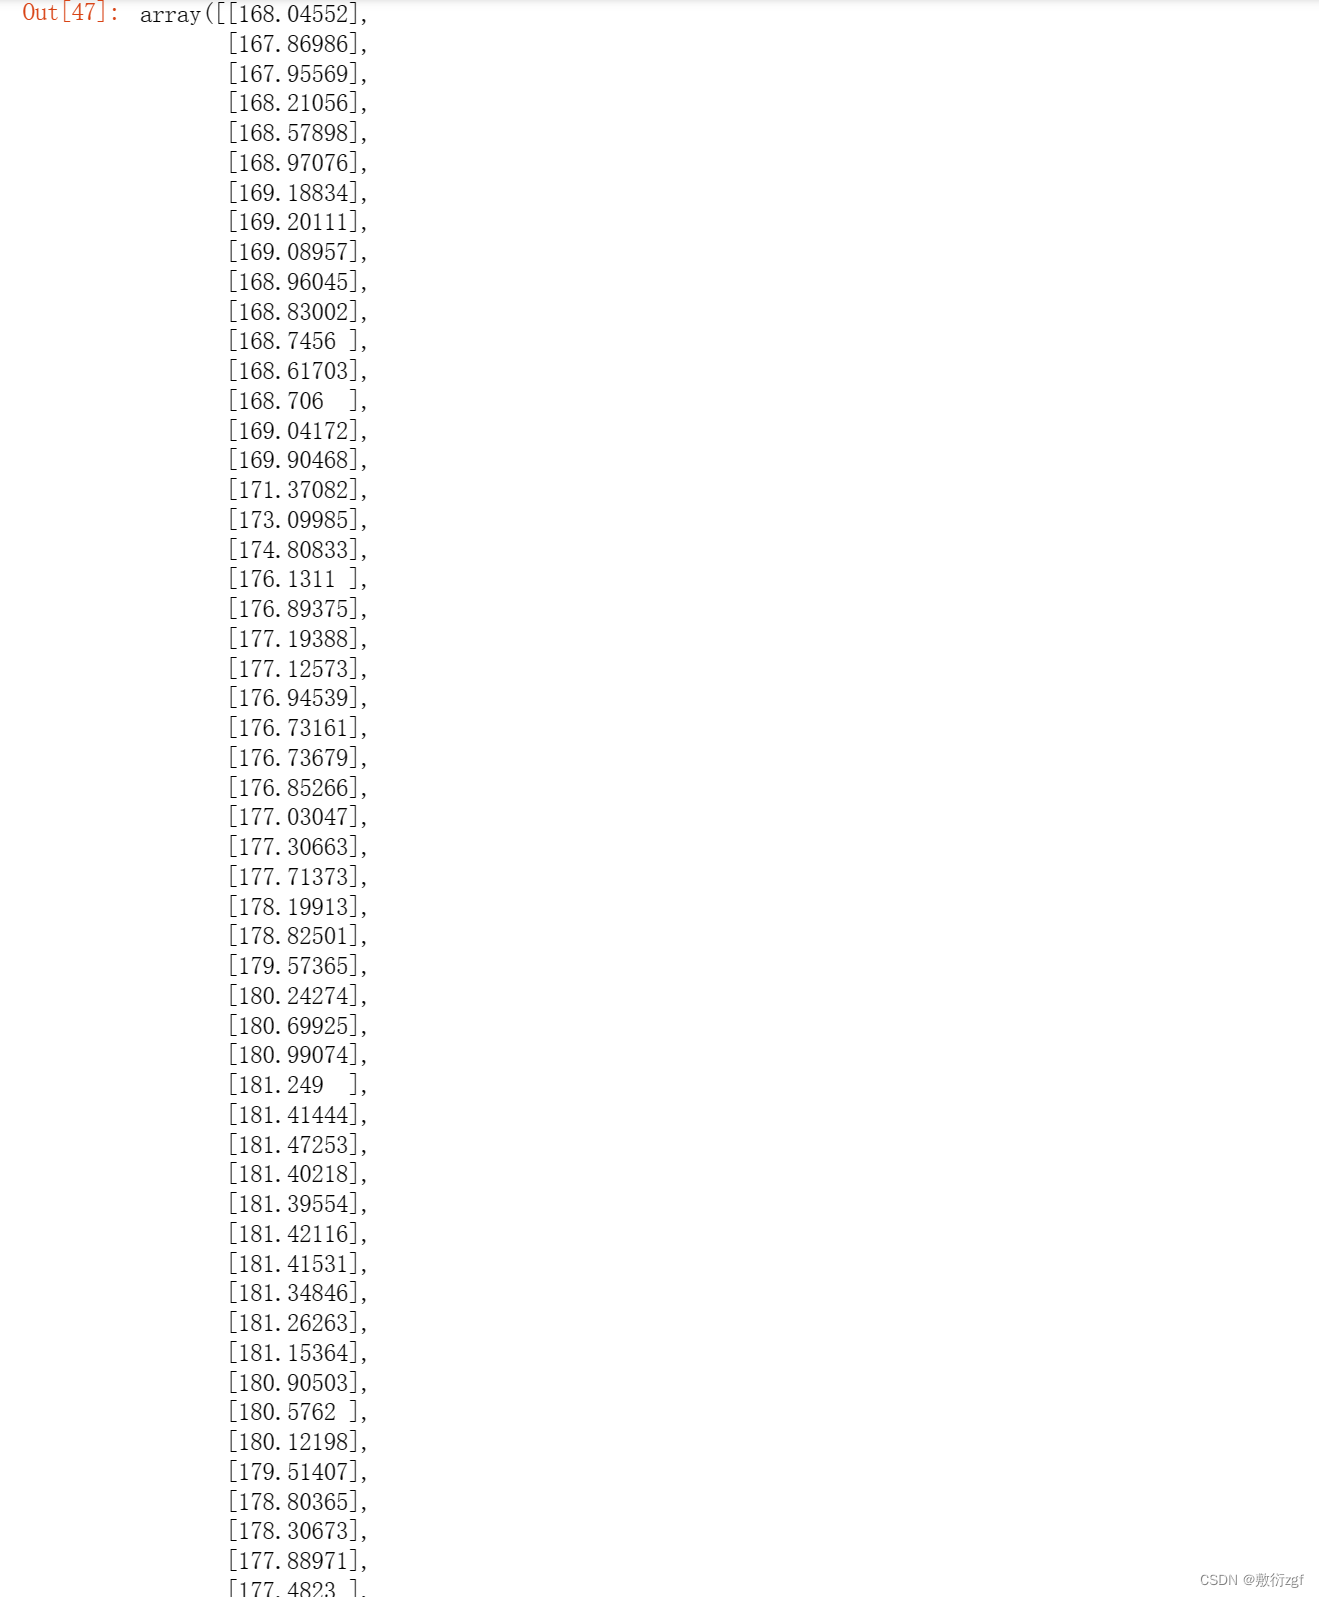
predict_stock_price
plot_predictions( test_set, predict_stock_price)
