1、GeoJSON数据的加载
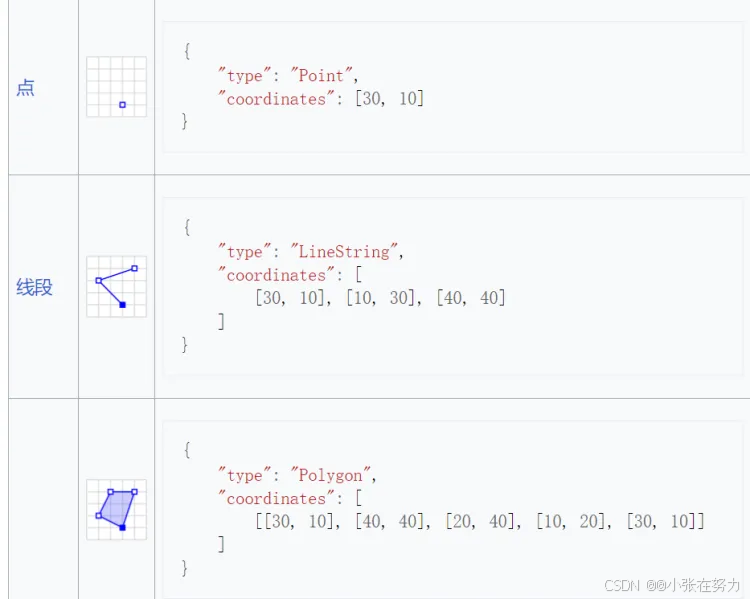
GeoJSON是一种基于JSON的地理空间数据交换格式,它定义了几种类型JSON对象以及它们组合在一起的方法,以表示有关地理要素、属性和它们的空间范围的数据
2、GeoJSON转化为ol要素
new ol.format.GeoJSON().readFeatures()一、canvas
1、关于canvas
1、概念
HTML5新增的一个标签,区别css地方,它是使用JavaScript来实现图形的绘制,结合webgl实现复杂的图形绘制。
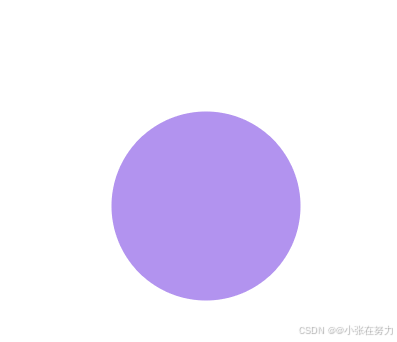
2、绘制矩形
<canvas id="canvas" width="200" height="200"></canvas>
<script>
        /* 获取画布canvas */
        var canvas = document.getElementById("canvas");
        /* 获取canvas上下文
         getContext('2d')可以返回一个对象,该对象提供了绘图的方法和属性
         */
        const ctx = canvas.getContext("2d");
        /* fillStyle属性设置图形的填充色 和css的background-color类似 */
        ctx.fillStyle= "#6528e0";
        /* fillRect(x,y,width,height)设置矩形 */
        ctx.fillRect(10,10,100,100)


</script>
3、canvas中的坐标
canvas 是一个二维网格。
canvas 的左上角坐标为 (0,0)
上面的 fillRect 方法拥有参数 (10,10,100,100)。
意思是:在左上角开始 (10,10)的位置,绘制100*100的图形
4、路径-线
所谓路径:就是连续的坐标点的集合。
在Canvas上画线,我们将使用以下两种方法:
- moveTo(x,y) 定义线条开始坐标
- lineTo(x,y) 定义线条结束坐标
<canvas id="canvas" width="200" height="200"></canvas>
<script>
        /* 获取画布canvas */
        var canvas = document.getElementById("canvas");
        /* 获取canvas上下文
        getContext('2d')方法返回一个对象,这个对象可以绘制多种图形
         */
        const ctx = canvas.getContext("2d");
       /* 路径 */
       ctx.lineWidth = 5;
       ctx.moveTo(0,0);
       ctx.lineTo(100,100);
       ctx.strokeStyle = "#ff2d51";
       ctx.stroke();
</script>
2、圆
1、绘制弧线
arc(x, y, radius, startAngle, endAngle, anticlockwise): 以(x, y) 为圆心,以radius 为半径,从 startAngle 弧度开始到endAngle弧度结束。anticlosewise 是布尔值,true 表示逆时针,false 表示顺时针(默认是顺时针)。
注意:
- 这里的度数都是弧度。
- 0 弧度是指的 x 轴正方向。radians=(Math.PI/180)*degrees //角度转换成弧度
2、空心圆
 <canvas id="canvas" width="200" height="200"></canvas>
    <script>
        /* 1、获取画布 */
        let canvas = document.getElementById("canvas");
        /* 2、获取绘制上下文 */
        let ctx = canvas.getContext("2d");
        /* 设置路径 */
        ctx.beginPath();
        /* 第一,第二参数 中心 */
        /* 第三个参数 半径 */
        /* 第四个参数 开始的弧度 */
        /* 第五个参数  结束的弧度 */
        /* ctx.arc(x,y,radius,startAngle,endAngle) */
        ctx.arc(100, 100, 50, 0, Math.PI*2)
        ctx.closePath();
        ctx.stroke();
    </script>
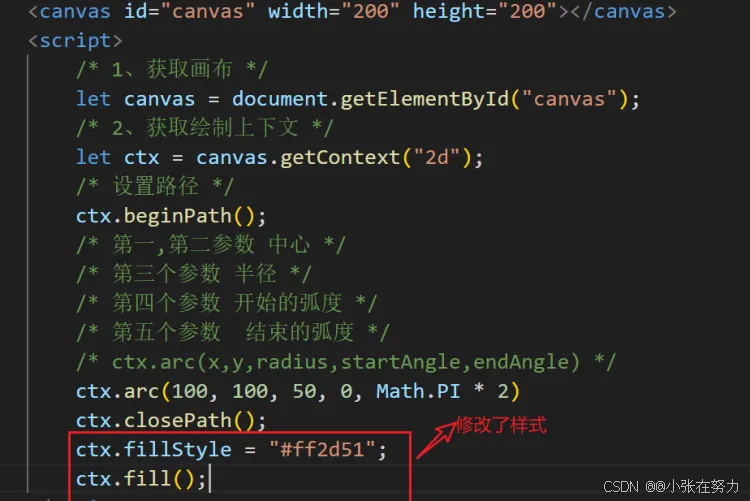
3、实心圆
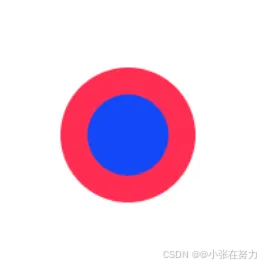
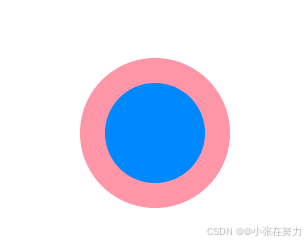
4、圆环
<body>
    <canvas id="canvas" width="200" height="200"></canvas>
    <script>
        /* 1、画布 */
        var canvas = document.getElementById("canvas");
        /* 2、context */
        var ctx = canvas.getContext("2d");
        /* 3、绘制 */
        /* 第一个圆 */
        ctx.beginPath();
        ctx.arc(100, 100, 50, 0, Math.PI * 2);
        ctx.closePath();
        ctx.fillStyle = "#ff2d51"
        ctx.fill();
        /* 第二个圆 */
        ctx.beginPath();
        ctx.arc(100, 100, 30, 0, Math.PI * 2);
        ctx.closePath();
        ctx.fillStyle = "#1248F8";
        ctx.fill();
    </script>
</body>
5、动画圆
<body>
    <canvas id="canvas" width="200" height="200"></canvas>
    <script>
        /* 1、画布 */
        var canvas = document.getElementById("canvas");
        /* 2、context */
        var ctx = canvas.getContext("2d");
        let increase = true;
        let radius = 50;
        /*
        50~80
        <50   true  radius ++
        >80   false radius --
         */
        function draw() {
            /* 清空画布 */
            ctx.clearRect(0, 0, canvas.width, canvas.height)
            /* 圆 */
            ctx.beginPath()
            ctx.arc(100, 100, radius, 0, Math.PI * 2)
            ctx.closePath();
            ctx.fillStyle = "#652e80"
            ctx.fill();
            if (radius > 80) {
                increase = false;
            } else if (radius < 50) {
                increase = true;
            }
            if (increase) {
                radius++;
            } else {
                radius--;
            }
        }
        setInterval(() => {
            draw()
        }, 20)
    </script>
</body>
6、多圈动画圆
<body>
    <canvas id="canvas" width="200" height="200"></canvas>
    <script>
        /* 1、画布 */
        var canvas = document.getElementById("canvas");
        /* 2、context */
        var ctx = canvas.getContext("2d");
        let increase = true;
        let radius = 50;
        /*
        50~80
        <50   true  radius ++
        >80   false radius --
         */
        function draw() {
            /* 清空画布 */
            ctx.clearRect(0, 0, canvas.width, canvas.height)
            /* 第一个圆 */
            ctx.beginPath()
            ctx.arc(100, 100, radius, 0, Math.PI * 2)
            ctx.closePath();
            ctx.fillStyle = "#ff2d51"
            ctx.fill();
            /* 第二个圆  写死 */
            ctx.beginPath()
            ctx.arc(100, 100, 40, 0, Math.PI * 2)
            ctx.closePath();
            ctx.fillStyle = "#1248F8"
            ctx.fill();
            if (radius > 70) {
                increase = false;
            } else if (radius < 50) {
                increase = true;
            }
            if (increase) {
                radius++;
            } else {
                radius--;
            }
            setTimeout(draw, 50)
        }
        draw();
    </script>
</body>
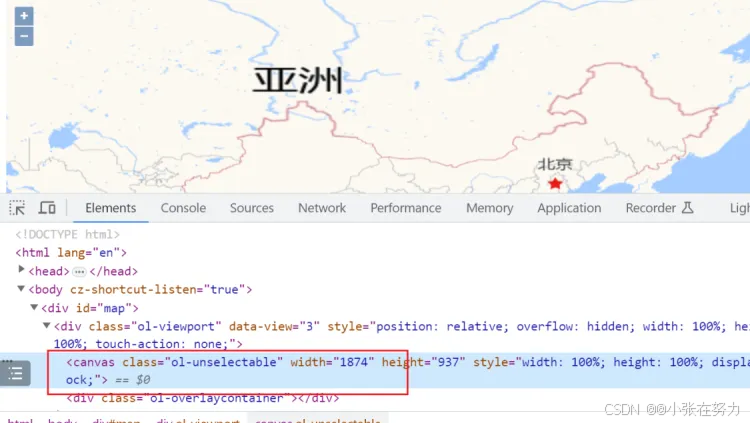
3、openlayers结合canvas
1、canvas-style
<!DOCTYPE html>
<html lang="en">

<head>
    <meta charset="UTF-8">
    <meta name="viewport" content="width=device-width, initial-scale=1.0">
    <title>Document</title>
    <script src="./OL_SDK/include-openlayers-local.js"></script>
    <script src="./libs/gaode.js"></script>
</head>

<body>
    <div id="map">
    </div>
    <script>
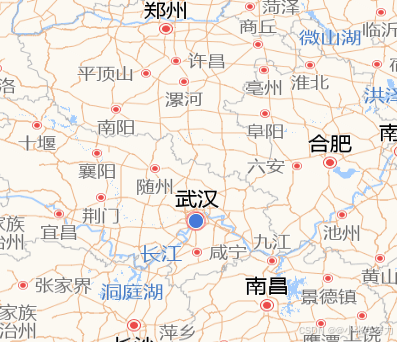
        var map = new ol.Map({
            target: "map",
            layers: [gaode],
            view: new ol.View({
                projection: 'EPSG:4326',
                center: [114.30, 30.50],
                zoom: 4
            })
        })
        /* canvas-style */

        /* 设置空的source图层 */
        let source = new ol.source.Vector({})
        let layer = new ol.layer.Vector({
            source
        })
        map.addLayer(layer)
        /* canvas-style */
        let size = 100;
        let canvas = document.createElement("canvas");
        canvas.width = size;
        canvas.height = size;
        /* 设置半径 */
        let radius = size / 4;
        /* 绘制 */
        let ctx = canvas.getContext("2d");
        ctx.beginPath();
        ctx.arc(50, 50, radius, 0, Math.PI * 2);
        ctx.closePath();
        ctx.fillStyle = "#ff2d51";
        ctx.fill();
        /* 设置canvas元素为openlayers的样式 */
        let style = new ol.style.Style({
            image: new ol.style.Icon({
                img: canvas,
                imgSize: [canvas.width, canvas.height]
            })
        })
        var point = new ol.Feature({
            geometry: new ol.geom.Point([114.30, 30.50])
        })
        point.setStyle(style);
        source.addFeature(point);
    </script>
</body>

</html>
2、初步封装setCanvasStyle
function setCanvasStyle(size) {
  let canvas = document.createElement("canvas");
  let ctx = canvas.getContext("2d");
  canvas.width = size;
  canvas.height = size;
  /* 设置半径 */
  let radius = size / 4;
  /* 绘制 */
  ctx.beginPath();
  ctx.arc(size / 2, size / 2, radius, 0, Math.PI * 2);
  ctx.closePath();
  ctx.fillStyle = "#ff2d51";
  ctx.fill()
  /* 设置canvas元素为openlayers的样式 */
  let style = new ol.style.Style({
    image: new ol.style.Icon({
      img: canvas,
      imgSize: [canvas.width, canvas.height]
    })
  })
  return style;
}
3、动画圆-setCanvasStyle
function setCanvasStyle(map, size) {
    /* canvas-style */
    let canvas = document.createElement("canvas");
    let ctx = canvas.getContext("2d");
    canvas.width = size;
    canvas.height = size;
    /* 设置半径 */
    /* 如果 size = 40 编辑 radius 10 */
    let radius = size / 4;
    let increase = true;
    /* 10~16 */
    function draw() {
        /* 清空画布 */
        ctx.clearRect(0, 0, canvas.width, canvas.height);
        ctx.beginPath();
        ctx.arc(size / 2, size / 2, radius, 0, Math.PI * 2);
        ctx.closePath();
        ctx.fillStyle = "#652e80";
        ctx.fill();
        if (radius > (size / 4 + 6)) {
            increase = false
        } else if (radius < size / 4) {
            increase = true;
        }
        if (increase) {
            radius++;
        } else {
            radius--;
        }
        setTimeout(draw, 50);
        /* render */
        map.render();
    }
    /* 触发动画 */
    draw();
    /* 将canvas元素转化openlayers的样式 */
    let style = new ol.style.Style({
        image: new ol.style.Icon({
            img: canvas,
            imgSize: [canvas.width, canvas.height]
        })
    })
    return style;
}