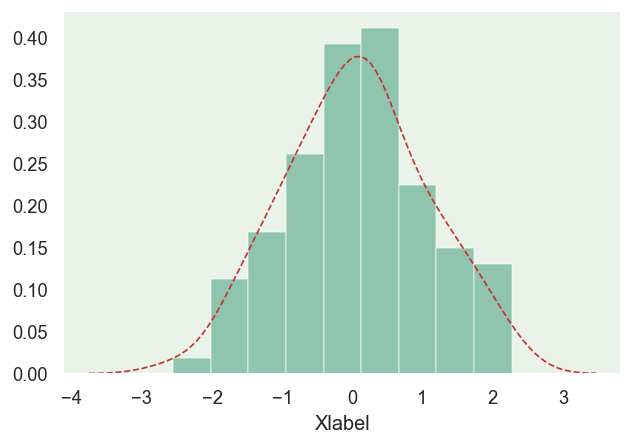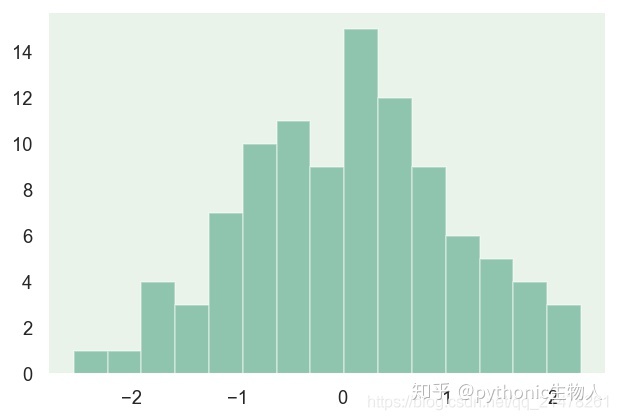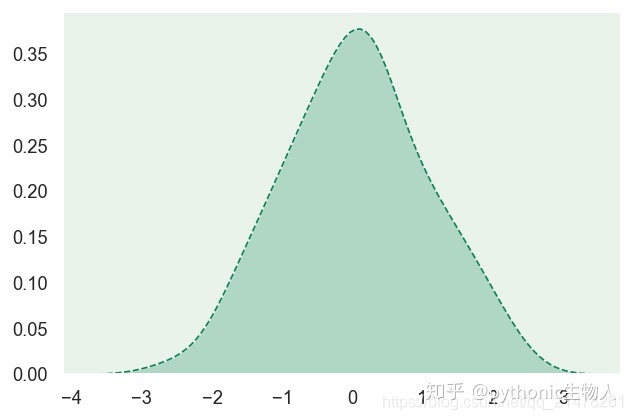
本文介绍seaborn.distplot绘制 单变量分布图( 直方图及 核密度图)。
本文内容概要
欢迎随缘关注@pythonic生物人
- 直方图

- 核密度图

- 直方图结合核密度图

目录
1、seaborn.distplot
数据准备
绘制直方图hist
修改直方图hist中箱子数bins
直方图成箱方式
绘制核密度曲线kernel density estimate (KDE)
seaborn.kdeplot绘制窄宽度核密度曲线
bandwidth (bw),控制核密度曲线胖瘦
核密度曲线结合直方图
fit参数
seaborn.distplot简介
seaborn.distplot(a, bins=None, hist=True, kde=True, rug=False, fit=None, hist_kws=None, kde_kws=None, rug_kws=None, fit_kws=None, color=None, vertical=False, norm_hist=False, axlabel=None, label=None, ax=None) http://seaborn.pydata.org/generated/seaborn.distplot.html#seaborn.distplot
整合了如下三个函数:
matplotlib中的直方图hist(默认绘制直方图)
se