<!DOCTYPE html>
<html lang="en">
<head>
<meta charset="UTF-8">
<meta name="viewport" content="width=device-width, initial-scale=1.0">
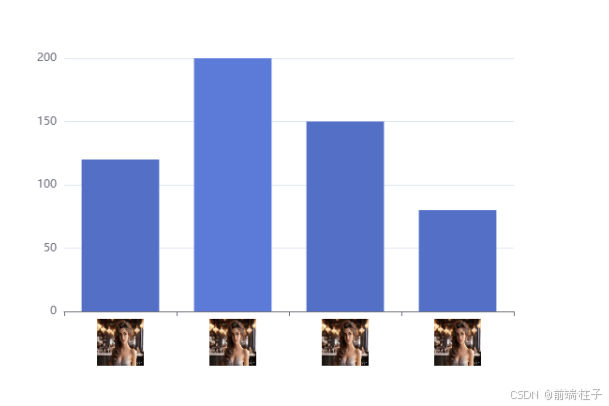
<title>图片作为横坐标示例 - ECharts</title>
<script src="https://cdn.jsdelivr.net/npm/[email protected]/dist/echarts.min.js"></script>
</head>
<body>
<div id="chart" style="width: 600px; height: 400px;"></div>
<script>
var myChart = echarts.init(document.getElementById('chart'));
const data = [
{ value: 'A', label: { image: 'http://gips3.baidu.com/it/u=3886271102,3123389489&fm=3028&app=3028&f=JPEG&fmt=auto?w=1280&h=960' } },
{ value: 'B', label: { image: 'http://gips3.baidu.com/it/u=3886271102,3123389489&fm=3028&app=3028&f=JPEG&fmt=auto?w=1280&h=960' } },
{ value: 'C', label: { image: 'http://gips3.baidu.com/it/u=3886271102,3123389489&fm=3028&app=3028&f=JPEG&fmt=auto?w=1280&h=960' } },
{ value: 'D', label: { image: 'http://gips3.baidu.com/it/u=3886271102,3123389489&fm=3028&app=3028&f=JPEG&fmt=auto?w=1280&h=960' } }
]
const rich = {
}
data.forEach(item=>{
rich[item.value] ={
height: 50,
width: 50,
backgroundColor:{ image: item.label.image }
}
})
var option = {
xAxis: {
type: 'category',
data:data,
axisLabel: {
formatter: function (value) {
return `{${value}| }`;
},
rich:rich
}
},
yAxis: {
type: 'value'
},
series: [
{
type: 'bar',
data: [120, 200, 150, 80]
}
]
};
myChart.setOption(option);
</script>
</body>
</html>
