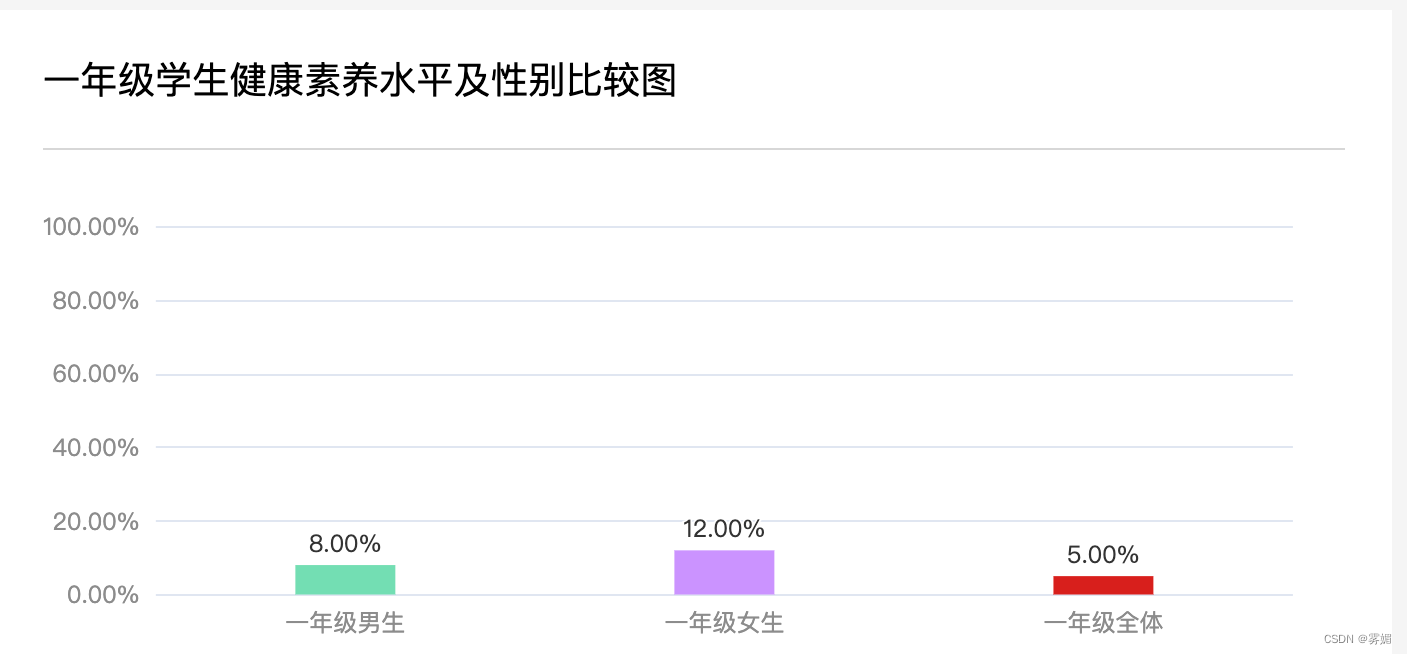
需要实现的样式:
具体代码:
var chartDom = document.getElementById("top_right");
      var myChart = this.$echarts.init(chartDom);
      let xData = ["一年级全体", "一年级女生", "一年级男生"]
      let yData = [5, 12, 8]
      let option = {
        xAxis: [
          {
            type: "category",
            axisLine: {
              onZero: false
            },
            axisTick: {
              show: false
            },
            inverse: true,
            data: xData,
            axisLine: {
              show: false,
              lineStyle: {
                color: "#8c8c8c"
              }
            }
          }
        ],
        yAxis: [
          {
            type: "value",
            splitNumber: 4,
            max: 100,
            min: 0,
            interval: 20,
            axisLabel: {
              formatter: function(value) {
                return value.toFixed(2) + "%";
              }
            },
            axisLine: {
              show: false,
              lineStyle: {
                color: "#8c8c8c"
              }
            },
            axisTick: {
              show: false
            }
          }
        ],
        grid: {
          left: "0%",
          right: "4%",
          bottom: "5%",
          top: "15%",
          containLabel: true
        },
        tooltip: {
        },
        series: [
          {
            // name: "销量",
            type: "bar",
            barWidth: 50,
            label: {
              normal: {
                show: true,
                position: "top",
                formatter: function(params) {
                  var total = 0;
                  echarts.util.each(
                    myChart.getOption().series[0].data,
                    function(item, index) {
                      if (item) {
                        total += item;
                      }
                    }
                  );
                  // return ((params.data / total) * 100).toFixed(2) + "%";
                  return ((params.data)).toFixed(2) + "%";
                }
              }
            },
            itemStyle: {
                color: '#52A8FF',
                normal: {
                    // borderRadius: [0, 8, 8, 0],
                    color: function (params) {
                        // 定义一个颜色集合
                        let colorList = [
                            '#d91e1c',
                            '#cb93ff',
                            '#73deb3',
                        ];
                        // 对每个bar显示一种颜色
                        return colorList[params.dataIndex];
                    },
                },
            },
            data:yData
          }
        ]
      };
      myChart.setOption(option);