pandas做柱状图
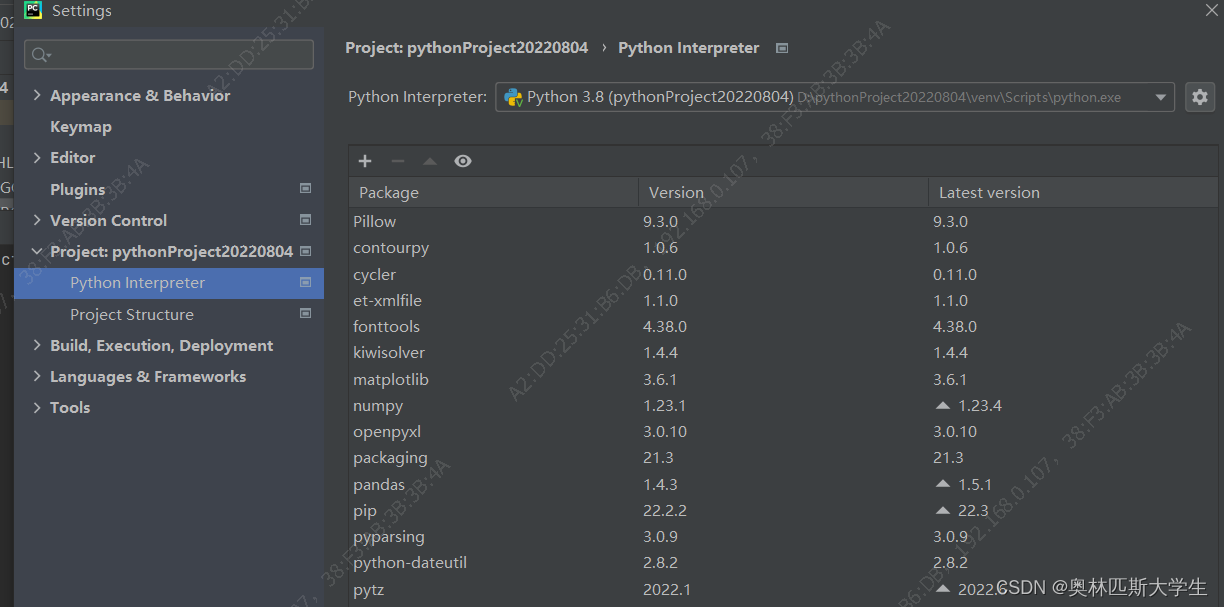
首先引入新的包,没有的去setting里面先安装matplotlib
然后在文件中引入matplotlib 其中一个工具就行pyplot 这个就是画柱状图的工具类
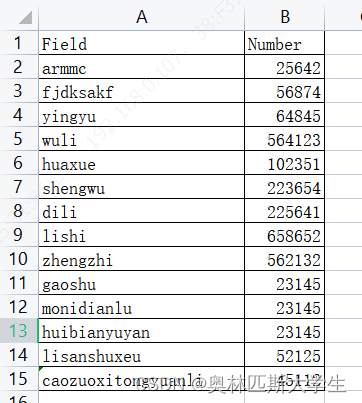
原数据是这样的
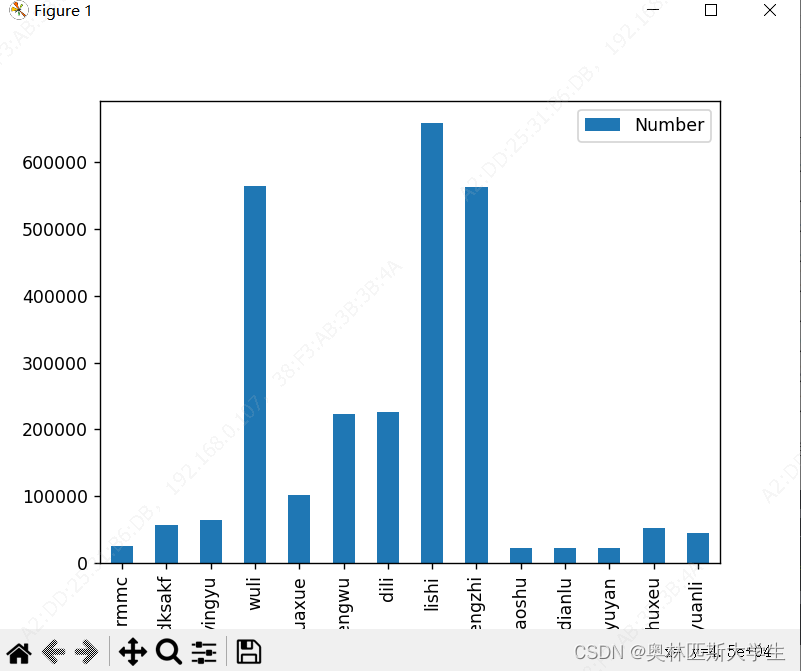
代码是这样的`
import pandas as pd
import matplotlib.pyplot as plt
students = pd.read_excel('D:/Pandas/Various.xlsx')
students.plot.bar(x = 'Field',y='Number')
plt.show()
然后结果是这样的
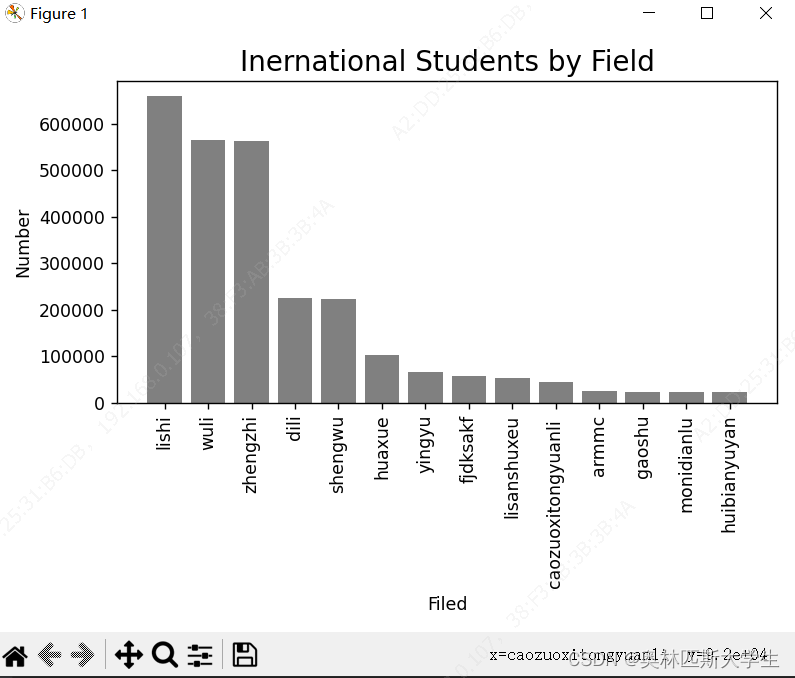
直接中palt做柱状图,并且设置一些样式
import pandas as pd
import matplotlib.pyplot as plt

students = pd.read_excel('D:/Pandas/Various.xlsx')
# 按照number排序,然后从大到小排序
students.sort_values(by='Number', inplace=True, ascending=False)
# 一个横坐标一个纵坐标,还有颜色的 设置柱状图颜色
plt.bar(students.Field, students.Number, color='grey')
# rotation的值只有horizontal,和vertical,90是不行的,就是一个纵排一个横排
plt.xticks(students.Field, rotation='vertical')
# 设置横坐标和纵坐标的标题
plt.xlabel('Filed')
plt.ylabel('Number')
plt.title('Inernational Students by Field',fontsize= '16')
# 为了显示全,自适应
plt.tight_layout()
plt.show()
结果:
下一篇要做更复杂的柱状图了,就是分组的。