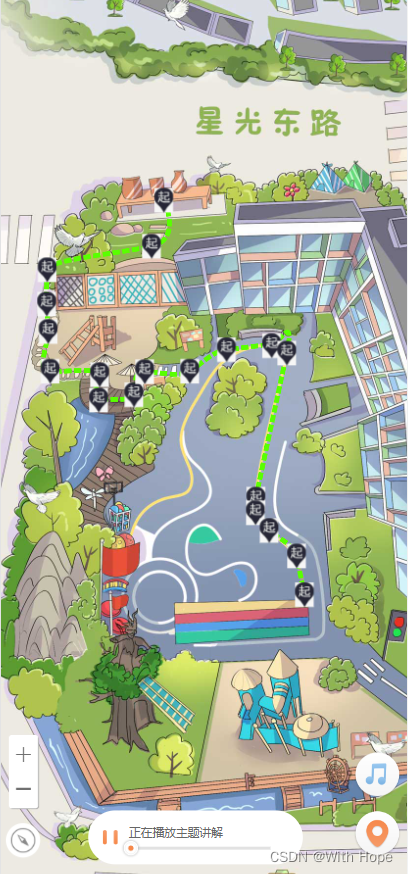
使用 canvas 绘制 跟随鼠标自定义路线 或 点使用贝塞尔曲线 自动绘制
示例使用 angular 可自行修改 核心代码不变
基础 html 参考
<div class="container" id="container" (mousedown)="addEventListen($event)" (mouseup)="removeEventListen()"
  [ngStyle]="{'width': snadTable.width + 'px' , 'height': snadTable.height + 'px'}" id="edit-canvas">
  <img class="bg" id="bgImg" [width]="snadTable.width" [height]="snadTable.height" [src]="snadTable.background.url">

  <!-- 新路径 canvas 模式 -->
  <canvas class="way" (click)="handleNewPosition($event)" (mousedown)="$event.preventDefault()"
    [ngStyle]="{'z-index': canvasZIndex}" #way id="way" [width]="snadTable.width" [height]="snadTable.height"></canvas>

  <!-- 线路上的 关键点 icon -->
  <div *ngFor="let line of snadTable.paths">
    <div class="line" *ngFor="let keyPoint of line.points" [ngClass]="{'activity': currKeyPoint.uid === keyPoint.uid }"
      [ngStyle]="{'left': keyPoint?.position?.x - (keyPoint?.width / 2) + 'px' , 'top': keyPoint?.position?.y - (keyPoint?.height / 2) + 'px', 'transform': 'scale(' + keyPoint.scale + ') rotate(' +keyPoint.rotate + 'deg)'}"
      (click)="onSetKeyPoint(keyPoint)" (click)="$event.preventDefault()" (mousedown)="$event.preventDefault()">
      <img class=" " [src]="keyPoint.url"
        [ngStyle]="{'width': keyPoint.width + 'px', 'height': keyPoint.height + 'px' }">
    </div>
  </div>
  <!-- 新 关键点 -->
  <div class="line" *ngIf="currKeyPoint?.uid"
    [ngStyle]="{'left': currKeyPoint?.position?.x - (currKeyPoint?.width / 2) + 'px' , 'top': currKeyPoint?.position?.y - (currKeyPoint?.height / 2) + 'px', 'transform': 'scale(' + currKeyPoint.scale + ') rotate(' +currKeyPoint.rotate + 'deg)'}"
    (mousedown)="$event.preventDefault()">
    <img class="" [src]="currKeyPoint.url"
      [ngStyle]="{'width': currKeyPoint.width + 'px', 'height': currKeyPoint.height + 'px'}">
  </div>
</div>
css 加一些定位就行
ts 逻辑
  /** 创建画布 配置样式 */
  createdCtx(): void {
    this.ctx = this.way.nativeElement.getContext("2d");
    console.log(this.ctx);

    // this.ctx.strokeStyle = 'rgb(255,221,0)';
    // const that = this;
    // var img = new Image();
    // img.src = 'https://mdn.mozillademos.org/files/222/Canvas_createpattern.png';
    // img.onload = function () {
    //   var pattern = that.ctx.createPattern(img, 'repeat');
    //   that.ctx.strokeStyle = pattern;
    //   // that.ctx.fillRect(0, 0, 400, 400);
    // };
    this.ctx.setLineDash([15, 5]);
    this.ctx.shadowOffsetX = 0;
    this.ctx.shadowOffsetY = 0;
    // this.ctx.shadowBlur = 10;
    // this.ctx.shadowColor = "#55514c";
    this.ctx.lineWidth = 10;
    // this.ctx.lineDashOffset = 3
    // this.ctx.strokeStyle = "red"
  }
/** 监听开始滑动 */
addEventListen(e): void {
   this.canvasZIndex = 99; // 处于最高层级, 使操作跟手
   document.getElementById("way").addEventListener('mousemove', this.handleMapPositin, false);
  }
/** 移除监听事件 */
removeEventListen(): void {
    document.getElementById("way").removeEventListener('mousemove', this.handleMapPositin, false);
    this.canvasZIndex = 0; //
    this.isAddEventListen = false;
  }
  /**
   * 触摸中处理逻辑函数 自定义
   * 该处 使用 贝塞尔函数辅助划线
   * 不使用的 可直接进行赋值绘画,则为自定义画
   */
  handleMapPositin = (e) => {
    this.currKeyPoint.position = { x: e.layerX, y: e.layerY };
      this.bzCurve();
      // this.drawWay(e.layerX, e.layerY); // 自定义画
  }
 /** 不使用贝塞尔曲线绘制函数 */
 drawWay(x: number, y: number): void {
    if (this.isMoveTo) {
      this.ctx.moveTo(x, y);
      this.isMoveTo = false;
    } else {
      this.ctx.lineTo(x, y);
    }
    this.ctx.stroke();
  }
/** 使用贝塞尔曲线 */
 bzCurve(f: number = .3, t: number = .5) {
    this.ctx.clearRect(0, 0, this.snadTable.width, this.snadTable.height);  // 每次绘制重置画布防残留,配合下面的延时 setTimeout 一起使用
    if (this.snadTable.paths?.length > 0) { // 多条不连续路线循环绘制
      setTimeout(() => {
        for (const line of this.snadTable.paths) {
          if (line.points?.length > 0) {
            const points = line.points.map(val => val.position);
            // console.log(points);
            this.ctx.strokeStyle = line.color;
            this.ctx.beginPath();
            this.ctx.moveTo(points[0].x, points[0].y);
            let m = 0;
            let dx1 = 0;
            let dy1 = 0;
            let preP = points[0];
            let dx2 = 0;
            let dy2 = 0;
            for (var i = 1; i < points.length; i++) {
              let curP = points[i];
              const nexP = points[i + 1];
              if (nexP) {
                m = this.gradient(preP, nexP);
                dx2 = (nexP.x - curP.x) * -f;
                dy2 = (nexP.y - curP.y) * -f; // dx2 * m * t;
              } else {
                dx2 = 0;
                dy2 = 0;
              }
              this.ctx.bezierCurveTo(
                preP.x - dx1, preP.y - dy1,
                curP.x + dx2, curP.y + dy2,
                curP.x, curP.y
              );
              dx1 = dx2;
              dy1 = dy2;
              preP = curP;
            }
            this.ctx.stroke();
          }
        }
      }, 1);
    }
  }
  /** 两点的斜率 */
  gradient(a, b): number {
    return (b.y - a.y) / (b.x - a.x);
  }
