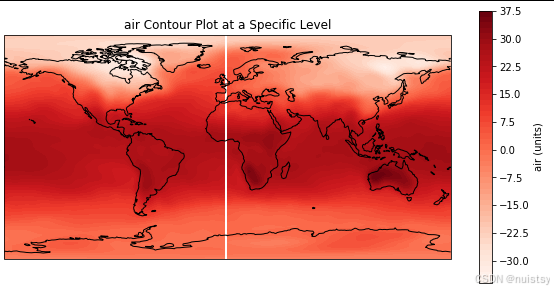
import netCDF4 as nc
import matplotlib.pyplot as plt
import cartopy.crs as ccrs

# 打开NetCDF数据文件
dataset = nc.Dataset('D:/data/data/data.nc', 'r')

# 从文件中读取经度、纬度以及温度数据
lon = dataset.variables['lon'][:]
lat = dataset.variables['lat'][:]
air = dataset.variables['air'][:]

# 选择一个特定的时间层或高度层进行绘图
# 选择一个特定的时间步和高度层进行绘图
time_step = 0  # 选择第一个时间步
level = 0  # 示例:选择第一层数据

# 创建一个地图投影
proj = ccrs.PlateCarree()

# 绘制温度场的等值线图
plt.figure(figsize=(10, 5))
ax = plt.axes(projection=proj)
ax.coastlines()  # 添加海岸线
plt.contourf(lon, lat, air[time_step,level, :, :], levels=50, cmap='Reds', transform=ccrs.PlateCarree())
plt.colorbar(label='air (units)')  # 显示颜色条
plt.title('air Contour Plot at a Specific Level')  # 设置图表标题
plt.show()

# 关闭NetCDF数据文件
dataset.close()

