【读书向】阿里云天池大赛赛题解析——可视化
import pandas as pd
import numpy as np
import seaborn as sns
import matplotlib.pyplot as plt
%matplotlib inline
from scipy import stats
import warnings
warnings.filterwarnings('ignore')

from sklearn.metrics import mean_squared_error
train_data = pd.read_csv('../Book/阿里云天池大赛赛题解析/input/工业蒸汽量预测/zhengqi_train.txt',sep='\t',encoding='utf-8')
test_data  = pd.read_csv('../Book/阿里云天池大赛赛题解析/input/工业蒸汽量预测/zhengqi_test.txt', sep='\t',encoding='utf-8')
train_data.head()
| V0 | V1 | V2 | V3 | V4 | V5 | V6 | V7 | V8 | V9 | ... | V29 | V30 | V31 | V32 | V33 | V34 | V35 | V36 | V37 | target | |
|---|---|---|---|---|---|---|---|---|---|---|---|---|---|---|---|---|---|---|---|---|---|
| 0 | 0.566 | 0.016 | -0.143 | 0.407 | 0.452 | -0.901 | -1.812 | -2.360 | -0.436 | -2.114 | ... | 0.136 | 0.109 | -0.615 | 0.327 | -4.627 | -4.789 | -5.101 | -2.608 | -3.508 | 0.175 |
| 1 | 0.968 | 0.437 | 0.066 | 0.566 | 0.194 | -0.893 | -1.566 | -2.360 | 0.332 | -2.114 | ... | -0.128 | 0.124 | 0.032 | 0.600 | -0.843 | 0.160 | 0.364 | -0.335 | -0.730 | 0.676 |
| 2 | 1.013 | 0.568 | 0.235 | 0.370 | 0.112 | -0.797 | -1.367 | -2.360 | 0.396 | -2.114 | ... | -0.009 | 0.361 | 0.277 | -0.116 | -0.843 | 0.160 | 0.364 | 0.765 | -0.589 | 0.633 |
| 3 | 0.733 | 0.368 | 0.283 | 0.165 | 0.599 | -0.679 | -1.200 | -2.086 | 0.403 | -2.114 | ... | 0.015 | 0.417 | 0.279 | 0.603 | -0.843 | -0.065 | 0.364 | 0.333 | -0.112 | 0.206 |
| 4 | 0.684 | 0.638 | 0.260 | 0.209 | 0.337 | -0.454 | -1.073 | -2.086 | 0.314 | -2.114 | ... | 0.183 | 1.078 | 0.328 | 0.418 | -0.843 | -0.215 | 0.364 | -0.280 | -0.028 | 0.384 |
5 rows × 39 columns
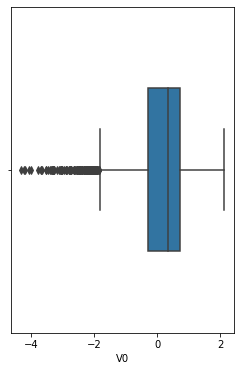
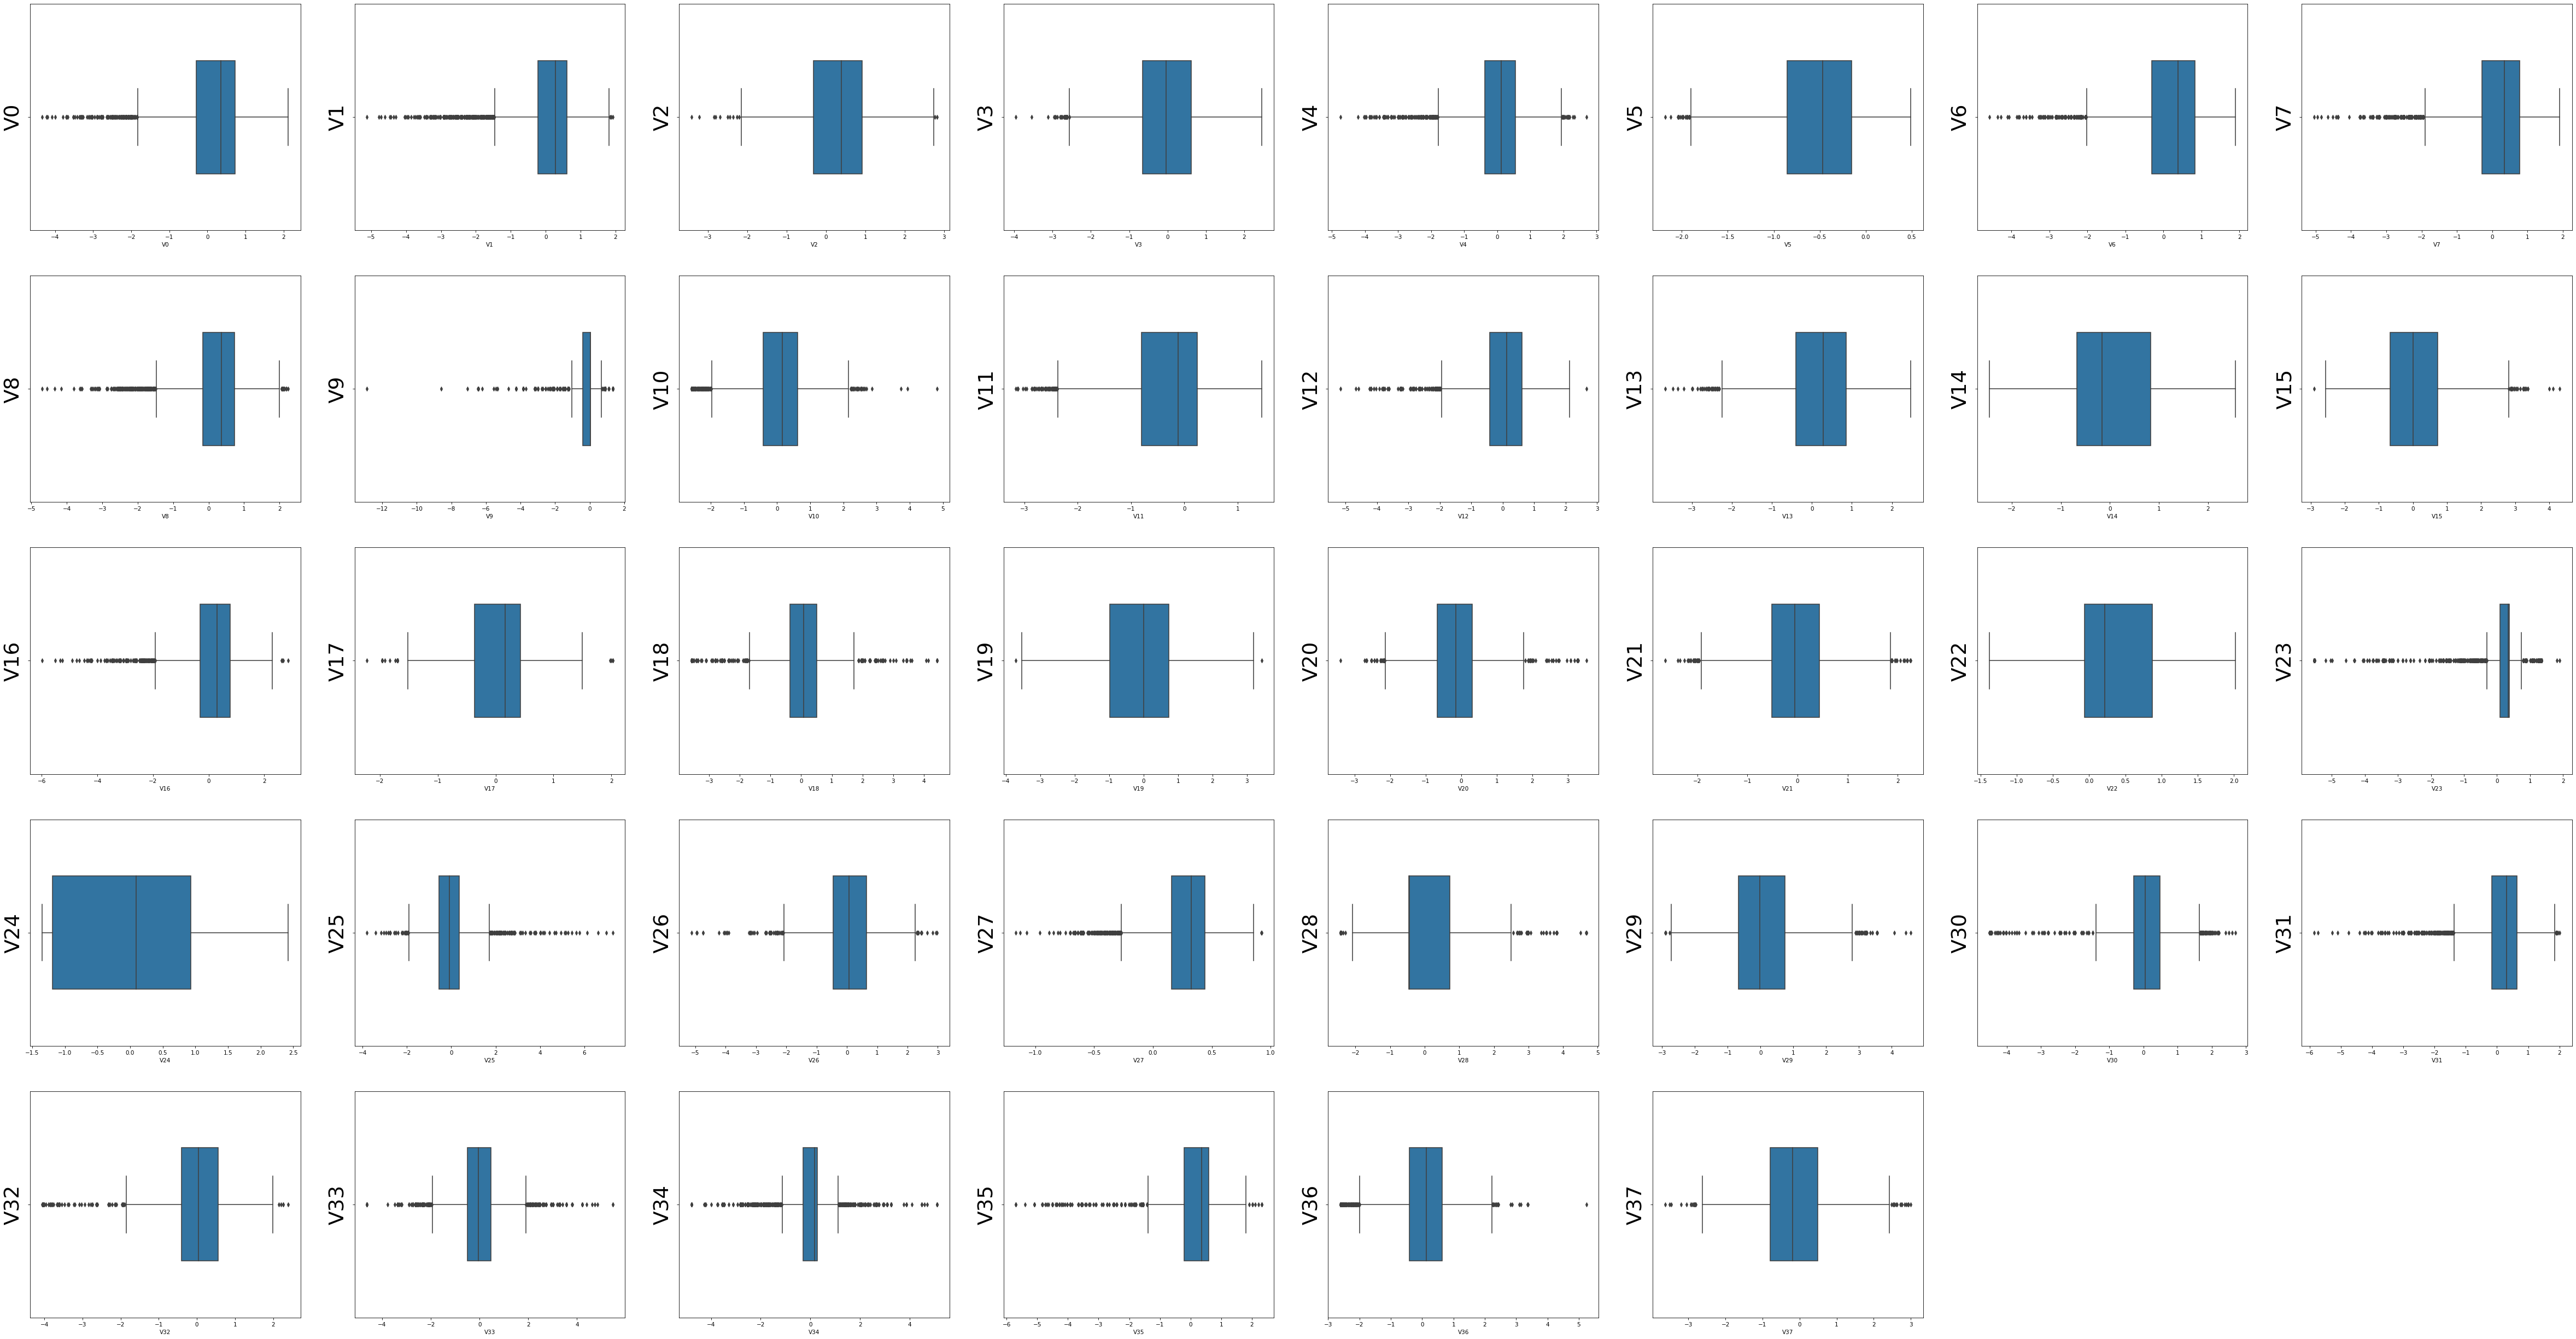
箱型图
fig = plt.figure(figsize=(4,6))
sns.boxplot(train_data['V0'],orient='v',width=0.5)
<AxesSubplot:xlabel='V0'>
columns = train_data.columns.tolist()[:39]
fig = plt.figure(figsize=(80,60),dpi=75)
for i in range(38):
    plt.subplot(7,8,i+1)
    sns.boxplot(train_data[columns[i]],orient='v',width=0.5)
    plt.ylabel(columns[i],fontsize=36)
plt.show()
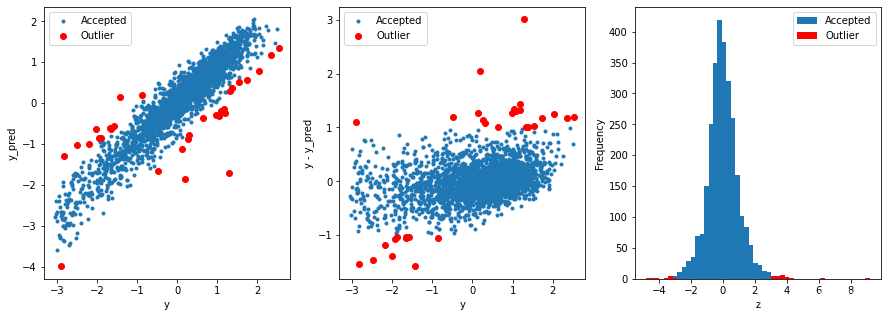
获取异常数据的函数
def find_outliers(model,X,y,sigma=3):

    # predict y values using model
    try:
        y_pred = pd.Series(model.predict(X),index=y.index)
    # if predicting fails, try fitting the model first
    except:
        model.fit(X,y)
        y_pred = pd.Series(model.predict(X),index=y.index)

    # calculate residuals between the model prediction and true y values
    resid = y - y_pred
    mean_resid = resid.mean()
    std_resid  = resid.std()

    # calculate z statistic, define outliers to be where |z|>sigma
    z = (resid-mean_resid)/std_resid
    outliers = z[abs(z)>sigma].index

    # print and plot the results
    print('R2=',model.score(X,y))
    print('Mse=',mean_squared_error(y,y_pred))
    print('-------------------------------------------------------')

    print(len(outliers),'outliers;',' ALL data shape:',X.shape)

    plt.figure(figsize=(15,5))
    ax_131 = plt.subplot(1,3,1)
    plt.plot(y,y_pred,'.')
    plt.plot(y.loc[outliers],y_pred.loc[outliers],'ro')
    plt.legend(['Accepted','Outlier'])
    plt.xlabel('y')
    plt.ylabel('y_pred');

    ax_132 = plt.subplot(1,3,2)
    plt.plot(y,y-y_pred,'.')
    plt.plot(y.loc[outliers],y.loc[outliers]-y_pred.loc[outliers],'ro')
    plt.legend(['Accepted','Outlier'])
    plt.xlabel('y')
    plt.ylabel('y - y_pred');

    ax_133 = plt.subplot(1,3,3)
    z.plot.hist(bins=50,ax=ax_133)
    z.loc[outliers].plot.hist(color='r',bins=50,ax=ax_133)
    plt.legend(['Accepted','Outlier'])
    plt.xlabel('z')

    plt.savefig('outliers.png')

    return outliers
# 通过岭回归模型找出异常值,并绘制其分布
from sklearn.linear_model import Ridge
from sklearn.metrics import mean_squared_error
X_train = train_data.iloc[:,0:-1]
y_train = train_data.iloc[:,-1]
outliers = find_outliers(Ridge(),X_train,y_train)
R2= 0.8890858938210388
Mse= 0.10734857773123628
-------------------------------------------------------
31 outliers;  ALL data shape: (2888, 38)
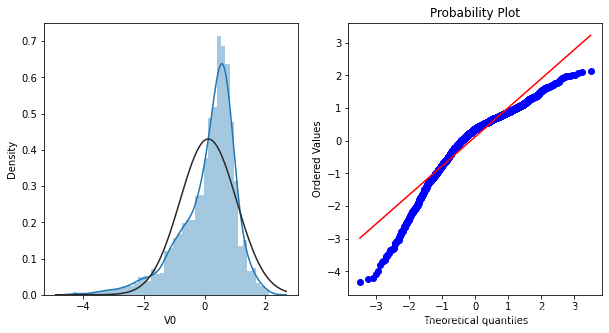
直方图和Q-Q图
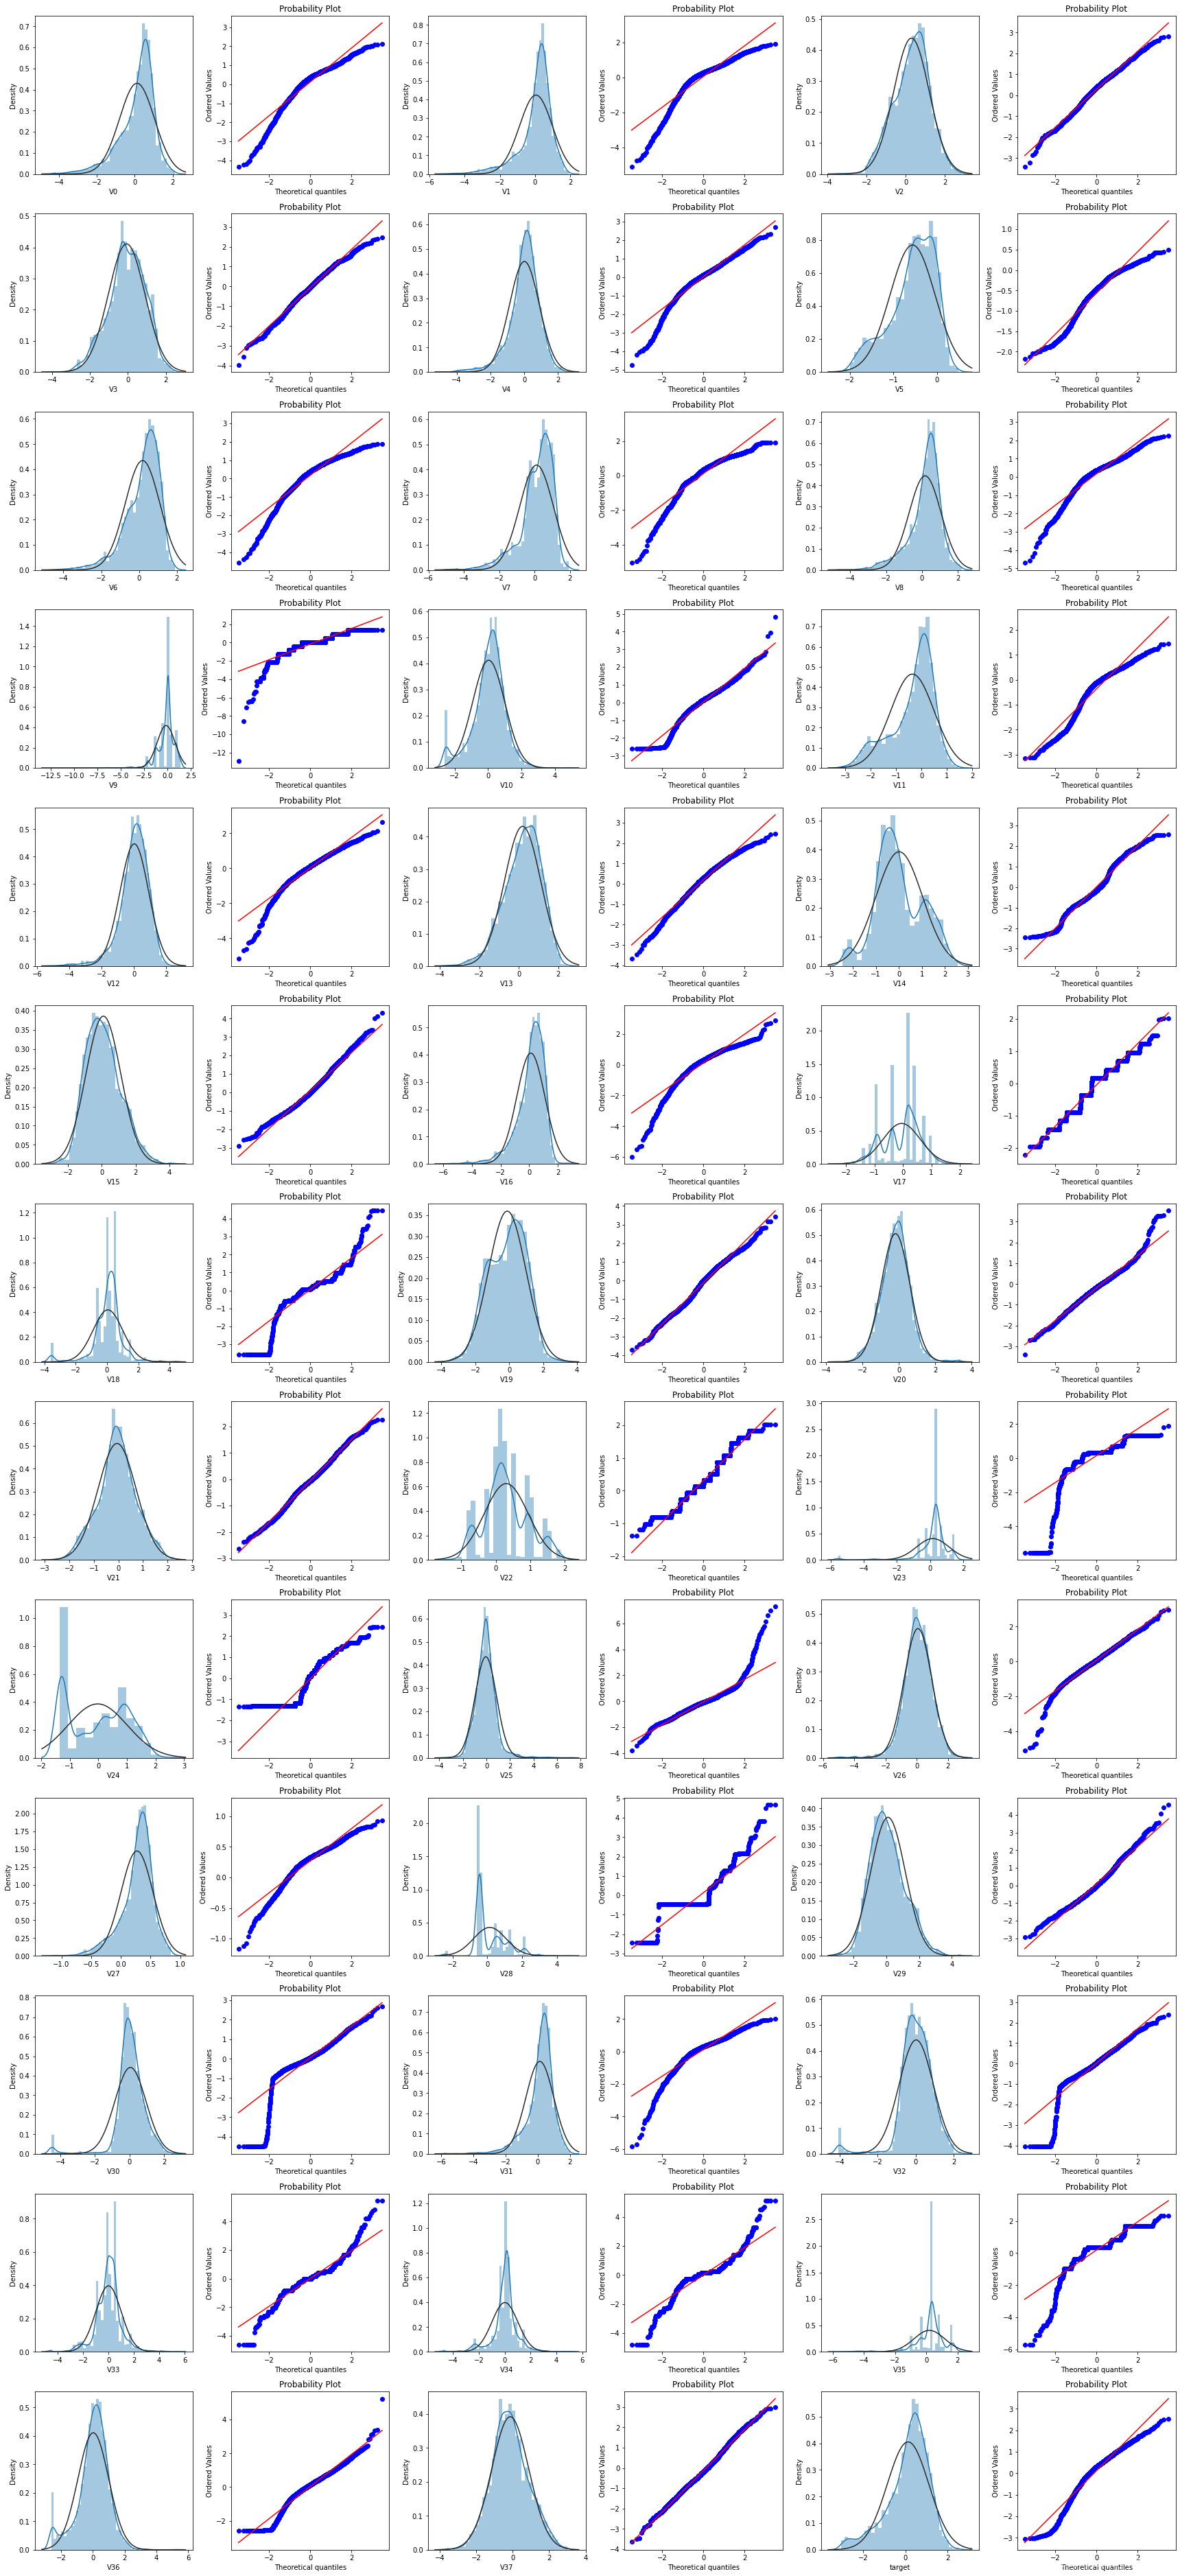
Q-Q图是指数据的分位数和正态分布的分位数对比参照的图,如果数据符合正态分布,则所有的点都会落在直线上。首先,通过绘制变量V0的直方图查看其在训练集集中的统计分布,并绘制Q-Q图查看V0的分布是否近似于正态分布
plt.figure(figsize=(10,5))

ax = plt.subplot(1,2,1)
sns.distplot(train_data['V0'],fit=stats.norm)
ax = plt.subplot(1,2,2)
res = stats.probplot(train_data['V0'],plot=plt)
train_cols = 6
train_rows = len(train_data.columns)
plt.figure(figsize=(4*train_cols,4*train_rows))

i = 0
for col in train_data.columns:
    i+=1
    ax = plt.subplot(train_rows,train_cols,i)
    sns.distplot(train_data[col],fit=stats.norm)

    i+=1
    ax = plt.subplot(train_rows,train_cols,i)
    stats.probplot(train_data[col],plot=plt)

# tight_layout会自动调整子图参数,使之填充整个图像区域
plt.tight_layout()
plt.show()
很多特征变量如V1,V9,V24,V28等的数据分布不是正态的,数据并不跟随对角线分布,后续可以使用数据变换对其进行处理
KDE分布图
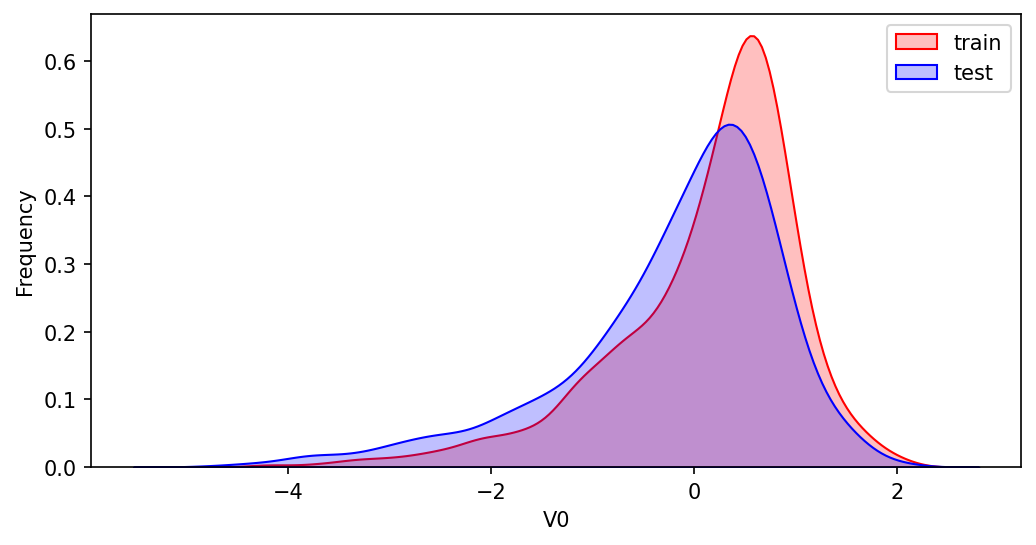
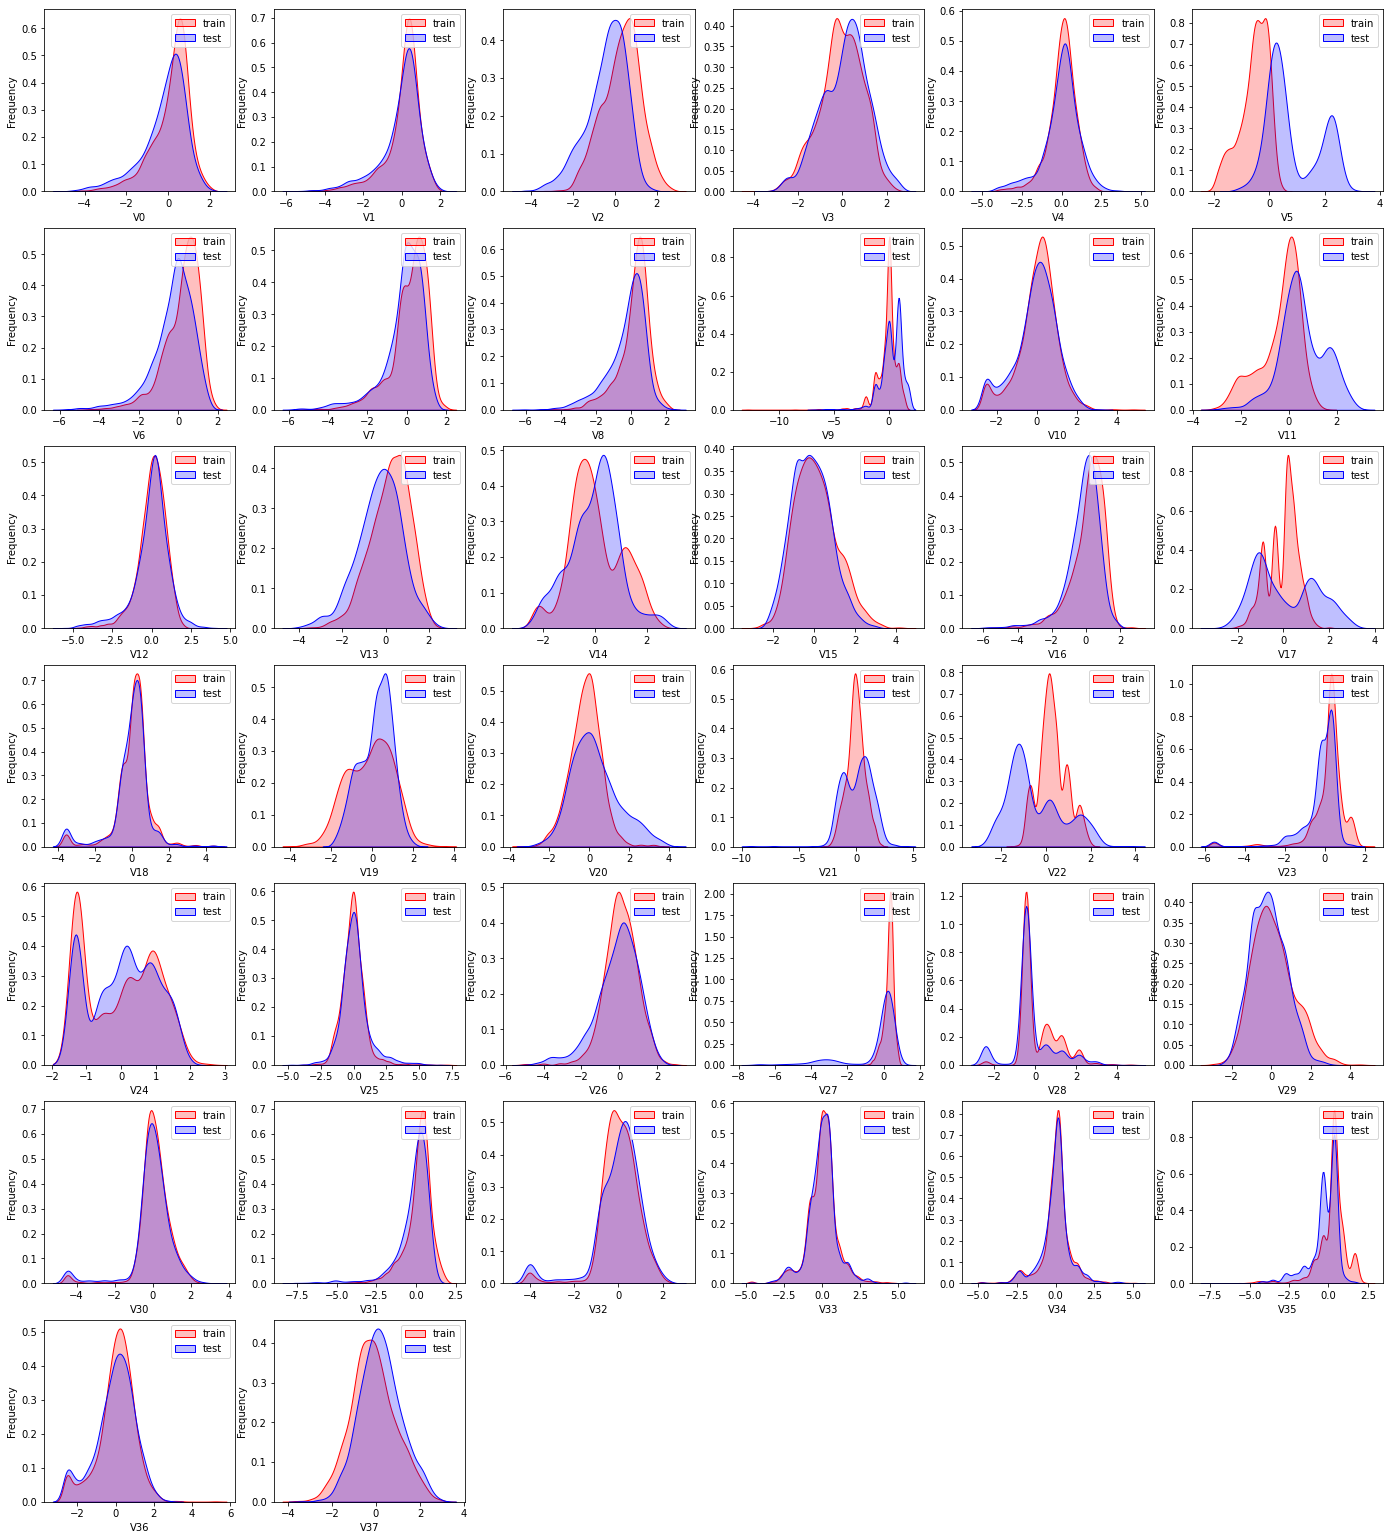
KDE核密度估计 可以理解为是对直方图的加窗平滑。通过绘制KDE分布图,可以查看并对比训练集和测试集中特征变量的分布情况,发现两个数据集中分布不一致的特征变量。
col_name = 'V0'
plt.figure(figsize=(8,4),dpi=150)
ax = sns.kdeplot(train_data[col_name],color='Red',shade=True)
ax = sns.kdeplot(test_data[col_name],color='Blue',shade=True)
ax.set_xlabel(col_name)
ax.set_ylabel('Frequency')
ax = ax.legend(['train','test'])
dist_cols = 6
dist_rows = len(test_data.columns)
plt.figure(figsize=(4*dist_cols,4*dist_rows))
i = 1
for col in test_data.columns:
    ax = plt.subplot(dist_rows,dist_cols,i)
    ax = sns.kdeplot(train_data[col],color='Red',shade=True)
    ax = sns.kdeplot(test_data[col],color='Blue',shade=True)
    ax.set_xlabel(col)
    ax.set_ylabel('Frequency')
    ax = ax.legend(['train','test'])
    i+=1
plt.show()
可以发现,特征变量V5 V9 V11 V17 V22 V28在训练集和测试集中的分布不一致,这会导致模型的泛化能力变差,需要删除此类特征
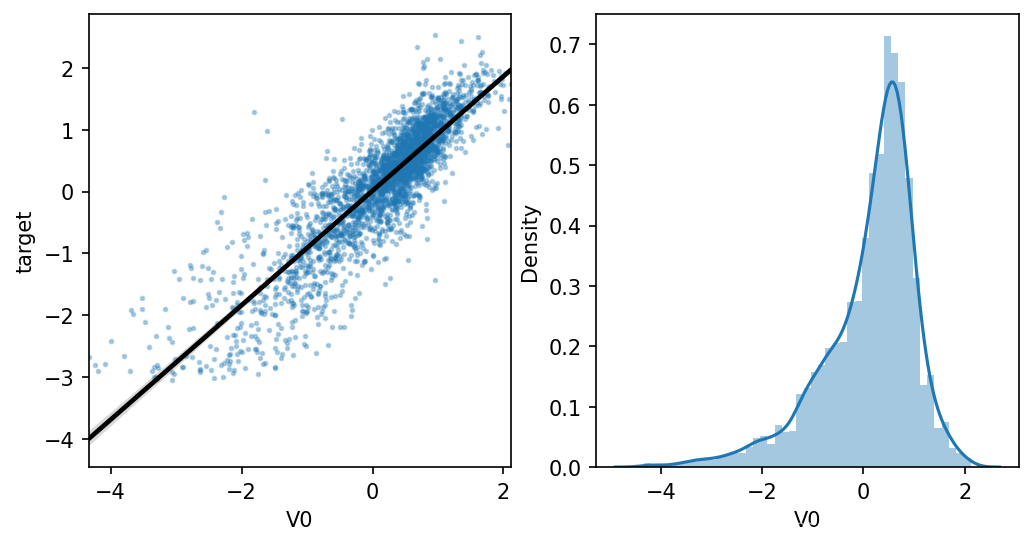
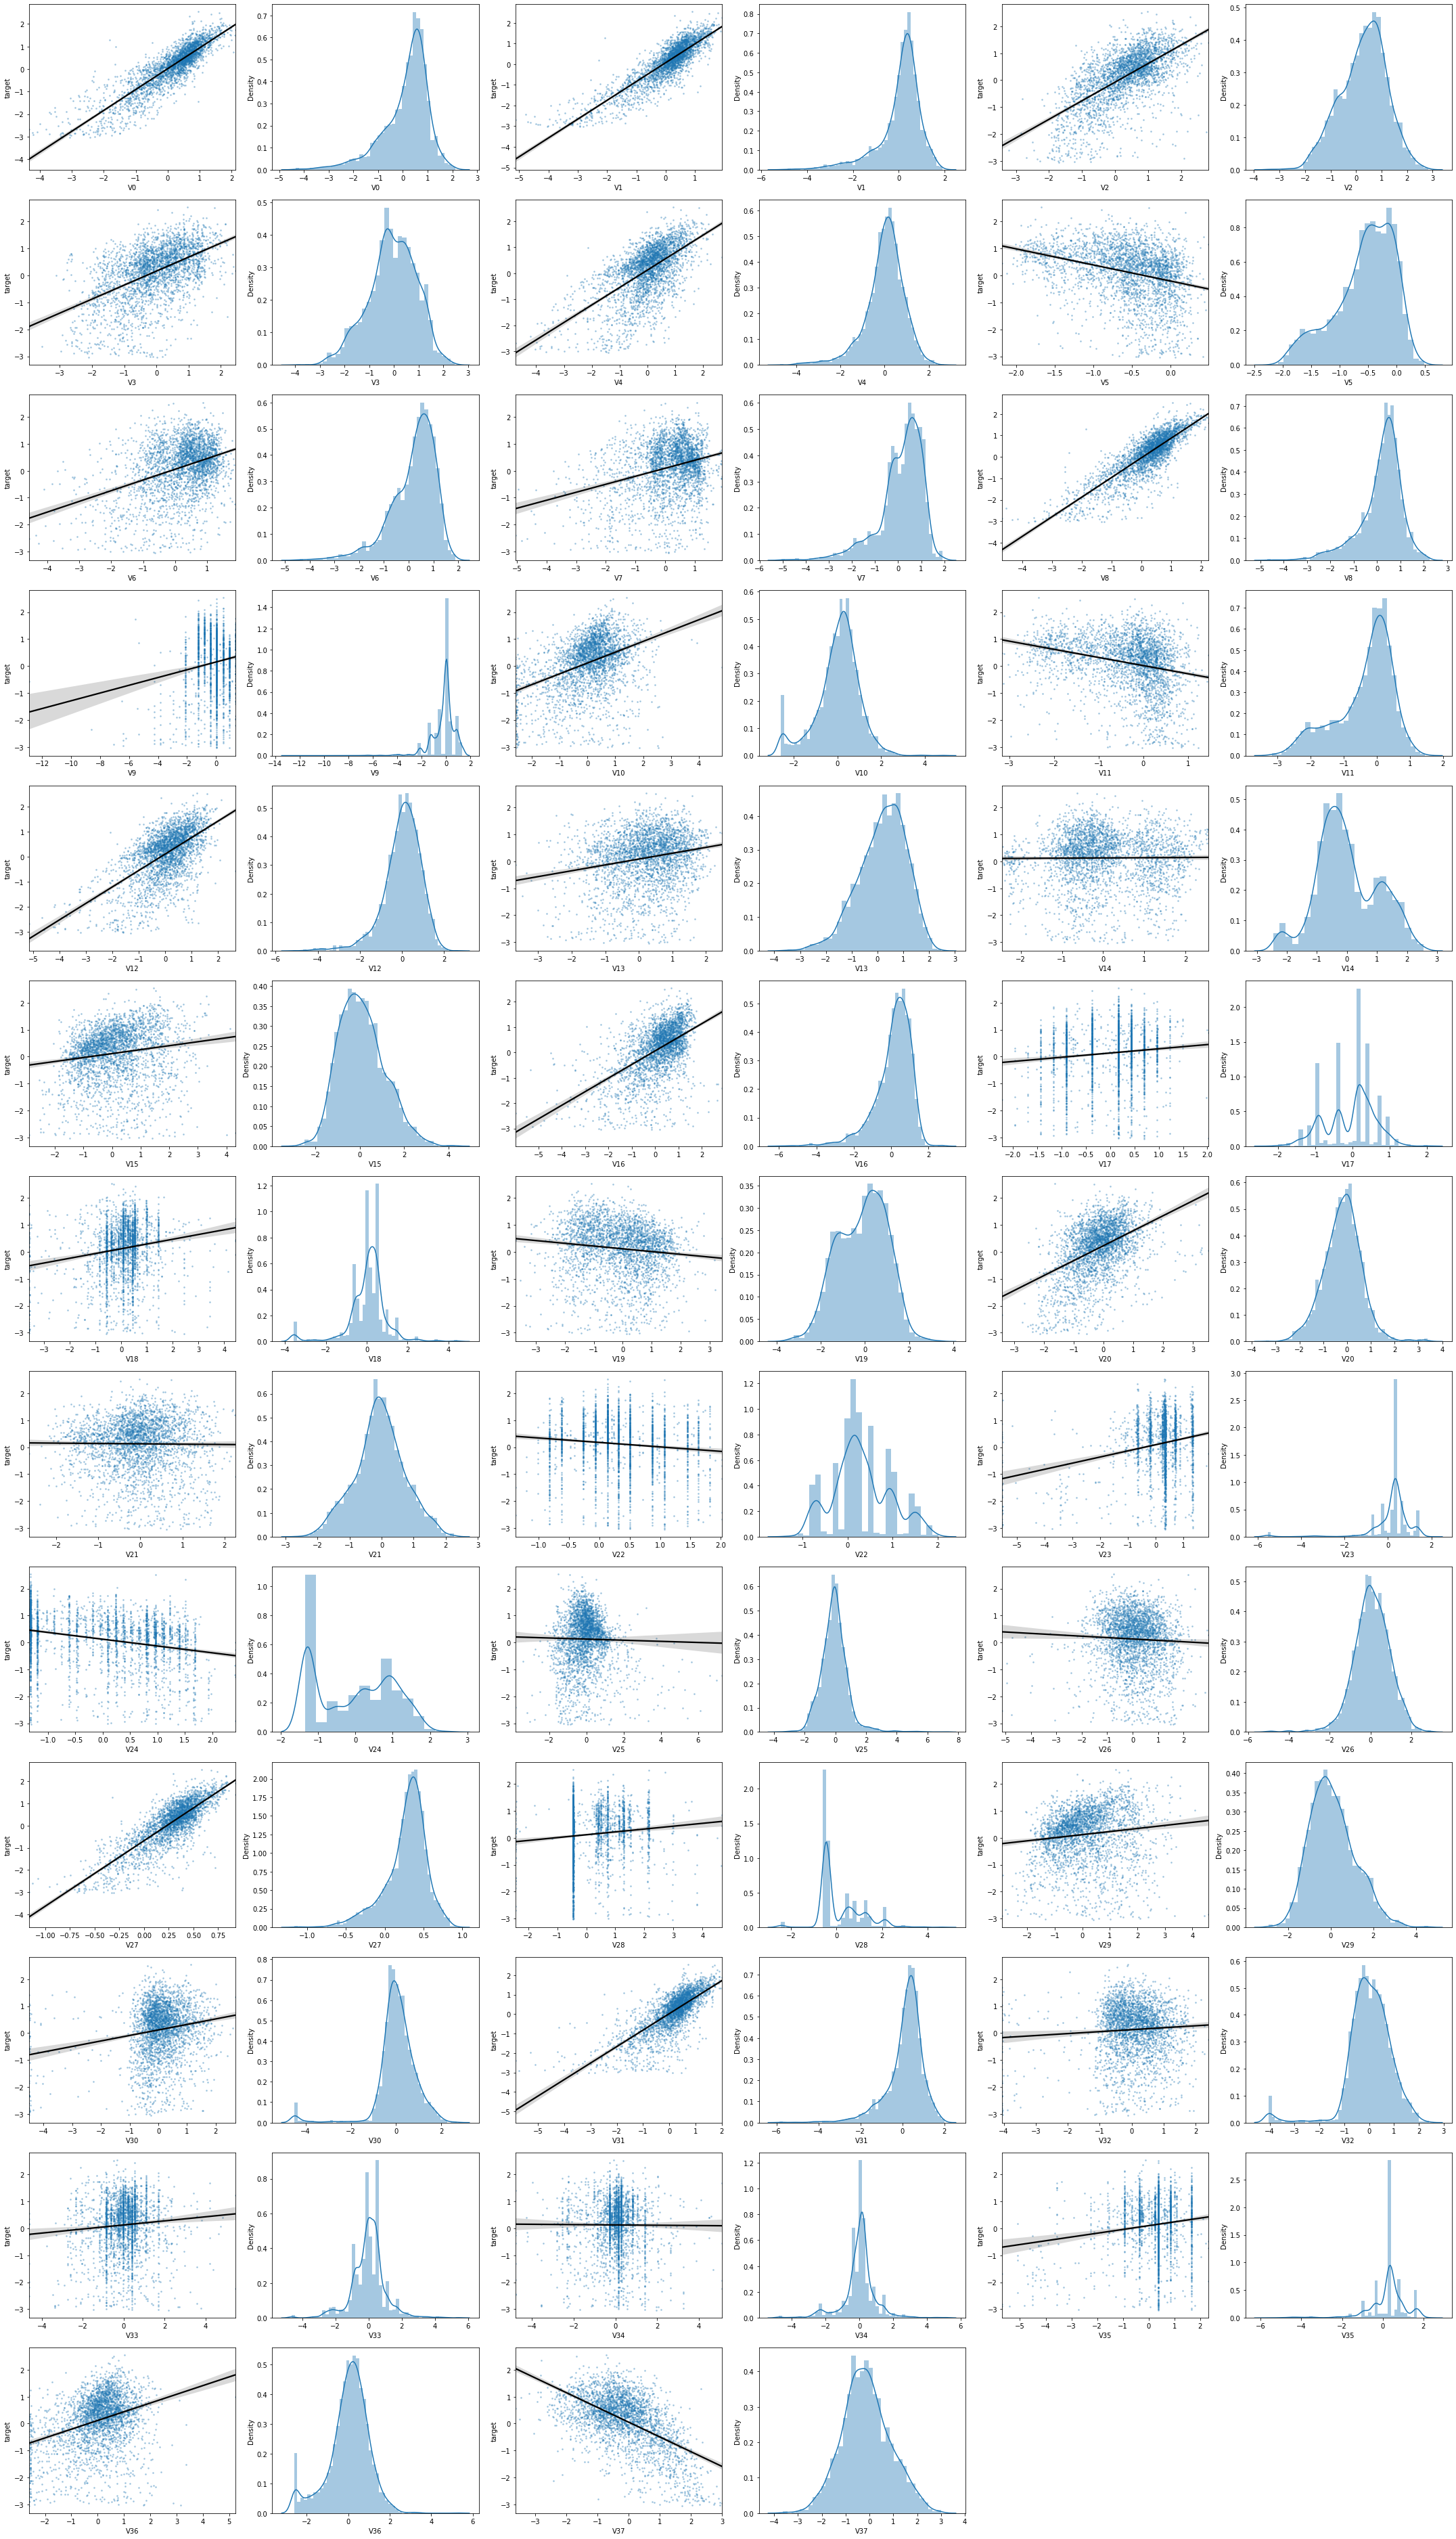
线性回归图
fcols = 2
frows = 1
plt.figure(figsize=(8,4),dpi=150)

ax = plt.subplot(1,2,1)
sns.regplot(x='V0',y='target',data=train_data,ax=ax,
           scatter_kws={'marker':'.','s':3,'alpha':0.3},
           line_kws={'color':'k'});
plt.xlabel('V0')
plt.ylabel('target')

ax = plt.subplot(1,2,2)
sns.distplot(train_data['V0'].dropna())
plt.xlabel('V0')

plt.show()
fcols = 6
frows = len(test_data.columns)
plt.figure(figsize=(5*fcols,4*frows))

i = 0
for col in test_data.columns:
    i+=1
    ax=plt.subplot(frows,fcols,i)
    sns.regplot(x=col,y='target',data=train_data,ax=ax,
               scatter_kws={'marker':'.','s':3,'alpha':0.3},
               line_kws={'color':'k'});
    plt.xlabel(col)
    plt.ylabel('target')

    i+=1
    ax = plt.subplot(frows,fcols,i)

    sns.distplot(train_data[col].dropna())
    plt.xlabel(col)

plt.tight_layout()
plt.show()
查看所有特征变量与Target变量的线性回归关系
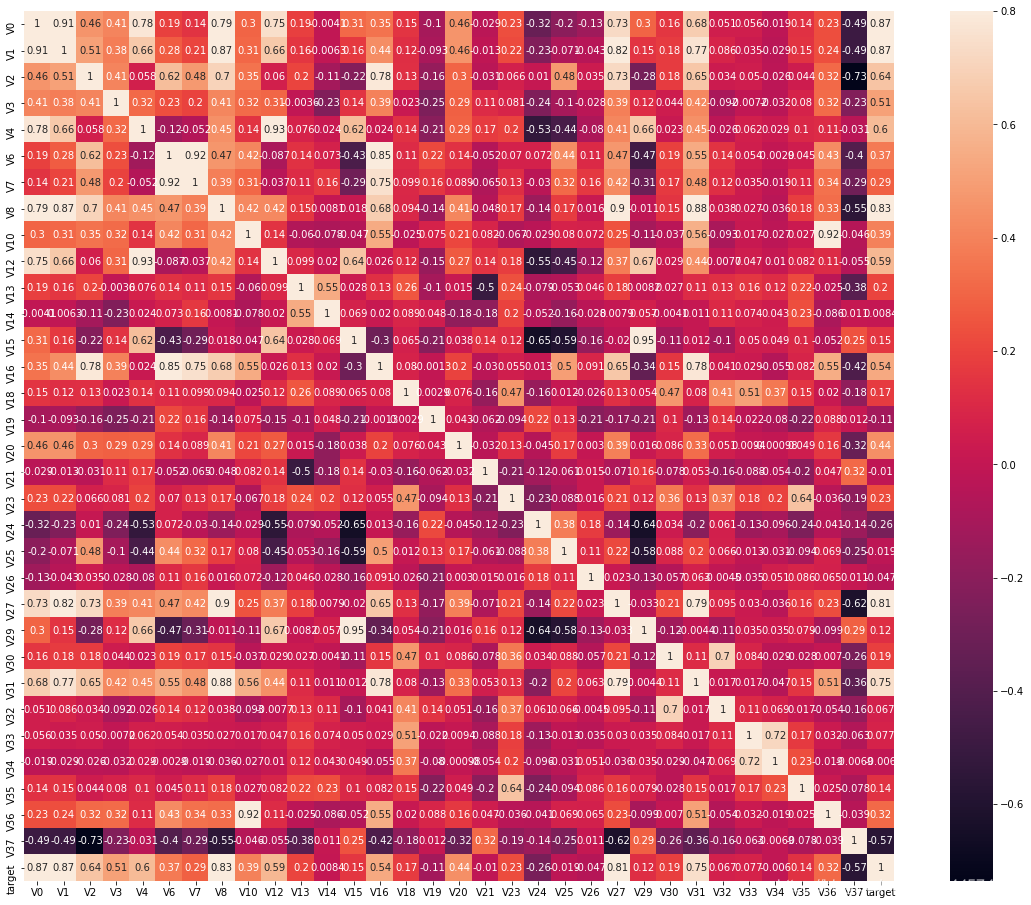
特征变量的相关性
pd.set_option('display.max_columns',10)
pd.set_option('display.max_rows',10)
data_train1 = train_data.drop(['V5', 'V9', 'V11', 'V17', 'V22', 'V28'],axis=1)
train_corr = data_train1.corr()

ax = plt.subplots(figsize=(20,16))
ax = sns.heatmap(train_corr,vmax=.8,square=True,annot=True)
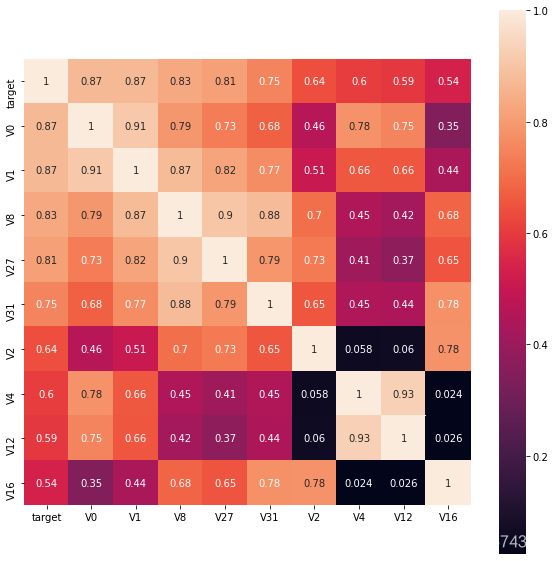
寻找K个与target变量最相关的特征变量
k = 10
cols = train_corr.nlargest(k,'target')['target'].index

cm = np.corrcoef(train_data[cols].values.T)
hm = plt.subplots(figsize=(10,10))
hm = sns.heatmap(train_data[cols].corr(),annot=True,square=True)
plt.show()
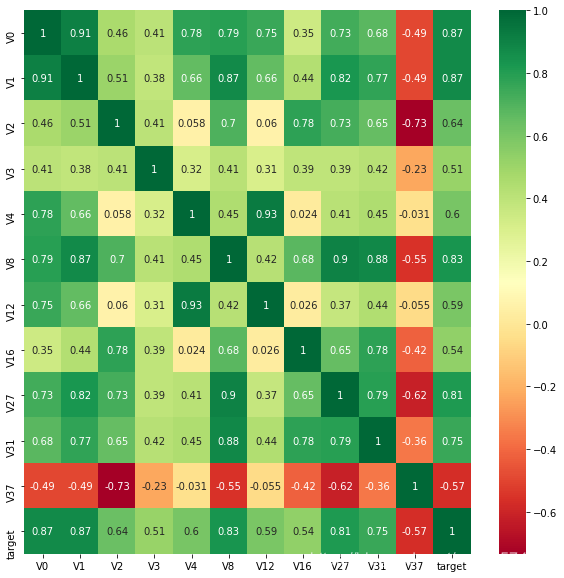
找出与target变量的相关系数大于0.5的特征变量
threshold = 0.5

corrmat = train_data.corr()
top_corr_features = corrmat.index[abs(corrmat['target'])>threshold]
plt.figure(figsize=(10,10))
g = sns.heatmap(train_data[top_corr_features].corr(),annot=True,cmap='RdYlGn')
说明:相关性选择主要用于判别线性相关,对于target变量如果存在更复杂的函数形式影响,则建议使用树模型的特征重要性去选择
# 用相关系数阈值移除相关特征
threshold = 0.5

corr_matrix = data_train1.corr().abs()
drop_col = corr_matrix[corr_matrix['target']<threshold].index
# data_all.drop(drop_col,axis=1,inplace=True)
Box-Cox变换
在连续的响应变量不满足正态分布时,可以使用Box-Cox变换,可使线性回归模型在满足线性、正态性、独立性及方差齐性的同时,又不丢失信息。
在Box-Cox变换后,可以在一定程度上减小不可观测的误差和预测变量的相关性,这有利于线性模型的拟合及分析出特征的相关性。
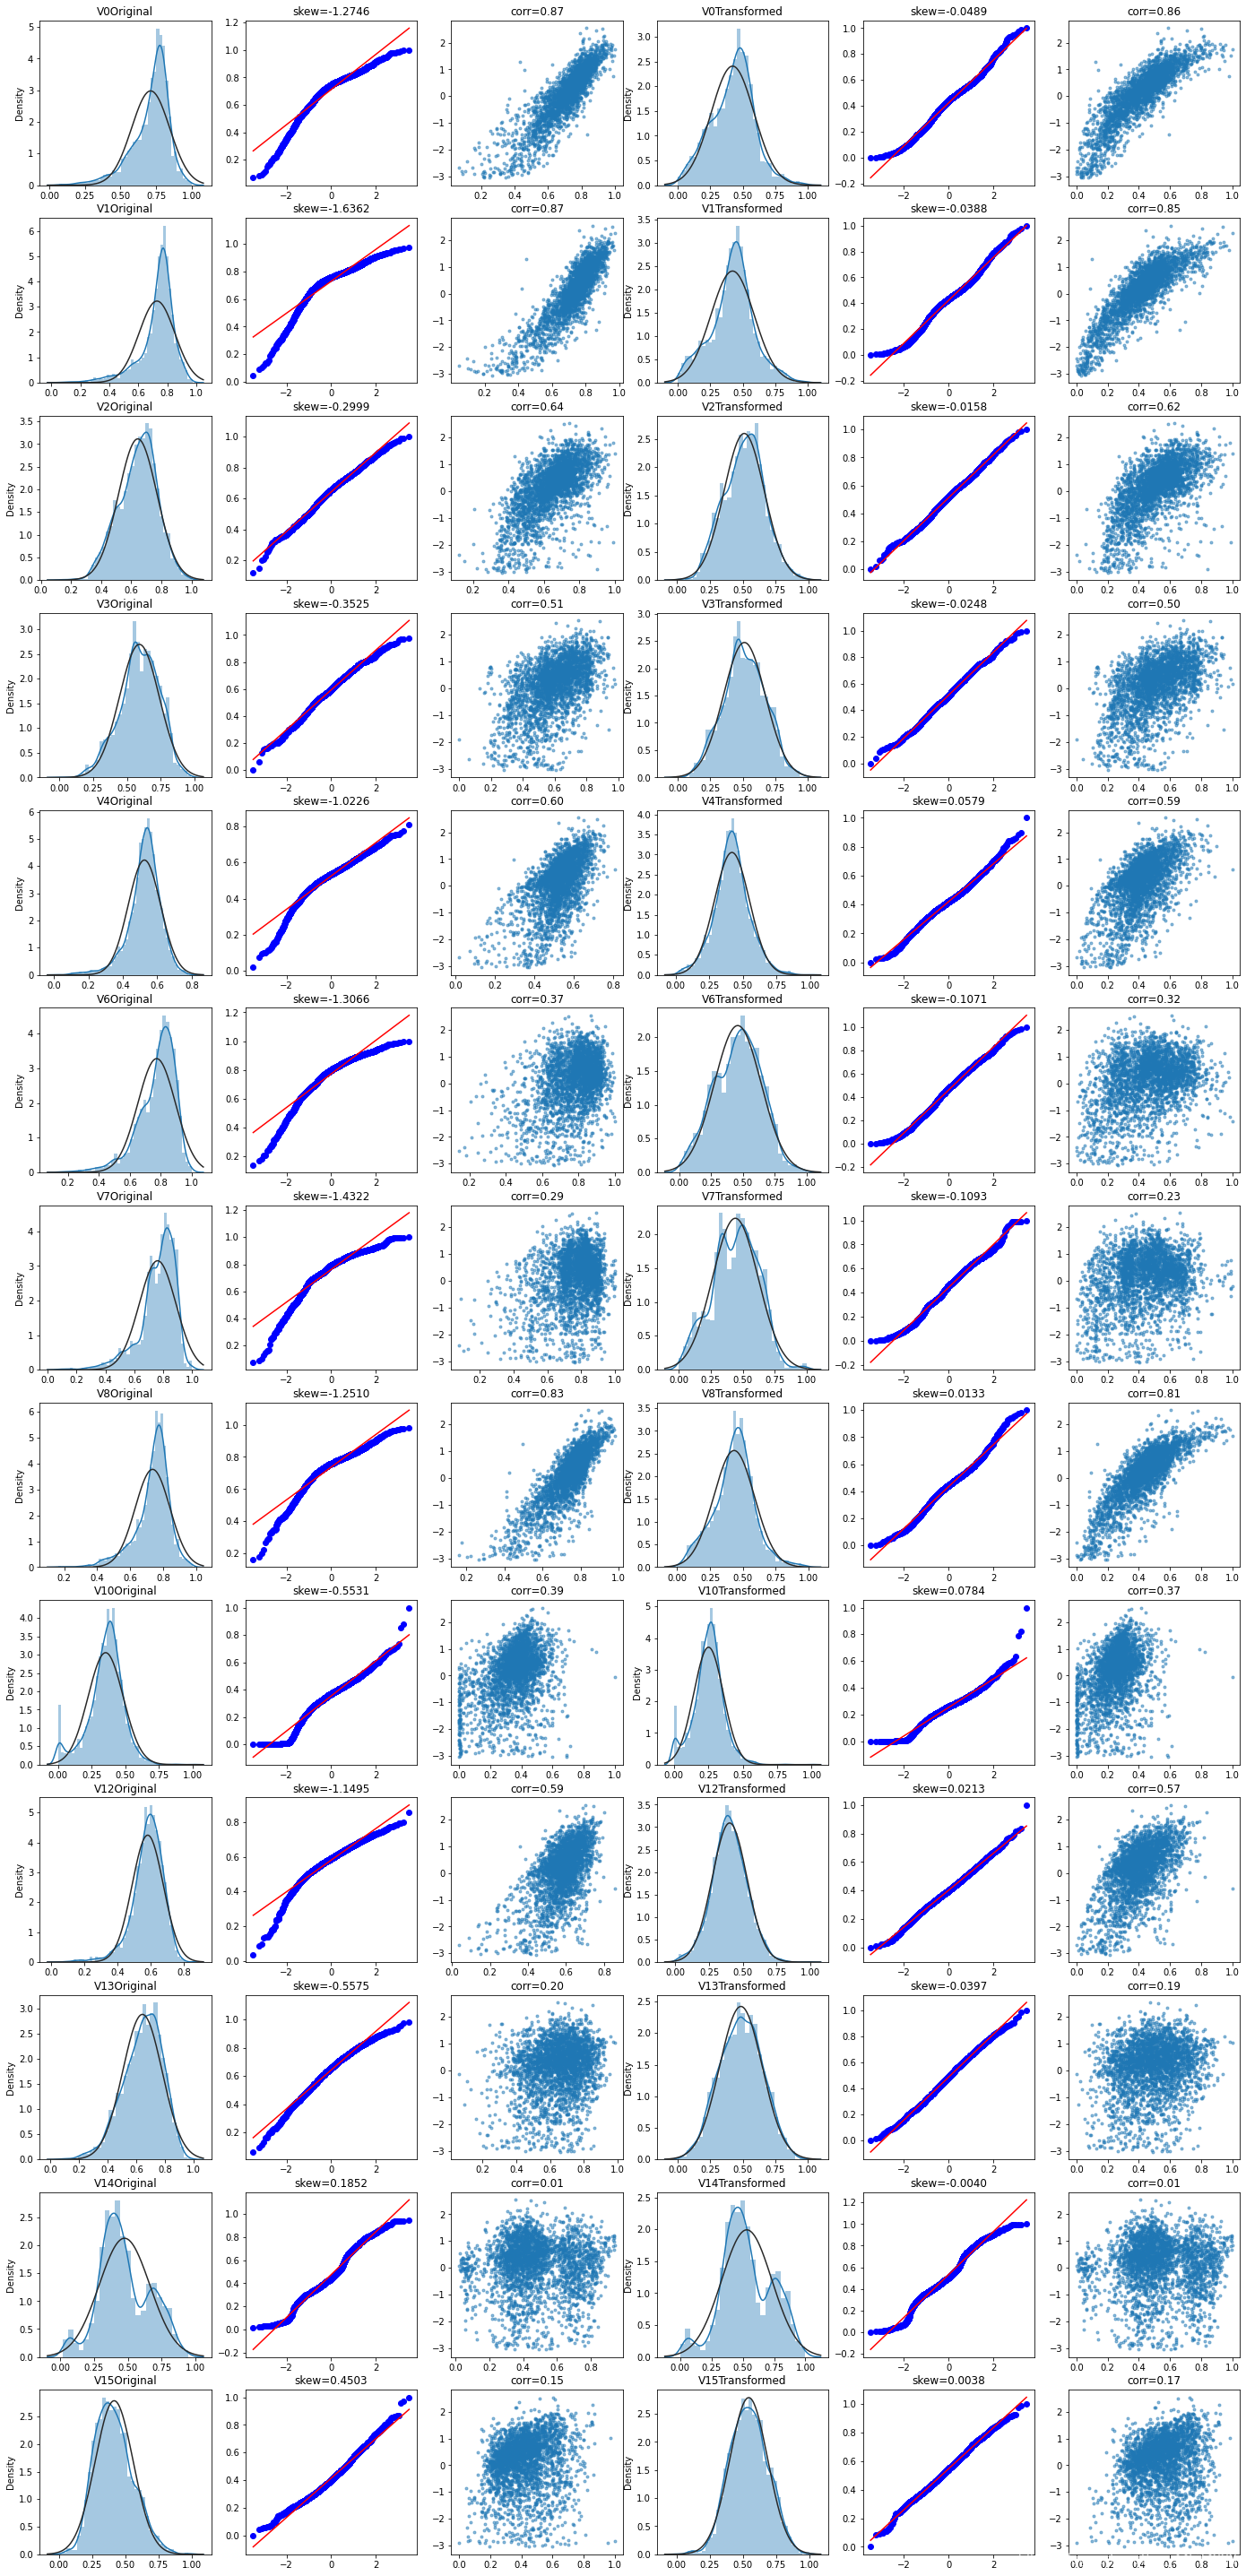
在Box-Cox变换之前,需要对数据做归一化预处理
drop_columns = ['V5', 'V9', 'V11', 'V17', 'V22', 'V28']
# 合并训练集和测试集
train_x = train_data.drop(['target'],axis=1)
train_x['flag'] = 'train'
test_data['flag'] = 'test'

data_all = pd.concat([train_x,test_data],axis=0,ignore_index=True)
data_all.drop(drop_columns,axis=1,inplace=True)

# 归一化
cols_numeric = [i for i in list(data_all.columns) if i!='flag']

def scale_minmax(col):
    return (col-col.min())/(col.max()-col.min())

data_all[cols_numeric] = data_all[cols_numeric].apply(scale_minmax,axis=0)
train_data_process = data_all[data_all['flag']=='train']
train_data_process.drop(['flag'],axis=1,inplace=True)

cols_numeric_left = cols_numeric[:13]
cols_numeric_right = cols_numeric[13:]
train_data_process = pd.concat([train_data_process,train_data['target']],axis=1)

fcols = 6
frows = len(cols_numeric_left)
plt.figure(figsize=(4*fcols,4*frows))
i=0

for var in cols_numeric_left:
    dat = train_data_process[[var,'target']].dropna()
    i+=1
    plt.subplot(frows,fcols,i)
    sns.distplot(dat[var],fit=stats.norm)
    plt.title(var+' Original')
    plt.xlabel('')
    i+=1
    plt.subplot(frows,fcols,i)
    _ = stats.probplot(dat[var],plot=plt)
    plt.title('skew='+'{:.4f}'.format(stats.skew(dat[var])))
    plt.xlabel('')
    plt.ylabel('')
    i+=1
    plt.subplot(frows,fcols,i)
    plt.plot(dat[var],dat['target'],'.',alpha=0.5)
    plt.title('corr=' + '{:.2f}'.format(np.corrcoef(dat[var],dat['target'])[0][1]))

    i+=1
    plt.subplot(frows,fcols,i)
    trans_var,lambda_var = stats.boxcox(dat[var].dropna()+1)
    trans_var = scale_minmax(trans_var)
    sns.distplot(trans_var,fit=stats.norm)
    plt.title(var + ' Transformed')
    plt.xlabel('')
    i+=1
    plt.subplot(frows,fcols,i)
    _ = stats.probplot(trans_var,plot=plt)
    plt.title('skew='+'{:.4f}'.format(stats.skew(trans_var)))
    plt.xlabel('')
    plt.ylabel('')
    i+=1
    plt.subplot(frows,fcols,i)
    plt.plot(trans_var,dat['target'],'.',alpha=0.5)
    plt.title('corr='+'{:.2f}'.format(np.corrcoef(trans_var,dat['target'])[0][1]))
