3D surface
"""
@File : 05-decoding-Major
@Name : 3d_surface.py
@Author : lyq
@Date : 2024/11/16 23:10
@Envi : PyCharm
@Description: files details
"""
import numpy as np
import matplotlib.pyplot as plt
plt.rcParams['font.family'] = 'Times New Roman'
def test_dynamic_performance(alpha, beta, gamma, T, N, scenario_fluctuation=0.2):
q_n_t = np.random.uniform(1, 5, (N, T))
dynamic_fluctuations = np.random.uniform(1 - scenario_fluctuation, 1 + scenario_fluctuation, (N, T))
QoE = 0
variances = []
for t in range(T):
quality = np.mean(q_n_t[:, t] * dynamic_fluctuations[:, t])
delay = np.mean([0.1 * q * (1 + 0.1 * np.sin(10 * gamma)) for q in q_n_t[:, t]])
variance = np.var(q_n_t[:, t] * dynamic_fluctuations[:, t])
decoding = np.mean([0.05 * q * (1 + 0.05 * np.cos(7 * gamma)) for q in q_n_t[:, t]])
variances.append(variance)
QoE += (quality - alpha * delay - beta * variance - gamma * decoding)
QoE_normalized = (QoE / (T * 5)) * 10
variance_scaled = (np.mean(variances) / (5 ** 2)) * 1
return QoE_normalized, variance_scaled
alpha_range = np.linspace(0.08, 0.12, 10)
beta_range = np.linspace(0.45, 0.55, 10)
gamma_range = np.linspace(0.045, 0.055, 10)
alpha_grid, beta_grid, gamma_grid = np.meshgrid(alpha_range, beta_range, gamma_range)
qoe_surface = np.zeros_like(alpha_grid)
T = 100
N = 5
for i in range(alpha_grid.shape[0]):
for j in range(alpha_grid.shape[1]):
for k in range(alpha_grid.shape[2]):
alpha = alpha_grid[i, j, k]
beta = beta_grid[i, j, k]
gamma = gamma_grid[i, j, k]
qoe, _ = test_dynamic_performance(alpha, beta, gamma, T, N)
qoe_surface[i, j, k] = qoe
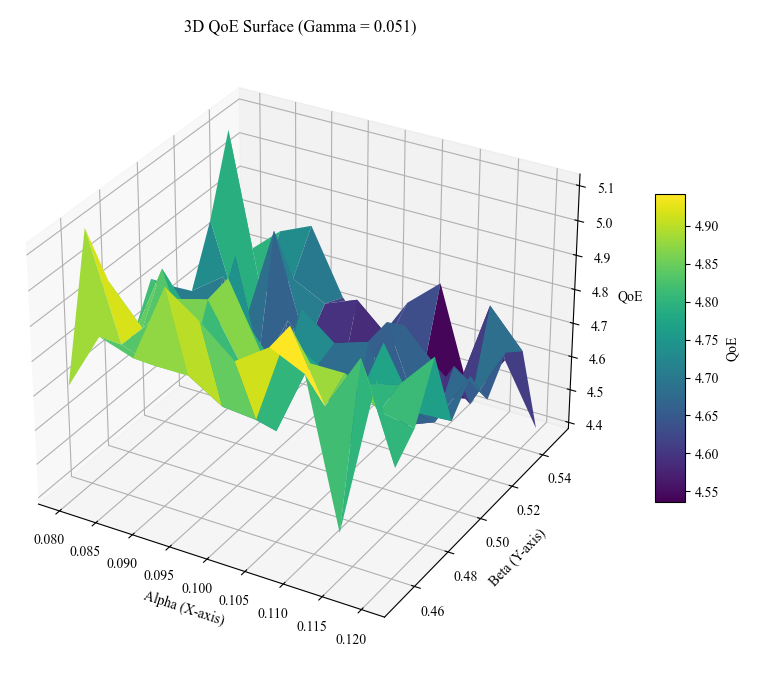
fig = plt.figure(figsize=(12, 8))
ax = fig.add_subplot(111, projection='3d')
gamma_index = len(gamma_range) // 2
qoe_slice = qoe_surface[:, :, gamma_index]
alpha_slice = alpha_grid[:, :, gamma_index]
beta_slice = beta_grid[:, :, gamma_index]
surf = ax.plot_surface(alpha_slice, beta_slice, qoe_slice, cmap='viridis')
ax.set_title(f"3D QoE Surface (Gamma = {gamma_range[gamma_index]:.3f})")
ax.set_xlabel("Alpha (X-axis)")
ax.set_ylabel("Beta (Y-axis)")
ax.set_zlabel("QoE")
fig.colorbar(surf, shrink=0.5, aspect=10, label='QoE')
plt.autoscale(tight=True)
plt.savefig('3D_QoE_Surface.pdf')
plt.show()

